

Article Figures & Data
Figures
- Figure 1.
Chemical LTD induces PYK2 phosphorylation at Y402. A, Time course of GluA1 S845 dephosphorylation after chem-LTD treatment in cultured hippocampal neurons. In this and all other experiments in this study, quantified phospho-protein signal in each lane was normalized to total protein signal, and the final ratio was normalized to untreated (0′) control. Data are quantified in the graph at right. n = 3; ***p < 0.001 compared with untreated control, one-way ANOVA with Dunnett's post hoc test. B, Time course of PYK2 Y402 phosphorylation after chem-LTD treatment. n = 3; *p < 0.05 compared with untreated control, one-way ANOVA with Dunnett's post hoc test.
- Figure 2.
Knockdown of PYK2 blocks LTD. A, B, PYK2 shRNA blocks LTD (A), but luciferase shRNA does not (B). Groups of four consecutive EPSC measurements were averaged, and then normalized to the average EPSC magnitude of the first 10 min of baseline recordings (pre-LTD induction). Statistical significance was assessed by comparing the average normalized EPSC of the last 10 min of recording. PYK2 shRNA: n = 12 pairs; p = 0.031, paired Student's t test. Luciferase shRNA: n = 12 pairs; p = 0.56, paired Student's t test. Insets show averaged EPSC traces from sample transfected and untransfected (untrans) cells (thick traces from position 1; thin traces from position 2). Calibration: 50 pA/25 ms. C, D, Neither PYK2 shRNA (C) nor luciferase shRNA (D) affected LTP. Groups of six consecutive EPSC measurements were averaged, and then normalized to the average EPSC magnitude of the first 3 min of baseline recording (pre-LTP induction); the average normalized EPSC of the last 10 min of recording was used to assess statistical significance. PYK2 shRNA: n = 9 pairs; p = 0.48, paired Student's t test. Calibration: 30 pA/25 ms. Luciferase shRNA: n = 7 pairs; p = 0.64, paired Student's t test. Calibration: 50 pA/25 ms. E, PYK2 shRNA and luciferase shRNA do not significantly alter baseline AMPAR transmission. Each data point represents the average EPSC amplitude of 60 consecutive synaptic responses; EPSC amplitude is shown in picoamperes. PYK2 shRNA paired recordings (transfected cell vs untransfected neighboring cell in the same slice): n = 12 pairs; p = 0.55 versus untransfected control, paired Student's t test. Luciferase shRNA paired recordings: n = 19 pairs; p = 0.50 versus untransfected control, paired Student's t test. Insets show averaged EPSC traces from a sample pair of transfected (trans) and neighboring untransfected (untrans) cells. Calibration: 20 pA/100 ms. F, PYK2 shRNA and luciferase shRNA have similar effects on NMDAR transmission. Each data point represents the average NMDAR EPSC amplitude of 60 consecutive synaptic responses; EPSC amplitude is shown in picoamperes. PYK2 shRNA paired recordings: n = 9 pairs, p = 0.024 versus untransfected control, paired Student's t test. Luciferase shRNA paired recordings: n = 18 pairs, p = 0.015 versus untransfected control, paired Student's t test. Calibration: 50 pA/100 ms.
- Figure 3.
PYK2 Y402 is required for LTD. A, Overexpression of Y402F-PYK2 blocks LTD. n = 10 pairs; p = 0.0057, paired Student's t test. Calibration: 50 pA/25 ms. B, WT-PYK2 overexpression does not affect LTD. n = 9 pairs; p = 0.43, paired Student's t test. Calibration: 50 pA/25 ms. C, Overexpression of WT-PYK2 inhibits AMPAR transmission, whereas expression of Y402F-PYK2 does not. EPSC amplitude is shown in picoamperes. WT-PYK2 paired recordings: n = 11 pairs; p = 0.049 versus untransfected control, paired Student's t test. Y402F-PYK2 paired recordings: n = 11 pairs; p = 0.45 versus untransfected control, paired Student's t test. Calibration: 20 pA/100 ms. D, Neither WT-PYK2 nor Y402F-PYK2 expression affects NMDAR transmission. EPSC amplitude is shown in picoamperes. WT-PYK2 paired recordings: n = 11 pairs; p = 0.52 versus untransfected control, paired Student's t test. Y402F-PYK2 paired recordings: n = 11 pairs; p = 0.83 versus untransfected control, paired Student's t test. Calibration: 50 pA/100 ms.
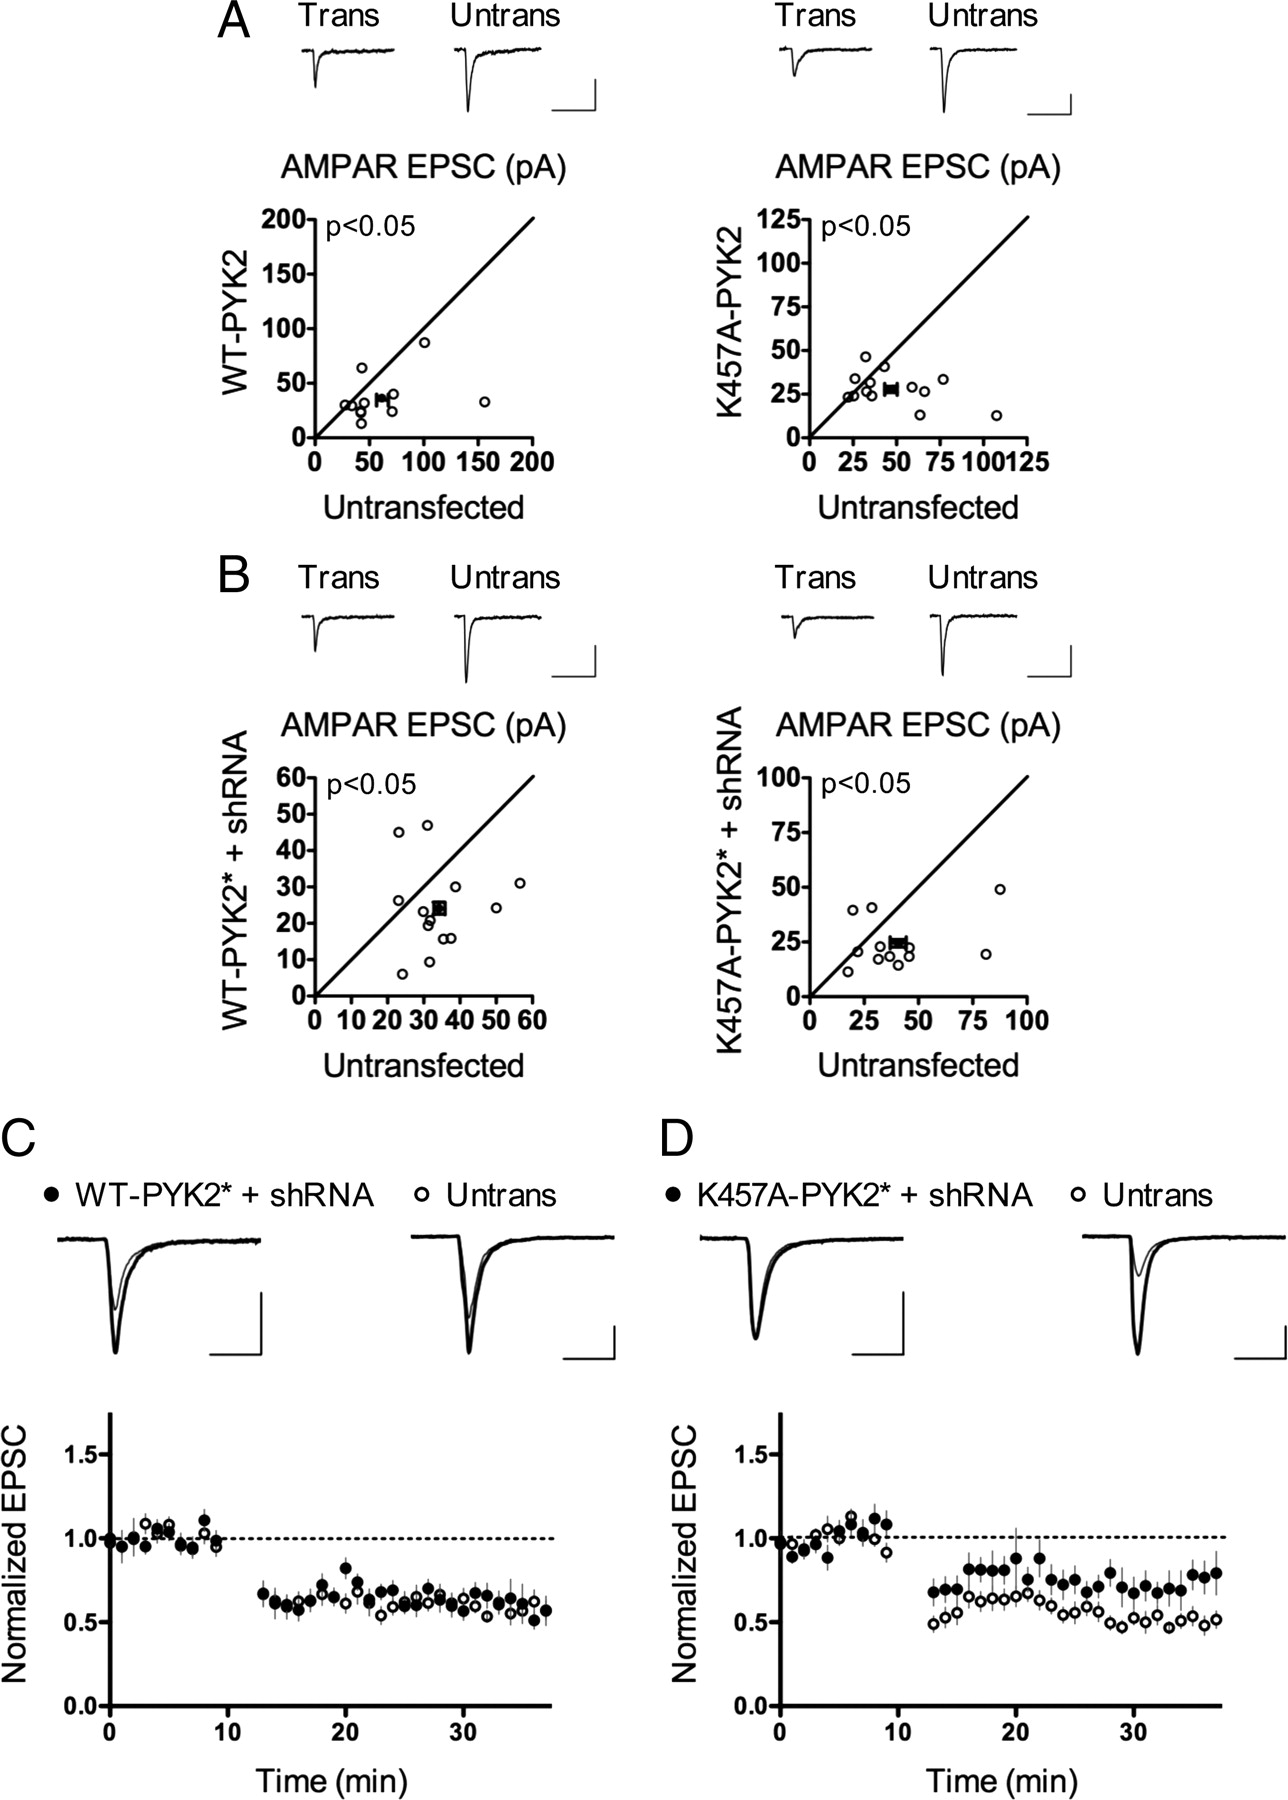
- Figure 4.
PYK2 kinase activity is required for LTD. A, Overexpression of K457A-PYK2 inhibits AMPAR transmission. WT-PYK2 overexpression data from Figure 3C is repeated here for comparison. EPSC amplitude is shown in picoamperes. K457A PYK2 paired recordings: n = 13 pairs; p = 0.036 versus untransfected control, paired Student's t test. Calibration: 20 pA/100 ms. B, Both WT-PYK2* and K457A-PYK2*, in the presence of PYK2 shRNA, depress baseline AMPAR transmission. EPSC amplitude is shown in picoamperes. PYK2 shRNA and shRNA-resistant PYK2 constructs were mixed 1:1 for transfections. WT-PYK2* + shRNA paired recordings: n = 13 pairs; p = 0.036 versus untransfected control, paired Student's t test. K457A-PYK2* + shRNA paired recordings: n = 12 pairs; p = 0.026 versus untransfected control, paired Student's t test. Calibration: 20 pA/100 ms. C, D, WT-PYK2* fully restores LTD (C), whereas K457A-PYK2* only partially rescues LTD (D), in the presence of PYK2 shRNA. WT-PYK2* + shRNA: n = 10 pairs; p = 0.91, paired Student's t test. K457A-PYK2* + shRNA: n = 11 pairs; p = 0.031, paired Student's t test. Calibration: 50 pA/25 ms.
- Figure 5.
PYK2 knockdown enhances NMDA-dependent ERK phosphorylation and delays NMDA-dependent GluA1 S845 dephosphorylation. A, Representative blots of phosphorylation time course of PYK2 and ERK after chem-LTD. The graph at right shows quantification of the phospho-ERK signal intensity ratio (average of phospho-p42 and phospho-p44 intensity ratios, normalized to untreated luciferase shRNA-transfected samples). n = 4; **p < 0.01, two-way ANOVA with Bonferroni's post hoc test between time-matched samples. B, Representative blot of GluA1 S845 dephosphorylation after chem-LTD in luciferase shRNA- and PYK2 shRNA-expressing neurons. Quantification of phospho-GluA1 signal intensity ratios (normalized to the corresponding untreated samples) is shown on the right. n = 4; *p < 0.05, **p < 0.01, ***p < 0.001, one-way ANOVA with Dunnett's post hoc test. C, Representative blot and quantification of phospho-GluA1 from neurons treated with the calcineurin inhibitor FK506 (1 μm) or vehicle (DMSO). n = 6; *p < 0.05, ***p < 0.001, one-way ANOVA with Dunnett's post hoc test. D, Representative blot and quantification of phospho-GluA1 from neurons treated with the calcineurin inhibitor cyclosporine A (1 μm) or vehicle (DMSO). n = 5; *p < 0.05, ***p < 0.001, one-way ANOVA with Dunnett's post hoc test.
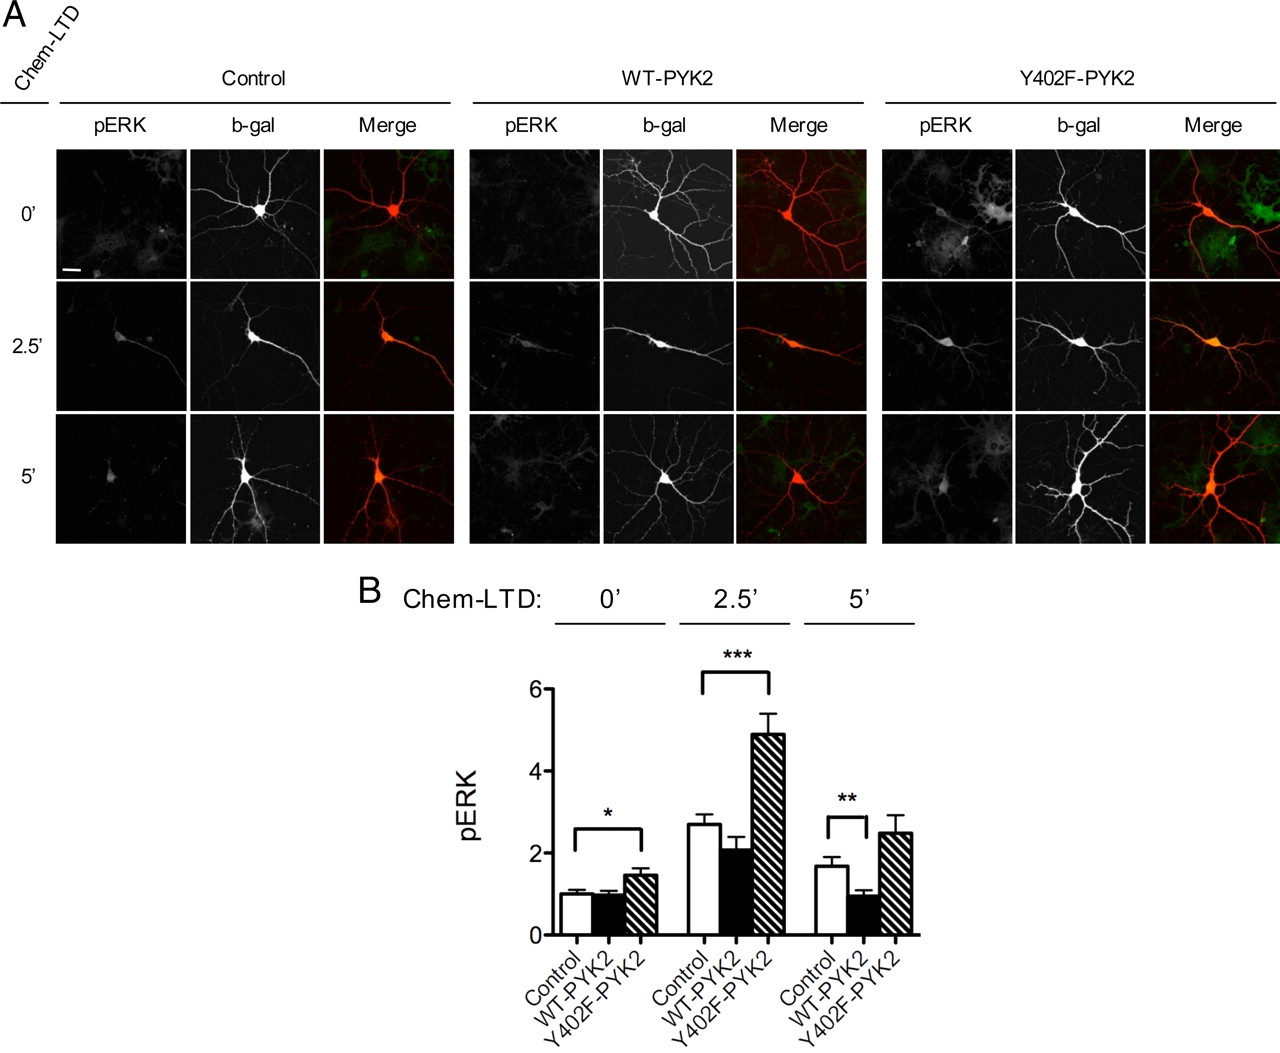
- Figure 6.
WT-PYK2 overexpression depresses NMDA-dependent ERK phosphorylation. A, Representative images of transfected neurons (DIV 16 + 3) immunostained for phospho-ERK (green) and β-galactosidase marker (red) untreated (0′) or after chem-LTD treatment (2.5′ and 5′). Scale bar, 30 μm. B, Quantification of data from A. Average fluorescence intensities of phospho-ERK signal in cell somas all were normalized to untreated empty vector control. Each experimental group was compared with the corresponding empty vector control for that time point. n = 26–53 neurons per group; *p < 0.05, **p < 0.01, ***p < 0.001, unpaired Student's t test.
- Figure 7.
WT-PYK2 overexpression inhibits LTP. A, B, Overexpression of WT-PYK2 (A), but not Y402F-PYK2 (B), reduces LTP. WT-PYK2: n = 8 pairs; p = 0.011, paired Student's t test. Calibration: 20 pA/25 ms (WT-PYK2), 50 pA/25 ms (untransfected). Y402F-PYK2: n = 7 pairs; p = 0.64, paired Student's t test. Calibration: 20 pA/25 ms (Y402F-PYK2), 30 pA/25 ms (untransfected).


Additional Files
Supplemental Material
Files in this Data Supplement:
- supplemental material - Supplemental Figures


