
Abstract
Color has become a premier model system for understanding how information is processed by neural circuits, and for investigating the relationships among genes, neural circuits, and perception. Both the physical stimulus for color and the perceptual output experienced as color are quite well characterized, but the neural mechanisms that underlie the transformation from stimulus to perception are incompletely understood. The past several years have seen important scientific and technical advances that are changing our understanding of these mechanisms. Here, and in the accompanying minisymposium, we review the latest findings and hypotheses regarding color computations in the retina, primary visual cortex, and higher-order visual areas, focusing on non-human primates, a model of human color vision.
In trichromatic primates, including humans and Old World monkeys, there are three types of cone photoreceptors that are responsible for color vision (Fig. 1A,B). The cone classes are called L, M, and S because of their spectral-sensitivity peaks, which lie in the long-, middle-, and short-wavelength regions of the visible spectrum. These labels replace the misleading terms “red,” “green,” and “blue.” Two physically distinct stimuli appear as different colors only if they produce different relative activations in at least two cone types; conversely, any pair of physically distinct stimuli that activate the cone types in the same relative amount appear the same, like the two yellows shown in Figure 1C. While photoreceptor responses are easily computed from the spectral distribution of the stimulus, there is no straightforward relationship between photoreceptor response and color (Hofer et al., 2005a; Shevell and Kingdom, 2008). The multitude of color phenomena, including color afterimages, color assimilation, neon-color spreading, color constancy, and colored shadows, is compelling because in many cases two physically identical stimuli are made to appear different colors, or two physically different stimuli are made to appear the same simply by changing the spatial or temporal context (Fig. 2). A full description of the neural machinery for color should account for these observations, as well as more cognitive phenomena involving the relationship between experience, language, memory, emotion and color. The neural basis of color has been reviewed previously from a range of perspectives (Gegenfurtner, 2003; Gegenfurtner and Kiper, 2003; Lennie and Movshon, 2005; Sincich and Horton, 2005; Solomon and Lennie, 2007; Conway, 2009; Dobkins, 2009; Jacobs and Nathans, 2009; Stockman and Brainard, 2010). Here we focus on advances and pressing questions regarding the mechanisms of color in retina, striate cortex, and extrastriate cortex of non-human primates, although we note that other species are emerging as excellent model systems of color processing (Lotto and Chittka, 2005; Van Hooser and Nelson, 2006; Osorio and Vorobyev, 2008; Borst, 2009; Johnson et al., 2010; Srinivasan, 2010).

First stages of color. A, Spectral sensitivity functions of the three cone types in trichromatic primates (adapted with permission from Stockman and Brainard, 2010). B, False-colored representation of the cone mosaic of a macaque monkey (scale bar, 0.2°); adapted from Roorda et al. (2001). C, Rainbow showing monochromatic yellow (left) and additive color mixing of lights showing mixed yellow (right).

Spatial color contrast changes color appearance. The patches indicated by the asterisk are all physically identical. Image courtesy of Beau Lotto (University College London, London, UK).
Retinal mechanisms
A single cone by itself is color blind because its activation depends on both the wavelength(s) and intensity of the stimulus. A comparison of the signals from different classes of photoreceptors is therefore the most basic computational requirement of a color-vision system. The existence of cone-opponent retinal ganglion cells that perform such comparisons is well established in primate (Dacey and Packer, 2003; Jacobs, 2008). Cone-opponent retinal ganglion cells respond with increased firing to an increment in activation of one cone type (on-response) and to a decrement in activation of a different cone type (off-response) (De Monasterio et al., 1975; Dacey and Lee, 1994). Cone-opponent retinal ganglion cells come in four varieties: L-on/M-off, M-on/L-off, S-on/(L+M)-off, and (L+M)-on/S-off, although the receptive fields of ON cells often have markedly different sizes and temporal dynamics compared with OFF cells, especially for cells receiving strong S-cone input (Chichilnisky and Kalmar, 2002; Chatterjee and Callaway, 2003; Conway and Livingstone, 2006; Tailby et al., 2008; Field et al., 2010). The four varieties of retinal ganglion cells were originally thought to underlie the psychological finding of four unique hues (red, green, blue, and yellow) that are yoked by perceptual antagonism (red is exclusive of green; blue is exclusive of yellow). But this simple relationship of retina physiology to psychology turns out not to be true (Derrington et al., 1984; Valberg, 2001; Webster, 2009); still, cone-opponent cells are often referred to by color terms. The neural basis for the unique hues remains elusive, although responses in extrastriate cortex may provide some clues (see last section). Two major open questions regarding retinal color processing are the nature and diversity of the neural circuitry that produces cone-opponent responses and the relationship between retinal physiology and color perception.
L-M opponent cell types and circuitry
Morphologically defined ON and OFF midget cells project to the parvocellular layers of the lateral geniculate nucleus (LGN)—the LGN is the thalamic nucleus that connects retina and visual cortex. Both midget and parvocellular cells show L versus M cone-opponent responses that result from spatially opponent center-surround receptive fields (Fig. 3A). It has been difficult to determine whether midget cell centers and/or surrounds selectively or randomly sample from L and M cones (Martin et al., 2001; Diller et al., 2004; Buzás et al., 2006; Jusuf et al., 2006; Field et al., 2010). At one extreme, the center and surround could exclusively sample different cone types (e.g., the center samples only M cones, and the surround samples only L cones) (Wiesel and Hubel, 1966; Reid and Shapley, 2002). At the other extreme, L and M cones could be randomly sampled by center and surround, with cone-opponent responses occurring in some cells by chance (Lennie et al., 1991; Billock, 1996).

Diagrams of various model receptive fields. Top view (left), side view (right). See sections “L–M opponent cell types and circuitry” and “How are the cone cells transformed by V1?” for details.
Near the fovea, midget cell receptive-field centers selectively sample from a single cone type for a trivial reason: they are fed by a single cone (Kolb and Marshak, 2003). But even foveal midget cells might have centers that are impure because gap junctions could mix signals between L and M cones (Hornstein et al., 2004). The degree of cone selectivity of midget cell surrounds near the fovea is also unclear. While physiological studies have suggested at least some selective cone sampling (Reid and Shapley, 2002; Buzás et al., 2006), anatomical studies have found little evidence for cone-selective circuitry (Wässle et al., 2000; Dacey and Packer, 2003). Questions remain about selectivity of the surround because stimulating the surround in isolation of the center is difficult and the relative contribution to the surround from horizontal cells versus amacrine cells remains unclear (Mangel, 1991; Cook and McReynolds, 1998; Ichinose and Lukasiewicz, 2005; Davenport et al., 2008).
In the peripheral retina, where both the center and surround of midget cells sample from multiple cones, the cone purity has been similarly controversial (Martin et al., 2001; Jusuf et al., 2006). A recent study using receptive-field mapping at the resolution of single cones found small but consistent deviations from random toward selective sampling in the receptive-field center, but not in the surround (Field et al., 2010). The mechanism and anatomical basis for this selectivity is uncertain. One might wonder whether spatial clumping of L and M cones by type could contribute (Roorda et al., 2001; Hofer et al., 2005b) (Fig. 1B), but recent evidence suggests the contribution of cone clumping is minor (Field et al., 2010).
Do midget cells form the basic building blocks for the “red-green” color-vision circuit? Many investigators assume so, although the mismatch between the high density of midget cells and the relatively low spatial acuity for color has raised some doubts (Hubel and Livingstone, 1990; Calkins and Sterling, 1999). Parasol cells can show L-M cone-opponent responses (Derrington et al., 1984; Lee and Sun, 2009), so they could play some role in color vision, though this is controversial. Additionally, one of the many morphologically defined ”wide-field” retinal ganglion cells with low density may encode L-M opponent responses that contribute to color vision (Dacey and Packer, 2003); these cells may correspond to the still elusive red-green type II cells alluded to by Wiesel and Hubel (1966) in their recordings of neurons located in the intercalated, or koniocellular (“K”), layers that separate the main layers of the LGN (Fig. 3B).
S versus L+M opponent cell types and circuitry
There are several types of retinal ganglion cells that oppose S signals against L+M. The small bistratified cell was the first morphologically identified “blue-yellow” cell (Dacey and Lee, 1994; Dacey and Packer, 2003), but there are others: the large bistratified and giant monostratified cells (Dacey et al., 2003, 2005). These cell types project to the koniocellular layers of the LGN (Szmajda et al., 2008; Roy et al., 2009). In addition, OFF (but not ON) midget cells in the central and peripheral retina also appear to carry S cone signals to the brain (Klug et al., 2003; Field et al., 2010; but see Lee et al., 2005; Sun et al., 2006). Unfortunately, the role of S versus L+M opponent retinal ganglion cells in blue-yellow color vision is all but clear (Derrington et al., 1984).
The circuitry producing cone-opponent responses in small bistratified cells differs from that of midget cells (Dacey and Lee, 1994; Crook et al., 2009). Small bistratified cells have dendrites in two distinct strata of the inner plexiform layer. The inner dendrites receive input from ON-type bipolar cells that synapse exclusively with S cones. The outer dendrites receive input from off-type bipolar cells (Calkins et al., 1998; Grünert and Ghosh, 1999; Percival et al., 2009) that carry L and M cone signals. In far peripheral retina and/or under low photopic conditions, the H2 horizontal cell may also contribute to the (L+M)-off response (Field et al., 2007; Packer et al., 2010). Large bistratified cells probably have a circuitry similar to that of small bistratified cells (Dacey et al., 2003), and the circuitry of giant monostratified cells is yet to be determined.
Our understanding of the retinal mechanisms of color is far from complete. The response properties of all ∼20 retinal ganglion cell types need to be characterized to identify those with cone-opponent responses. Also, the roles of excitation and inhibition in the inner and outer synaptic layers need to be clarified to understand how retinal circuitry produces cone opponency. Finally, more studies are needed that quantitatively probe the relationship between retinal signals and color perception (Derrington et al., 1984; Kremers et al., 1992).
Retinal gene therapy
Unlike Old World monkeys, most mammals are dichromats. New World monkeys, such as squirrel monkeys, have color vision that is an evolutionary intermediate between dichromats and trichromats (Jacobs, 2008). Instead of having L and M cone opsin genes, like humans and Old World monkeys, each New World monkey has only a single X-chromosome opsin locus containing one of multiple alleles (Neitz et al., 1991). Males have only one X-chromosome, so all New World male monkeys are dichromats. Heterozygous females who inherit different M/L alleles on each X-chromosome express the pigments in different cone populations due to random X-inactivation, producing trichromacy in two thirds of females. Normal dichromatic and normal trichromatic color vision coexist in these species, and the brain circuitry for both is specified by the same genetic instructions. The ancestors to humans and other Old World primates must have passed through an evolutionary stage in which the distribution of dichromats and trichromats was similar to the New World primates. Thus a single set of genetic instructions serves both dichromacy and trichromacy, raising the possibility that no additional changes were required besides the addition of a third cone opsin. This would account for the observation that transgenic mice, engineered to express three cone pigments, can show behavioral trichromacy (Jacobs et al., 2007).
But does the red-green color-vision circuit require early visual experience to become functional? This question was addressed using gene therapy to add a third photopigment to the retinas of adult dichromatic squirrel monkeys (Mancuso et al., 2009). Remarkably, this simple intervention was sufficient to confer trichromatic color vision (Fig. 4). Because new color vision behavior corresponded in time to the appearance of robust transgene expression levels, it seems that significant “rewiring” in the adult is not required. This result suggests that red-green color vision can be added by taking advantage of preexisting neural circuitry (Mancuso et al., 2009; Shapley, 2009), that an early developmental process is not required, and that trichromacy could have evolved in the absence of any other change in the visual system except the addition of a third cone type (Mancuso et al., 2010a).
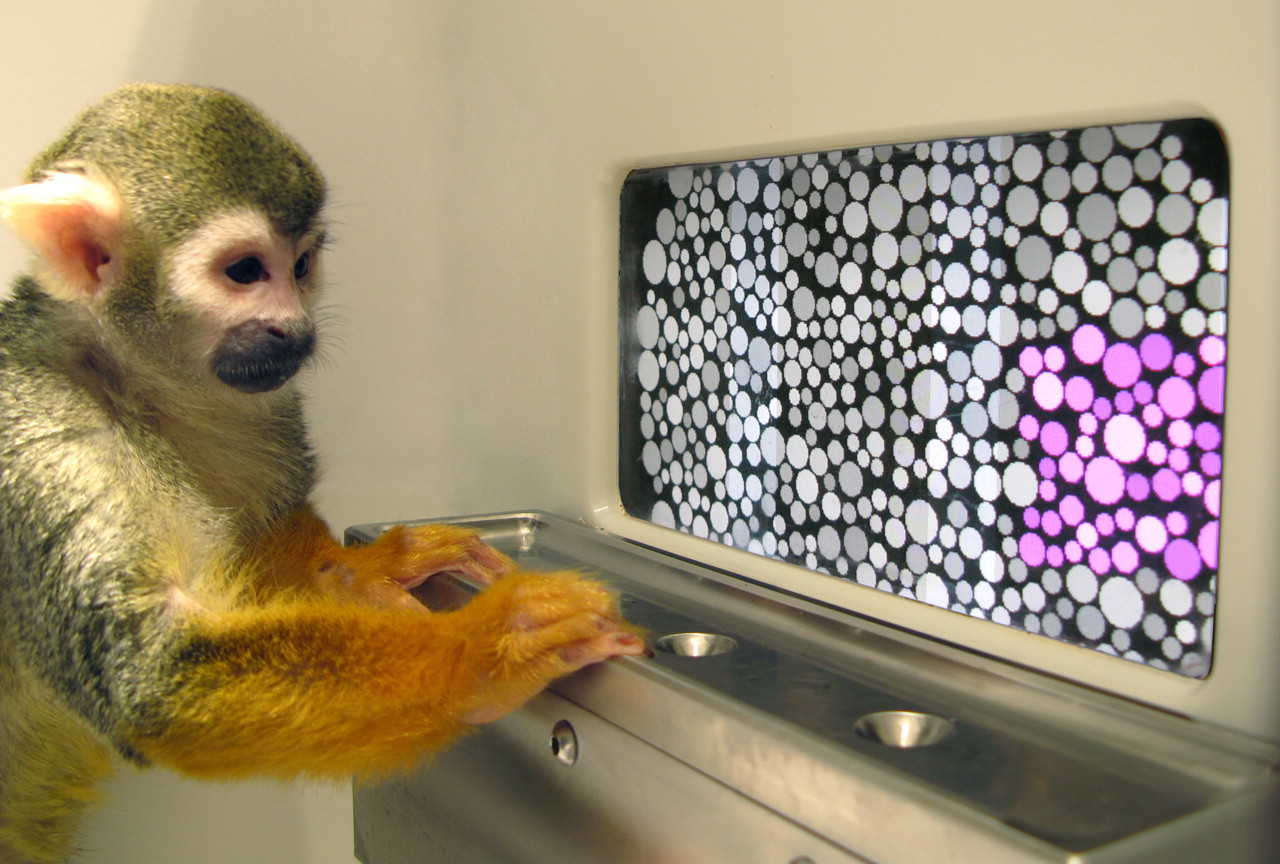
Squirrel monkey performing a trichromatic color discrimination following gene therapy. Image courtesy of the Neitz laboratory.
The treated animals made all the usual discriminations made by animals born with the genetic potential for trichromacy. They discriminate reds from greens, and these colors from gray; and they do not confuse blue and yellow with either red or green (Mancuso et al., 2010b). Thus, while the treated animals' internal experiences associated with stimulation of their new cone type remain unknown, it is clear that reds, greens, blues, and yellows are recognized as distinct sensations. This discovery opens interesting questions concerning the role of development and experience in sculpting circuitry that mediates perception, including properties of the visual system that enable a new capacity to be added after traditional critical periods have ended.
Striate cortex mechanisms
The cortical area that receives the largest projection from the LGN is primary visual cortex, also called V1 or striate cortex. Three outstanding questions continue to drive research into color processing in V1: Which neurons code color? How are the cone signals transformed by V1? And, is there a functional architecture for color in V1?
Which V1 cells code color?
Early investigations found that many V1 neurons are tuned for the orientation and spatial frequency of black-and-white patterns (Fig. 3C), with few strongly selective for color (Hubel and Wiesel, 1968; Schiller et al., 1976). The smaller population of strongly color-selective neurons, studied using broadband (white) light passed through colored filters, could be classified like LGN cells in red/green or blue/yellow categories (Dow and Gouras, 1973; Gouras, 1974; Michael, 1978; Livingstone and Hubel, 1984; Vautin and Dow, 1985; Ts'o and Gilbert, 1988). These observations motivated the influential idea that color is processed by a specialized subsystem that can be traced from retina to V1 (Livingstone and Hubel, 1984).
But could the observation of distinct neuronal “types” (red/green and blue/yellow; color-coding and non-color-coding) in these early studies be an artifact of the small set of stimuli used? Neurons that responded similarly to the colors tested might have been distinguished if tested with an alternate set, or a larger battery of colors. In subsequent experiments, cathode ray tube monitors made it easy to present millions of colors, although only a small subset of these could be included in an experiment of realistic duration. Investigators needed a way to summarize color tuning succinctly and in a way that did not make assumptions about the number and types of chromatically distinct subpopulations present.
An important step was made by Derrington et al. (1984), who found that the response of an LGN neuron to any stimulus could be predicted from a weighted sum of activity modulations in the three cone types. This critical finding—that the LGN responses are “linear”—meant that color tuning could be described concisely with a set of three numbers, which are the weights applied to input from the three cone classes. On the basis of these cone weights, each LGN neuron could be assigned unambiguously to one of three clusters, providing justification for the classification originally described by De Valois et al. (1966).
The cone weights of V1 neurons, however, appear to form a continuum (Lennie et al., 1990; De Valois et al., 2000; Johnson et al., 2004; Solomon et al., 2004; Solomon and Lennie, 2005; Horwitz et al., 2007). Chromatic signals from the LGN thus appear to be mixed in V1 in myriad, perhaps arbitrary ways. But the analysis of V1 cone weights is problematic in two key respects. First, cone weights do not indicate the degree to which a neuron is color selective; it remains possible that only the most color-selective neurons relay color signals in V1 (Conway, 2001; Johnson et al., 2001; Wachtler et al., 2003; Horwitz et al., 2007). Second, the concept of a “cone weight” is only meaningful if the response of a V1 neuron can be adequately described as a weighted sum of cone inputs. This assumption has come under scrutiny. Hanazawa et al. (2000) described V1 neurons whose color tuning was too sharp to result from a linear combination of cone signals. Solomon et al. (2005) found that a divisive signal from the cones contributed significantly to the responses of some V1 neurons, and Horwitz et al. (2005) found that the responses of some cone-opponent V1 neurons were facilitated by luminance signals, which indicates a violation of linearity.
There is now consensus that many V1 neurons do not combine cone signals linearly, so we should not be surprised that analyses of cone weights give results that are difficult to interpret. We are now forced to reevaluate the original questions: which cells in V1 code color, and might there be a specialized pathway for color processing in V1? Much of the evidence against this idea was based on the fit of a model that describes the color tuning of V1 neurons incompletely (Hanazawa et al., 2000; Solomon and Lennie, 2005; Horwitz et al., 2007). An important future direction is to revisit this question in a way that that makes fewer assumptions about how V1 neurons combine cone inputs.
How are the cone signals transformed by V1?
Color contrast makes red appear redder when surrounded by green, while color constancy enables an object's color to remain largely constant as the illuminant changes (see Fig. 2). A flurry of attention has been paid to mechanisms in V1 that may be responsible for these, and other, color–form interactions (Zhou et al., 2000; Gegenfurtner, 2001; Shapley and Hawken, 2002; Friedman et al., 2003; Hurlbert, 2003, 2007; Kiper, 2003; Wachtler et al., 2003). This work has both reinvigorated and challenged the idea that color, or some aspect of it, may be handled by a specialized pathway.
The early discoveries of Hubel and Wiesel (1968) left a paradox: if “form” is encoded by a discrete population of color-blind neurons, and “color” information by a separate population of form-blind neurons, how does the brain encode color–form interactions required to account for color contrast and color constancy? Single-opponent cells (Fig. 3A) would be incapable of color–contrast calculations because they are not spatially selective for color: an “L-ON/M-OFF” single-opponent cell responds well to spots, bars, or a full field of red, but not to a red spot on a green background. One possible mechanism for encoding color–form interactions is through specialized “double-opponent” cells (Fig. 3D), first described in goldfish retina (Daw, 1967). Pressing questions have centered on the existence, characterization, and wiring of such cells in primate V1.
To carry information expressly about color boundaries, it was hypothesized that double-opponent cells in V1 would have perfectly balanced cone inputs and concentrically organized centers and surrounds (Michael, 1978; Livingstone and Hubel, 1984). Such a cell would respond to a red spot on a green background, and not to luminance spots of any size. The concentric organization of their receptive fields would also mean that they would be spatially tuned, but not orientation selective. Double-opponent neurons fitting this description were reported in a few early studies (Hubel and Wiesel, 1968; Michael, 1978; Livingstone and Hubel, 1984), but other studies with large samples of V1 cells found little evidence of them (Thorell et al., 1984; Lennie et al., 1990).
New neurophysiological evidence shows that there is a significant population of double-opponent cells in V1, although these cells do not have all the originally hypothesized receptive-field properties. The inputs to these cells are spatially segregated by cone type into excitatory and inhibitory receptive-field subunits (Conway, 2001; Johnson et al., 2001, 2004, 2008; Conway et al., 2002; Conway and Livingstone, 2006), verifying that these neurons are both color-opponent and spatially opponent, but the cells frequently lack a concentric center–surround organization. Many double-opponent cells also respond to both color and luminance (Thorell et al., 1984; Conway, 2001; Johnson et al., 2001, 2004, 2008; Conway and Livingstone, 2006; Horwitz et al., 2007).
A growing body of evidence shows that many double-opponent neurons are orientation-selective for both color and achromatic patterns, regardless of the constitution of cone input (Thorell et al., 1984; Conway, 2001; Johnson et al., 2001, 2008, 2010; Conway et al., 2002; Heimel et al., 2005; Conway and Livingstone, 2006; Horwitz et al., 2007). This transformation means that these cells respond to cues for form, such as boundaries and edges, and may take signals from color or black and white as needed. Neurophysiological evidence that V1 neurons can be both color-selective and orientation-selective is consistent with recent functional magnetic resonance imaging (fMRI) and psychophysical studies in humans showing orientation-selective responses to color stimuli (Beaudot and Mullen, 2005, 2006; Engel, 2005; Huang et al., 2007; Sumner et al., 2008). The differences from the originally proposed double-opponent cell necessitate a revision of the model (Fig. 3E).
Color likely depends on both single-opponent and double-opponent neurons, and on the further processing of their signals (Vladusich, 2007). Single-opponent cells would seem ideal for signaling the color of a region covering the receptive field, while double-opponent cells would be capable of signaling color contrast, color boundaries and edges, and contributing to color constancy. Future directions will involve developing rigorous methods to test these predictions, building physiologically relevant computational models, and establishing the extent to which these populations of neurons represent a distinct specialized pathway.
Is there a functional organization for color in V1?
Columns of cells with similar orientation tuning extend down through the vertical thickness of V1, and the orientation tuning of adjacent columns shifts gradually across the horizontal surface (Hubel and Wiesel, 1977), an architecture that has become more precisely understood as technology has advanced (Blasdel and Salama, 1986; Grinvald et al., 1986; Ohki et al., 2006). Pinning down the functional organization of color in V1 has been more challenging. The laminar projection of color-opponent signals from LGN to V1 seems clear: L-M signals target the middle input layer (4Cβ), S-(L+M) (“Blue ON”) signals target the upper input layers (2/3 and 4A), and (L+M)-S (“Blue OFF”) signals are narrowly stratified in 4A (Lachica and Casagrande, 1992; Martin et al., 1997; Hendry and Reid, 2000; Chatterjee and Callaway, 2003; Casagrande et al., 2007). But there is no consensus on the horizontal organization of chromatic signals within V1. Livingstone and Hubel (1984) showed that color cells tend to coincide with regions, called blobs, that stain for the enzyme cytochrome oxidase (Fig. 5A); this view was extended by Ts'o and Gilbert (1988), who suggested that some blobs were entirely red/green and others entirely blue/yellow (Fig. 5B). But subsequent electrophysiological studies (Lennie et al., 1990; Leventhal et al., 1995; Friedman et al., 2003) called this architecture into question, suggesting no obvious clustering of color and no functional architecture related to blobs (Fig. 5C).

Alternative models for the organization of color-tuned neurons in V1. The gray patches depict cytochrome-oxidase blobs. Dots show color-tuned neurons that are clustered in blobs, but mixed randomly within each blob (A); clustered in blobs, and segregated according to color tuning within pure-color blobs (B); randomly arranged with respect to blobs (C); and clustered within blobs and according to a micromap in which cells of similar tuning are adjacent within a given blob (D).
These contradictory results may not be surprising given the sampling limitations of extracellular recording and the challenge of aligning physiological recording sites with postmortem histochemical analysis. Intrinsic signal imaging, with its bird's-eye view of the cortical surface, rekindled the notion of color maps organized according to blobs. Landisman and Ts'o (2002) concluded that color-responsive regions are loosely associated with blobs, and that these regions are joined by color “bridges” spanning adjacent blobs. Using a similar approach, Lu and Roe (2008) concluded that there is a tighter association between color-responsive regions and blobs. Finally, a recent optical-imaging study, which unfortunately did not provide histology, concluded that color is functionally organized as an array of hue maps, with each map containing a representation for multiple colors at overlapping but slightly different spatial locations (Xiao et al., 2007). The low resolution of intrinsic optical imaging, however, makes it impossible to determine how the signals map onto individual cells within neuronal ensembles.
The question of color architecture has been approached using two-photon calcium imaging, which enables the activity of thousands of individual cells to be measured simultaneously. Preliminary results suggest that cone-opponent cells form clusters, and that these clusters are in register with blobs (Chatterjee et al., 2008). The clusters appear to extend through upper layer 2/3, forming columns of chromatic selectivity. Moreover, these color columns appear to be subdivided into regions of different chromatic signatures, suggesting a “micromap” model (Fig. 5D) that helps to explain discrepancies in previous observations of color architecture. These two-photon imaging results reveal a precise functional architecture for color and support the notion that V1 color signals are processed by an anatomically segregated pathway, which may provide the basis for a segregated output to extrastriate areas of the ventral stream.
Two-photon imaging allows the responses of hundreds of neurons to be measured simultaneously; but, as discussed in the previous sections, V1 neurons show variety in spatial and temporal receptive-field organization, and many do not combine cone signals linearly. In the face of this heterogeneity, it is not trivial to determine stimulus parameters that would be suitable to adequately assess color tuning using two-photon imaging. It will be important, in future work, to establish whether two-photon imaging can provide an accurate measure of color tuning, perhaps by directly comparing measurements with those obtained using single-unit recording.
Extrastriate cortex mechanisms
One heuristic of color processing (Fig. 6) holds that color signals are transmitted along the ventral visual stream, from V1 through subcompartments of V2 referred to as the thin stripes (because of their pattern of staining with cytochrome oxidase), on to islands of cortex dubbed “globs” located in V4 and posterior inferior temporal cortex (PIT), and ultimately on to inferior temporal cortex (IT) (Desimone et al., 1985; Komatsu, 1998; Zeki and Marini, 1998; Conway et al., 2007; Matsumora et al., 2008; Harada et al., 2009; Yasuda et al., 2010). This simple hierarchical model suggests that many color computations take place downstream of V1. But compared with our understanding of retina and V1, we know little about how extrastriate cortex contributes to color. Recent work using microelectrodes and fMRI-guided microelectrode recordings has opened up new questions at the interface of neurobiology and behavior (Conway et al., 2007; Koida and Komatsu, 2007; Matsumora et al., 2008; Stoughton and Conway, 2008; Conway and Tsao, 2009).

Simple hierarchical model of color processing in the macaque cerebral cortex. Regions of cortex shown in gray, which increase in scale along the visual-processing hierarchy from V1 to TE, are implicated in color processing. Adapted from Conway (2009).
IT is located in the temporal lobe of the monkey (anterior to the ears), and can be divided into two parts (Iwai and Mishkin, 1969): area TE, which includes anterior and central IT, and area TEO, which includes PIT (Van Essen et al., 1990). The posterior boundary of PIT adjoins area V4, although the boundary is imprecise—indeed the boundaries of all visual areas in the temporal lobe are provisional (Brewer et al., 2002; Fize et al., 2003; Tootell et al., 2004; Stepniewska et al., 2005). Several studies have shown that lesions or cooling of area TE impairs color discrimination (Dean, 1979; Horel, 1994; Heywood et al., 1995; Buckley et al., 1997), whereas lesions of other color-related areas (PIT and V4) cause little disruption in color discrimination (Heywood et al., 1998; Huxlin et al., 2000). In humans, rare lesions of ventral occipital cortex can produce colorblindness, while sparing other visual function (Bouvier and Engel, 2006), but the relationship of these regions, whose activity can be used to decode color (Brouwer and Heeger, 2009), to extrastriate regions in macaque monkey remains controversial (Hadjikhani et al., 1998; Tootell and Hadjikhani, 1998; Zeki et al., 1998). Brain imaging, which has a higher resolution in monkeys than in humans owing to the use of contrast agents and the monkey's smaller head, suggests that color is handled by area TE along with a distributed network of globs within PIT/V4, rather than a single entire extrastriate visual area (Conway and Tsao, 2006; Conway et al., 2007; Harada et al., 2009); this is consistent with anatomical and optical-imaging data (Zeki and Shipp, 1989; DeYoe et al., 1994; Felleman et al., 1997; Ghose and Ts'o, 1997).
Neural recording studies have shown that many neurons in IT respond selectively to color (Zeki, 1980; Desimone et al., 1984; Komatsu et al., 1992; Komatsu and Ideura, 1993; Kobatake and Tanaka, 1994; Koida and Komatsu, 2007; Matsumora et al., 2008). These neurons are narrowly tuned to color and color saturation, and are concentrated in several subregions of IT, one located in TE and another in TEO (Conway et al., 2007; Yasuda et al., 2010). Neurons in TE show relatively weak shape selectivity (Matsumora et al., 2008), while neurons in the more posterior region show stronger shape selectivity (Conway et al., 2007; Yasuda et al., 2010).
The relationship between color perception and neuronal activity of anterior IT has recently been examined by Matsumora et al. (2008), who showed a significant correlation between the trial-to-trial fluctuations in neuronal responses of color-tuned neurons and the monkeys' color judgment. They also found that the variation in neural threshold across the color space corresponded well with that of the behavioral threshold. Electrical stimulation of this region induces a large shift in the monkey's color judgment, suggesting that neural activities are causally related to color judgment (Koida and Komatsu, 2008). Such a causal link is also suggested by recent microstimulation experiments in human subjects (Murphey et al., 2008).
The ability to categorize stimuli by color is a fundamental cognitive process. The population of neurons recorded in fMRI-identified globs of posterior IT shows a bias for the most saturated colors in a stimulus set, which also correspond to the elementary, or “unique” hue categories, suggesting a neural basis for color categories (Stoughton and Conway, 2008; Conway and Stoughton, 2009; Conway and Tsao, 2009; but see Mollon, 2009). Koida and Komatsu (2007) argue that IT neurons are involved in color cognition by showing that IT neurons change firing rate when the monkey switches from a categorization to a discrimination task; moreover, they found that a majority of neurons gave stronger responses when the animals performed a color-categorization task versus when they performed a color-discrimination task. Their results imply that IT neurons play an important role in color categorization.
The color-selective neurons in extrastriate regions along the ventral pathway must play an important role in color processing. With the refinement of physiological recording techniques, coupled with more sophisticated psychophysical stimulus paradigms, the specific computations performed by these neurons, the relationship of their activity to perception, and the neural circuitry that connects these cells to color cells in V1 and retina, should become clear.
Conclusion
Research using color vision as a model system has seen terrific advances, offering the hope of a complete understanding of the transformation of color signals from retina to behavior. The minisymposium that accompanies this review will showcase results that aim to understand this transformation and the circuits that bring it about. During the minisymposium, we will describe results from large retinal array recordings, in which the activity of hundreds of retinal ganglion cells is assessed simultaneously, affording the ability to measure receptive fields of color-opponent cells at the resolution of individual cones. We will go on to describe experiments exploring gene therapy for red-green colorblindness, and the implications of this research for theories of color vision. We will then describe results obtained using two-photon imaging, showing the fine-scale spatial organization of cone-opponent cells in V1. In addition, using single-unit electrophysiological recordings and two-photon imaging, we will address how V1 neurons achieve color tuning. We will also discuss the spatial transformation of color signals in V1 and the degree to which color is processed independently of other stimulus attributes like orientation. Finally, we will turn our attention to extrastriate regions that likely mediate the conscious experience of color, and address potential limits of animal models of human color vision. Using this knowledge, we aim to enrich our understanding of the relationship between genetics, neural circuits, perception, and behavior.
Footnotes
- Received August 18, 2010.
- Revision received September 22, 2010.
- Accepted September 23, 2010.
-
This work was funded by National Science Foundation Grant 0918064, a Whitehall Foundation Award (B.R.C.), and a Radcliffe Institute of Advanced Study Fellowship (B.R.C.); a McKnight Foundation Scholar's Award and National Institutes of Health (NIH)-National Eye Institute (NEI) Grant EY018849 (G.D.H); the Helen Hay Whitney Foundation, NIH Grant EY13150, and NSF Grant PHY-0750525 (G.D.F.), NIH Grants R01EY016861, P30EY01730, and RR00166 (K.M.); Research to Prevent Blindness (K.M.); NIH Grants P30 EY12196 and F32 EY016287 (S.C.); and Japanese Grant-in-Aid for Scientific Research 16300103, Grant for Scientific Research on Priority Areas 17022040, and Japanese MEXT Grant-in-Aid for Young Scientists 20700299 (K.K.).
- Correspondence should be addressed to Bevil R. Conway, Neuroscience Program, Wellesley College, 106 Central Street, Wellesley, MA 02481. bconway{at}wellesley.edu
- Copyright © 2010 the authors 0270-6474/10/3014955-09$15.00/0