

Article Figures & Data
Figures
- Figure 1.
Preexposure causes enhancement of odor avoidance. A, Typical examples of avoidance assay of the naive and the preexposed animals to 600 nl of 2-nonanone. Black dots indicate positions of the end points of animals' avoidance behavior. Positions of the odor source, the original position of animals and lines between the sectors were overlaid. B, Avoidance index of 2-nonanone avoidance after preexposure. The naive animals (“naive”) or animals kept in the absence (“mock”) or presence (“preexp.”) of 30 nl of 2-nonanone in NGM plates without food for 1 h were subjected to the avoidance assay with 600, 200 or 60 nl of 2-nonanone. The avoidance index reflects an average of avoidance distances of the animals from the center line of the plate. Open, gray, and solid bars indicate results of naive, mock-treated and preexposed animals, respectively, and each bar represents the mean ± SEM of 9 independent experiments throughout the figures unless otherwise indicated. C, 1-Octanol avoidance after preexposure. The animals were preexposed to 90 nl of 1-octanol without food for 1 h, and subjected to an avoidance assay with 60 nl of 1-octanol. D, The enhancement of 2-nonanone avoidance is AWB-dependent. Animals were preexposed to 90 nl of 2-nonanone in the absence of food for 1 h and then assayed with 600 nl of 2-nonanone. § indicates statistical difference from the corresponding wild-type index (see Results). E, Preexposure in the presence of food also caused the enhancement of 2-nonanone avoidance. The animals were preexposed to 30 nl of 2-nonanone in the presence of food and assayed with 600 nl of the odor. *p < 0.05, **p < 0.01 and ***p < 0.001 throughout figures.
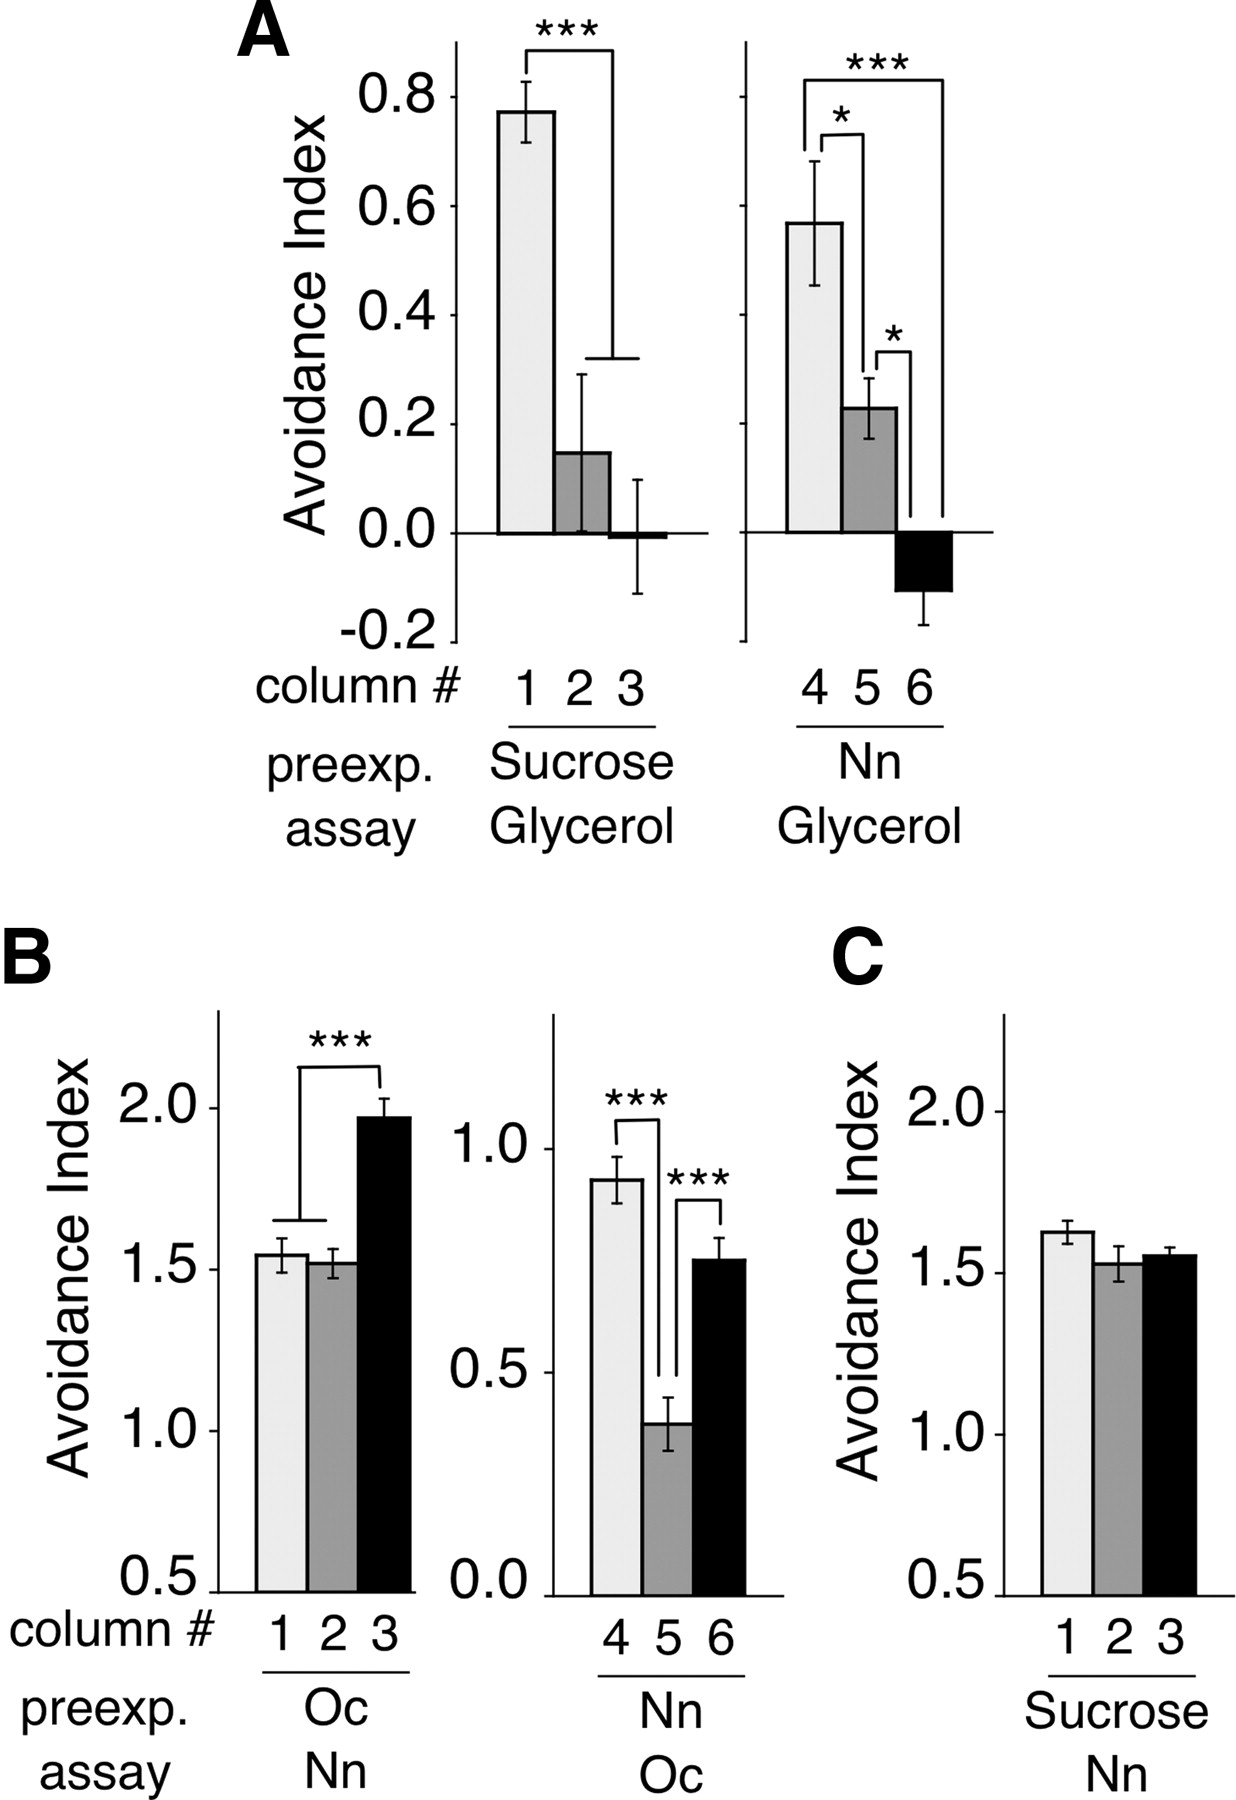
- Figure 2.
Preexposure is effective across different repulsive odors. A, The animals were preexposed to 250 mm sucrose (left) or to 90 nl of 2-nonanone (right) in the absence of food for 1 h and assayed with 100 mm glycerol in quadrant plates for 15 min. Glycerol avoidance was partially suppressed by starvation (lane 2 and 5) and further suppressed by the preexposure to 250 mm sucrose (lane 3) or to 2-nonanone (lane 6). We used sucrose for preexposure (left panel) to confirm that higher osmolarity itself affected the subsequent osmolarity avoidance. Each bar represents the mean ± SEM of 6 independent experiments. B, The animals were preexposed to 90 nl of 1-octanol (Oc) and assayed with 600 nl of 2-nonanone (Nn) (left panel) or preexposed to 30 nl of 2-nonanone and assayed with 60 nl of 1-octanol (right panel). Each bar represents the mean ± SEM of 6 independent experiments. C, The animals were preexposed to 250 mm sucrose and assayed with 600 nl of 2-nonanone. Each bar represents the mean ± SEM of 9 independent experiments.
- Figure 3.
Memory of 2-nonanone preexposure. A, The animals were mock-treated (open circle) or preexposed to 30 nl of 2-nonanone (solid circle) for 0, 5, 15, 30 or 60 min and assayed with 600 nl of 2-nonanone. Each circle represents the mean ± SEM of 6 independent experiments. B, The animals were mock-treated or preexposed to 30 nl of 2-nonanone, and assayed with 600 nl of 2-nonanone immediately after (lanes 1–3) or after a 1 h interval in the absence of food and the odor (lanes 4, 5). Each bar represents the mean ± SEM of 6 independent experiments. C, The animals were preexposed to 90 nl of 2-nonanone for 5 min and then kept in the absence of food and the odor before the assay with 600 nl of 2-nonanone. Each bar represents the mean ± SEM of 6 independent experiments.
- Figure 4.
Run duration is increased by preexposure. A, Time course of changes in animals' average position during 2-nonanone avoidance. Distance of each animal's centroid from the center line of the assay plate (the line between sectors 3 and 4 in Fig. 1A) was averaged for each frame and plotted as a function of time. Twenty-five animals were used for each condition to calculate the mean ± SEM. Gray area indicates the SEM. B, Time course changes of animals' velocity. Velocity regardless of locomotion direction for each frame (2 s) was first averaged for every minutes for each animal, and the average velocities of 25 animals in each condition were used to calculate the mean ± SEM. C, A typical example of a naive animal's track during 12 min of 2-nonanone avoidance. Pirouettes and runs are indicated with black and gray regions, respectively. D, Average durations of pirouette and runs. Durations of pirouettes or runs were first averaged for each animal, and the average duration of 25 animals were used to calculate the mean ± SEM. E, Histogram indicates numbers of naive (top), mock-treated (middle), and 2-nonanone-preexposed (bottom) animals' run duration (25 animals each). The long run (≥ 92 s duration) and the shorter run (18–24 s duration) are indicated by a black arrow and a bracket, respectively.
- Figure 5.
Enhancement of 2-nonanone avoidance is regulated by dopamine signaling. A, Monoamine biosynthetic pathways and the phenotype of mutants in the pathways. The avoidance of naive animals was not analyzed to save time during the series of analyses. Names of the mutants defective in the enhancement of 2-nonanone avoidance are shown in bold black letters, and the one without the defect is shown in gray. B, C, The animals were preexposed to 90 nl of 2-nonanone in the absence (B) or presence (C) of food and then assayed with 600 nl of 2-nonanone. D, Wild-type genomic fragment of a cat-2 gene at 5 ng/μl was introduced into cat-2(tm2261) mutants, and transgenic animals were preexposed to 90 nl of 2-nonanone in the absence of food and assayed with 600 nl of 2-nonanone. Two independent transgenic lines were used for each of cat-2(+) and control genotypes. Each bar represents the mean ± SEM of 12 independent experiments.
- Figure 6.
dop-3, a D2-like dopamine receptor homolog, is required for the enhancement. A, Antagonists for D2-type dopamine receptors suppress the enhancement of 2-nonanone avoidance. The animals were treated with the antagonists 3∼5 h before and during the preexposure to 90 nl of 2-nonanone. SCH 23390 or loxapine were dissolved in dH2O, and haloperidol was dissolved in 1% ascorbic acid; dH2O and 1% ascorbic acid were used as no-drug controls, respectively (lanes 1–3 and 10–12). The animals were then assayed with 600 nl of 2-nonanone. B, The dop-3 gene is responsible for the enhancement of 2-nonanone avoidance. The dopamine receptor mutants were preexposed to 90 nl of 2-nonanone in the absence of food and assayed with 600 nl of 2-nonanone.
- Figure 7.
dop-3 dopamine receptor homolog functions in the RIC interneurons to regulate the enhancement. A, Cell-specific rescue experiments of the enhancement of 2-nonanone avoidance in the dop-3 mutant. A plasmid containing a cell-specific promoter fused to the dop-3 cDNA (5 or 50 ng/μl) was introduced into the dop-3(tm1356) mutant background. The transgenic animals were preexposed to 90 nl of 2-nonanone in the absence of food, and then assayed with 600 nl of 2-nonanone. Avoidance behavior of the wild-type and dop-3 mutant animals containing transgene with the marker and the carrier DNA were also analyzed in parallel as controls. H20p and tbh-1p are the results of transgenic lines with 5 ng/μl of the fusion plasmid and the others are the results with 50 ng/μl. At least two independent transgenic lines were analyzed for each concentration. Some promoters led to higher or lower basal locomotion activity in the transgenic animals than in the control animals (glr-2p and odr-2p for example), probably due to inappropriate expression of the dop-3 cDNA. The reported expression pattern of each promoter (see Materials and Methods) is shown at the bottom. Each bar represents the mean ± SEM of 9 (rescued animals) or 6 (non-rescued animals) independent experiments. B, C, The behavioral defect in the dop-3 mutants were suppressed by the tbh-1 (B) mutation but not by crh-1 (C). The animals were preexposed to 90 nl of 2-nonanone in the absence of food and assayed with 600 nl of 2-nonanone.


