

Article Figures & Data
Figures
- Figure 1.
The method to determine the phase of thalamocortical activity relative to the cortical oscillation. A, B, The raw cortical LFP trace (A) is filtered by a low-pass filter at 5 Hz (B). Three oscillation cycles are shown. C, The Hilbert transformation is performed on the filtered trace, and the instantaneous phase is calculated (see Materials and Methods). D, The phase of thalamocortical unit activity is determined by the instantaneous phase of the LFP trace (red dashed line in A–C). Zero degrees corresponds to the peak of the up state (gray dashed lines), ±180° refers to the trough of the oscillation (gray dash-dot line). Negative phase values refer to the early, rising phase of the up state. Red numbers indicate the phase of thalamocortical activity during the three cycles.
- Figure 2.
Phase advancement of thalamocortical activity with increasing frequency of cortical oscillation. A1–D2, Raw (A) and filtered (B) cortical LFP trace, instantaneous phase (C), and thalamocortical activity (D) relative to the slow cortical oscillation from the first (A1–D1) and last (A2–D2) 30 s of a 106.5 min recording. Note that faster waves (A2–C2) at the end of the recording are accompanied by an earlier phase of the thalamocortical cell than slower waves of the first epoch (compare numbers referring to the phase of firing in C1 and C2). E, Frequency of the LFP recorded from the S1 cortex during entire period of 106.5 min. The LFP activity remained in the delta frequency range (1–3 Hz) but became faster during the last third of the period. F, Phase histogram of a thalamocortical neuron during the same period calculated in 30 s time windows. Warmer colors indicate higher spike counts. Note the phase advancement of the thalamocortical cell firing in parallel to the increase of LFP frequency. The effect is quantified in G (mean phase angle as a function of time). The mean phase appears progressively earlier. The phase advancement was accompanied by a slight increase in the phase coupling strength (H, mean vector length).
- Figure 3.
Wave-to-wave phase shift of thalamocortical activity relative to the cortical slow oscillation. A–D, Four cycles of a slow oscillation epoch with one faster wave (2, red) interspersed among the three slower waves (1, 3, 4, black). A–D are as in Figures 1 and 2. Note immediate phase advancement during the faster wave. E–H, Four oscillation cycles of a faster epoch. Three faster waves (2, 3) are preceded by one slower wave. Note delayed firing of the relay cell during the slower wave. I, Left bar shows the average phase difference of relay cell firing between slower waves (1.1–1.6 Hz) and faster waves (2.0–2.5 Hz) during slower epochs (1.1–1.6 Hz). Dots represent the data of individual cells. Note that the phase of almost all neurons advances during the transiently appearing faster waves. Right bar shows the average phase difference of relay cell firing between faster waves (2.0–2.5 Hz) and slower waves (1.1–1.6 Hz) during faster epochs (2.0–2.5 Hz). Slow waves intruding into a fast epoch cause immediate phase delay.
- Figure 4.
Nuclear localization and firing pattern of the recorded relay cells. A, Localization of all juxtacellularly recorded cells in the thalamus in four coronal planes according to the rat brain atlas of Paxinos and Watson (1998). Blue, red, and green dots represent the position of the recorded VB, Po, and Border neurons, respectively. The green asterisk indicates the neuron shown in C–E. B, Single unit activity of representative VB (blue), Po (red), and Border (green) cells (marked by asterisks in A) and the simultaneously recorded LFP from the S1 cortex. Insets show burst events at a faster time scale. C, Neurolucida drawing of a border cell overlaid on the low-power image of the vGluT2 immunostained coronal section in which the cell body was found. The green trace in B shows juxtacellular recording of the same cell. The border region is indicated by two dashed lines in C. D, The inset of C (white rectangle) at higher magnification. Note the difference in vGluT2 immunostaining between Po and VPM. E, At high power, large vGluT2 terminals contact the proximal dendrites of the labeled cell (arrows). Asterisk = blood vessel. Scale bars: C and D, 200 μm; E, 20 μm.
- Figure 5.
Firing characteristics and burst properties of VB, Po, and Border cells. A–F, Firing properties (A–C) and burst properties (D–F) of VB (blue), Po (red), and Border (green) cells. The plots display median (horizontal black line), interquartile range (box), and the range of nonoutliers (whiskers). Po neurons show a significantly lower firing rate than Border cells (A, B). The intraburst frequency and spike number of Po neurons are also significantly lower than those of VB and Border cells (D, E). *p < 0.05; **p < 0.01, ***p < 0.001.
- Figure 6.
Nuclear specificity of phase preference. A–C, Individual phase histograms of representative VB (A), Po (B), and Border (C) neurons. Zero degrees corresponds to the peak of the cortical up states. B, Average population phase histograms of VB, Po, and Border cells. C, Polar plots showing the phase of all individual cells. Each arrow represents a neuron of the given cell group. Note that most Po and Border cells fire before 0°, whereas most VB cells are active after the peak. D, Polar plot showing the average phase vector for the three cell populations relative to slow cortical oscillations. Note that the population vector of Po and Border neurons overlap; thus, they both discharge significantly earlier than VB cells during the slow oscillation.
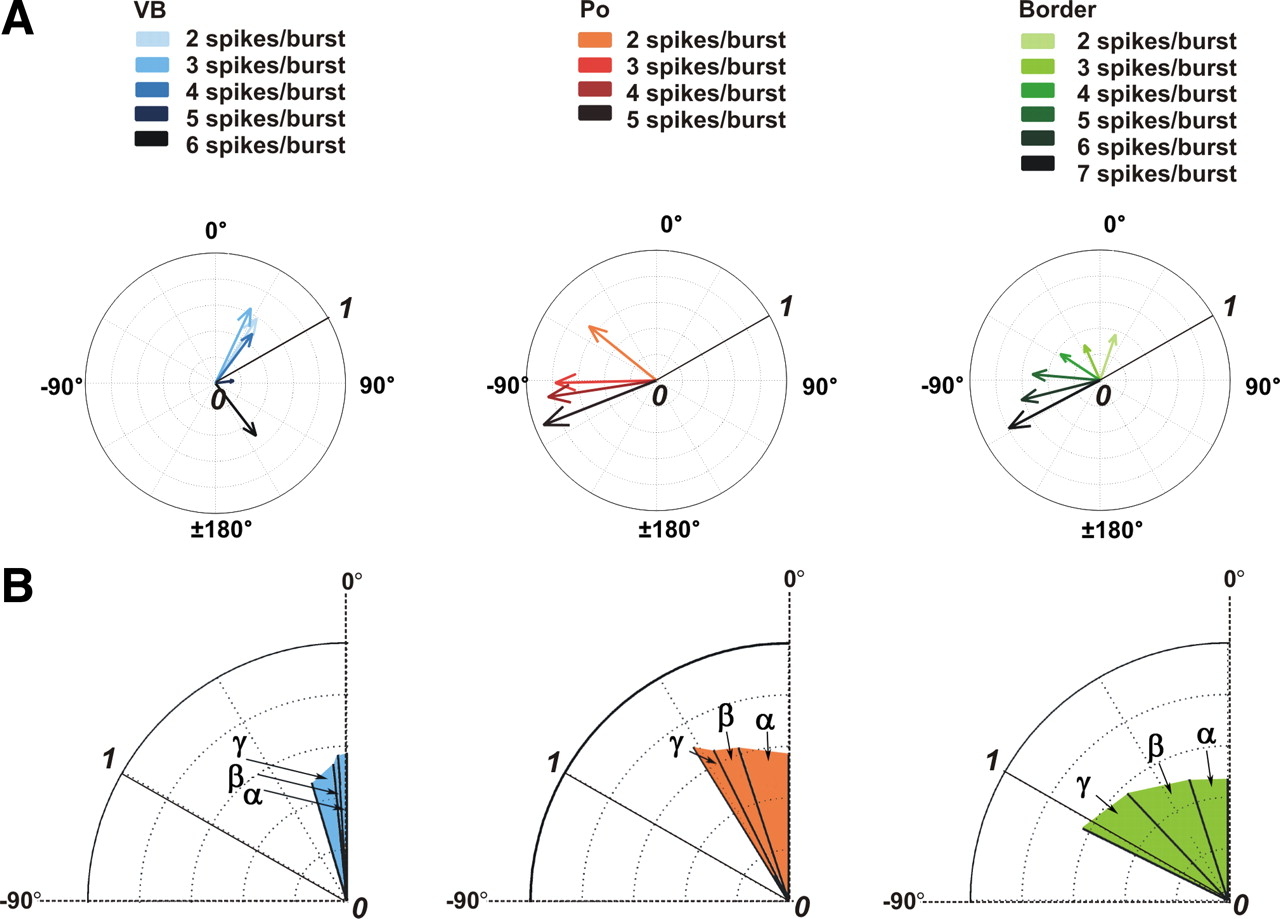
- Figure 7.
Phase preference of bursts with varying number of spikes in VB, Po, and Border cells. A, Polar plots show representative VB (blue), Po (red), and Border (green) cells. In each polar plot, arrows correspond to the phase distribution of bursts with increasing number of spikes (marked by increasing dark tone of the colors). Note phase advancement with increasing number of spikes per burst in the case of Po and Border cells. B, Vectors showing the mean phase difference of bursts with increasing number of action potentials for VB (light blue), Po (orange), and Border (light green) neuron populations. α represents the mean burst phase difference of three spikes per burst and two spikes per burst; β represents the mean phase difference of four spikes per burst and three spikes per burst; and γ shows the phase difference of five spikes per burst and four spikes per burst. Po and Border cells fire at progressively earlier phases of the cortical up state with the increasing number of spikes in a burst, unlike VB cells.
- Figure 8.
Phase coupling of VB, Po, and Border cells to 7–20 Hz oscillations. A, Simultaneous LFP recording from the S1 cortex and juxtacellular recording from a thalamocortical cell (VB). Framed area of the recording is enlarged on the right. Faster oscillations in the spindle frequency range (arrows) ride on the positive part of the slow cortical oscillations. B, Average phase histograms of VB (blue), Po (red), and Border (green) cells. C, The polar plots show the phase preference of the individual cells (VB, blue; Po, red; Border, green). D, The polar plot shows the phase preference and consistency of the three cell groups relative to 7–20 Hz oscillations (0° corresponds to the positive peak). All types of cells show phase locking to cortical oscillations in the spindle oscillation range and fire preferentially before the trough of the spindle waves.
- Figure 9.
Schematic summary of the results demonstrating temporal and spatial phase heterogeneity in the thalamus. A1, A2, As the frequency of oscillation increases, the phase of a thalamocortical cell is shifted toward the beginning of the up state. B1, B2, The phase of the thalamocortical cell changes with each wave. A faster wave intruding into slower waves is paralleled by phase advancement (B1), whereas the appearance of a slower wave among faster ones induces immediate phase delay (B2). C, The phase is nucleus specific; Po and Border cells fire at an earlier phase than VPM cells. D, Bursts with a higher number of action potentials occur progressively earlier during an up state.


Additional Files
Supplemental Material
Files in this Data Supplement:
- supplemental material - Supplemental Material


