

Article Figures & Data
Figures
- Figure 1.
Zbp1-deficient embryos have reduced levels of ZBP1, but extend axons and dendrites normally. A, QIF with a specific ZBP1 antibody demonstrates only background expression of ZBP1 in the soma of neurons cultured from Zbp1-deficient embryos. *p ≤ 0.05, Mann–Whitney. B, No visible protein levels of ZBP1 are seen in the cortical lysate from Zbp1−/− embryos (ZBP1, 70 kDa). β-Tubulin demonstrates that equal amounts of lysate were loaded in each lane (β-tubulin, 55 kDa). C, QIF with a specific ZBP1 antibody demonstrates significantly reduced levels of ZBP1 in the growth cones of Zbp1−/− embryos. *p ≤ 0.05, Mann–Whitney. D, QIF with an anti-FMRP antibody demonstrates that it is not changed in growth cones of Zbp1−/− embryos. Mann–Whitney. E–H, Neurons cultured from Zbp1-deficient mice have numbers of axons (E), proportions of axons and dendrites (F), and total axon (G) and dendrite (H) length similar to those of their wild-type counterparts from the same pregnant mother. Mann–Whitney. I, Growth cone area is not significantly different between Zbp1−/− mice and their wild-type counterparts. Student's t test.
- Figure 2.
Perturbation of ZBP1 affects filopodial length, but does not affect axon outgrowth. A, B, Cortical neurons cultured for 3 DIV from E17 Zbp1+/+ mice (A) and stained with β-tubulin are morphologically indistinguishable from Zbp1−/− neurons (B). Scale bar, 20 μm. C, D, Axon outgrowth measured over 1 h is not significantly different between Zbp1−/− neurons and their wild-type counterparts (C) or between untransfected rat cortical neurons and those overexpressing ZBP1-wt or ZBP1–Y396F, a nonphosphorylatable mutant form of ZBP1 (D). Student's t test (C) and one-way ANOVA (D) demonstrate no significant difference between groups. E, Overexpression of either ZBP1–Y396F or ZBP1-wt in rat cortical neurons results in similar expression levels in the growth cone. Mann–Whitney. F–I, Growth cones from Zbp1−/− mice or those overexpressing ZBP1–Y396F have significantly shorter filopodia than their wild-type counterparts (F, H), but filopodial number is not different between the two groups (G, I). *p ≤ 0.05, repeated-measures ANOVA.
- Figure 3.
Rat cortical neurons demonstrate a protein synthesis-dependent attractive turning response to either netrin-1 or BDNF. A, B, Images of axonal growth cones, cultured from rat cortical neuron balls, before and after 30 min of exposure to a netrin-1 gradient (A, 0 min; B, 30 min). The tip of the micropipette can be seen in the upper left hand corner of the image. Axons subjected to turning assays were >1 mm in length (see Materials and Methods). Scale bar, 20 μm. C, Growth cones exposed to netrin-1 or BDNF exhibit positive turning angles, as compared to vehicle control. *p ≤ 0.017, Kruskal–Wallis and Mann–Whitney post hoc with Bonferroni correction (α = 0.017). D, Cumulative distribution plot of turning angles representing the individual growth cones in C. E, The outgrowth rate over the time course of the experiment was not significantly different between the groups. One-way ANOVA. F, I, Preincubation with a protein synthesis inhibitor, anisomycin (Aniso, 40 μm), abolishes the attractive turning response of growth cones to netrin-1 (F) and BDNF (I). *p ≤ 0.05, Mann–Whitney. G, J, Cumulative distribution plot of turning angles representing the individual growth cones in F and I. H, K, The outgrowth rate over the time course of the experiment was not significantly different between the groups. Student's t test.
- Figure 4.
ZBP1 is required for netrin-1 and BDNF-induced attractive turning. A, D, Axonal growth cones from Zbp1−/− neuron balls do not show the attractive turning response to netrin-1 (A) and BDNF (D) exhibited by wild-type neurons. *p ≤ 0.05, Mann–Whitney. B, E, Cumulative distribution plot of turning angles representing the individual growth cones in A and D. C, F, The outgrowth rate over the time course of the experiments was not significantly different between the groups. *p ≤ 0.05, Mann–Whitney. G–I, Overexpression of ZBP1–Y396F in rat cortical neurons results in the loss of netrin-1-induced attractive turning demonstrated by those neurons overexpressing ZBP1-wt (G, H); however, the outgrowth rate is not significantly different between the two groups (I). *p ≤ 0.05, Mann–Whitney.
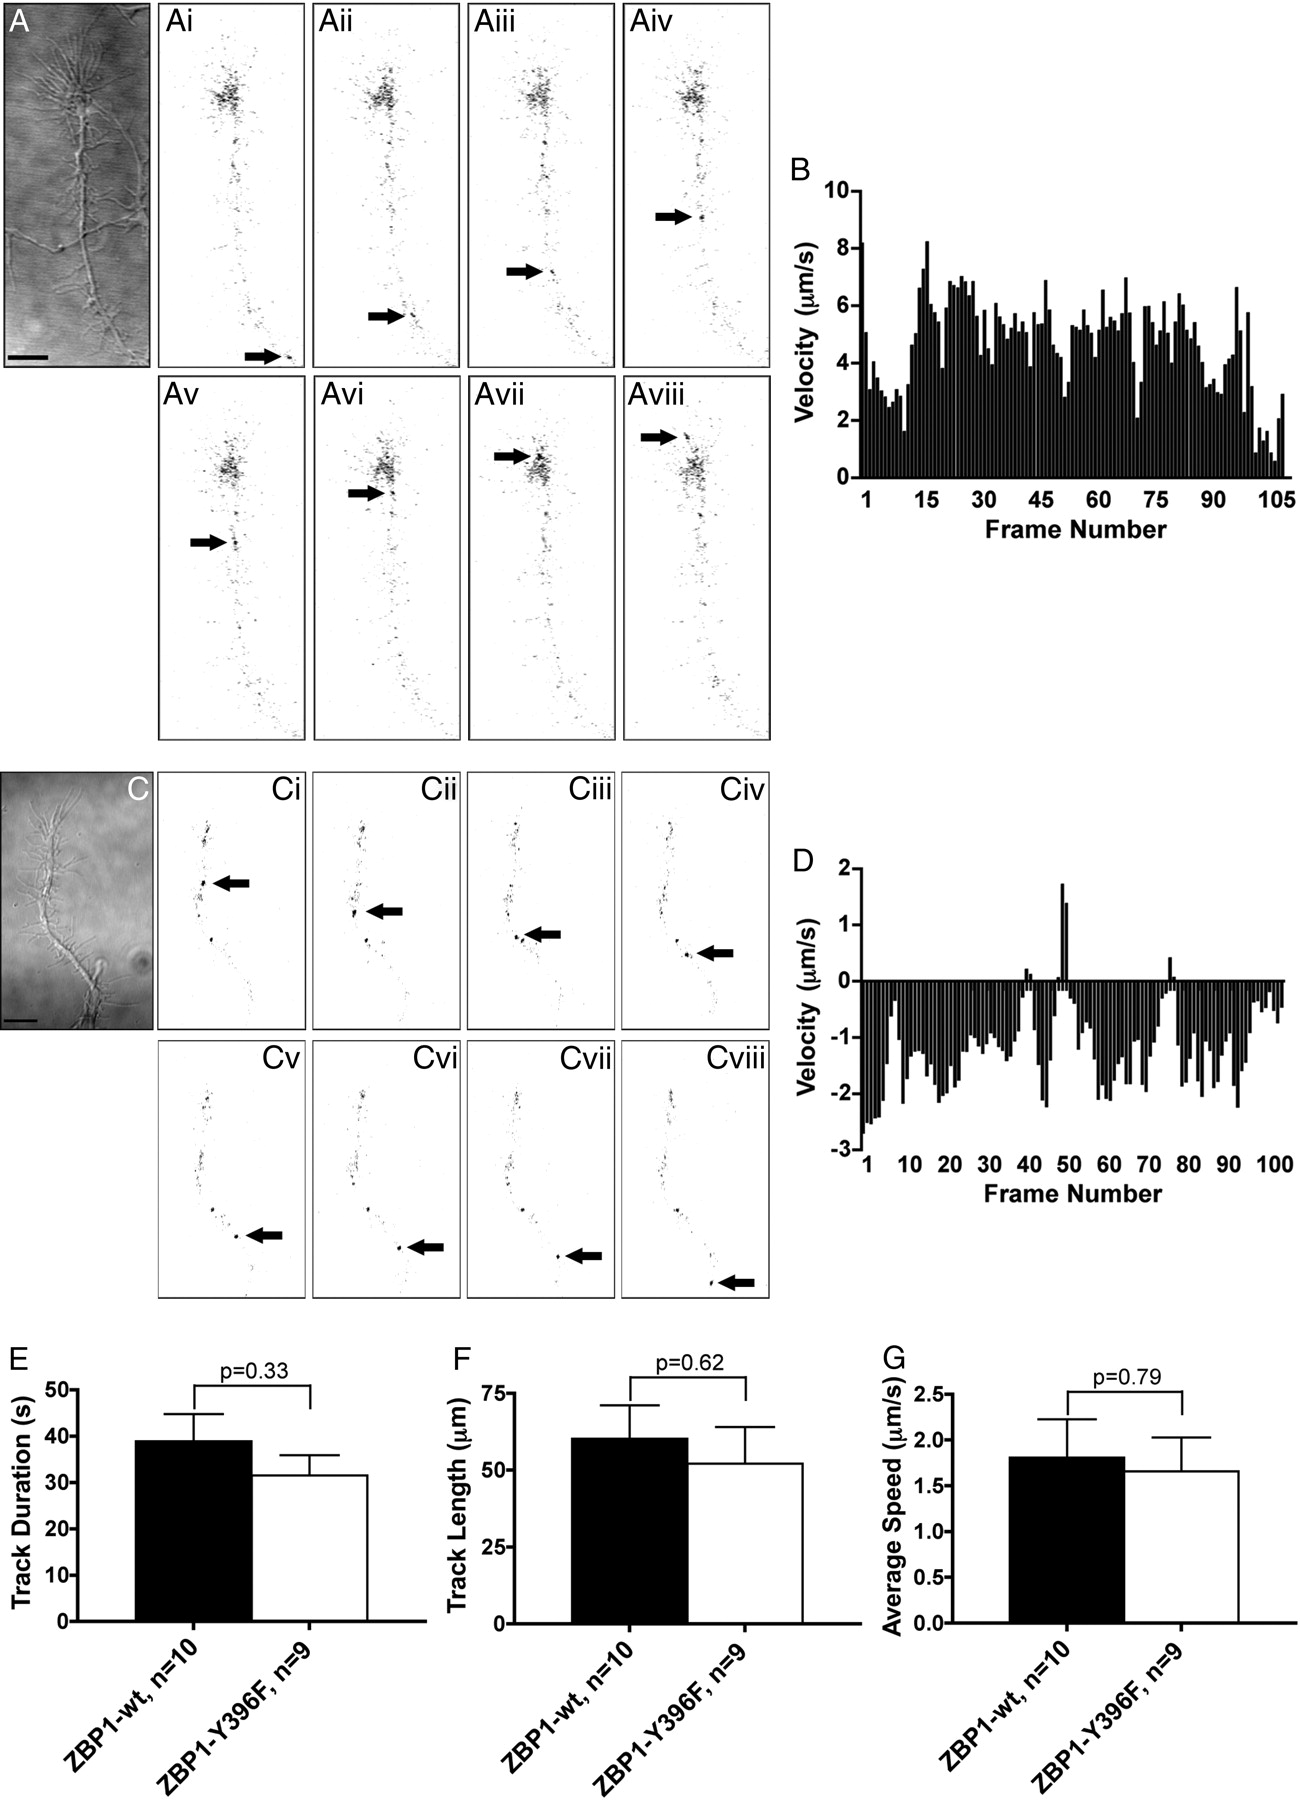
- Figure 5.
mCherry-ZBP1-wt exhibits dynamic anterograde and retrograde movements within the axonal growth cone and distal axon. A–Aviii, mCherry-ZBP1-wt moves in an anterograde fashion into an axonal growth cone. DIC image shown in A and inverted fluorescent images shown in Ai–Aviii. The arrow marks the granule in each image. The images in Ai–Aviii are 2.5 s apart. Scale bar, 10 μm. B, Instantaneous velocity histogram of granule depicted in A (positive values are anterograde and negative values are retrograde). Although only part of the granule track is shown in A, the entire track is represented in the histogram in B. C–Cviii, mCherry-ZBP1-wt moves in a retrograde fashion out of a growth cone and into the distal axon. DIC image shown in C and inverted fluorescent images shown in Ci–Cviii. The arrow marks the granule in each image. The images in Ci–Cviii are 5 s apart. Scale bar, 10 μm. D, Instantaneous velocity histogram of the granule depicted in C (positive values are anterograde and negative values are retrograde). Although only part of the granule track is shown in C, the entire track is represented in the histogram in D. E–G, The track duration, track length, and average speed of ZBP1-wt and ZBP1-Y396F granules are not significantly different from one another. Student's t test.
- Figure 6.
BDNF-induced localization of β-actin mRNA is significantly reduced in Zbp1-deficient mice. A, C, Neurons from Zbp1+/+ (A) and Zbp1−/− (C) embryos were starved for 3 h and then treated with a vehicle control for 15 min. Q-FISH for β-actin mRNA demonstrates only a small amount of staining in the growth cone (tubulin, left panel; β-actin mRNA, right panel). Images of β-actin mRNA are shown in false color for ease of visualization. A false-color intensity map is shown on the far right, with lowest intensities at the bottom of the bar and highest intensities on the top (low intensity pixels are black and blue, and intensities increase from there to yellow, red, and finally white). Scale bar, 5 μm. B, Neurons cultured from Zbp1+/+ embryos were starved for 3 h and then stimulated with BDNF for 15 min, which resulted in a visible increase in β-actin mRNA fluorescent signal in the growth cone (tubulin, left panel; β-actin mRNA, right panel). Scale bar, 5 μm. D, Neurons cultured from Zbp1−/− embryos were starved for 3 h and then stimulated with BDNF for 15 min, which resulted in only a modest increase in β-actin mRNA fluorescent signal in the growth cone (tubulin, left panel; β-actin mRNA, right panel). Scale bar, 5 μm. E, Using Q-FISH, there is no significant difference between Zbp1+/+ and Zbp1−/− neurons that are starved and vehicle treated in terms of the β-actin mRNA fluorescent signal in the growth cone. F, Quantification of β-actin mRNA FISH signal in neurons from Zbp1+/+ or Zbp1−/− embryos subjected to the above treatments. The fluorescent signal of growth cones treated with BDNF was normalized to vehicle-treated growth cones. Treatment of neurons from Zbp1+/+ embryos with BDNF results in significantly increased localization of β-actin mRNA fluorescent signal in the growth cone, as compared to those from Zbp1−/− embryos. *p ≤ 0.05, Mann–Whitney test.
- Figure 7.
BDNF-induced localization of β-actin protein is significantly reduced in Zbp1-deficient mice. A–D, Neurons cultured from Zbp1+/+ (A, B) and Zbp1−/− (C, D) embryos were starved for 3 h and then stimulated with BDNF (B, D) or vehicle control (A, C) for 30 min. There is a larger increase in β-actin protein fluorescent signal in Zbp1+/+ growth cones (B) than in Zbp1−/− growth cones (D) following BDNF stimulation. β-Actin protein is shown in black and white (left panel) and false color (right panel) for ease of visualization. See Figure 6A legend for explanation of false color scale. Scale bar, 5 μm. E, QIF demonstrates that BDNF-induced localization of β-actin protein is significantly reduced in the peripheral region of growth cones from Zbp1−/− embryos. *p ≤ 0.05, Mann–Whitney test. F, QIF shows that there is no significant difference between Zbp1+/+ and Zbp1−/− neurons that are starved and vehicle treated in terms of the β-actin protein fluorescent signal in the peripheral region of the growth cone. G, QIF demonstrates that BDNF-induced localization of β-actin protein is not affected in the central region of growth cones from Zbp1−/− embryos. *p ≤ 0.05, Mann–Whitney test. H, I, Quantitative image analysis shows that BDNF-induced localization of β-actin protein in enriched or hot spots is significantly reduced in growth cones from Zbp1-deficient mice (H). Additionally, there is a reduction in the number of these spots in Zbp1-deficient mice (I). *p ≤ 0.05, Mann–Whitney test.
- Figure 8.
ZBP1 is required for netrin-1 stimulated local translation of a β-actin reporter in growth cones. A, B, Neuron balls from either Zbp1+/+ (A) or Zbp1−/− (B) embryos were transduced with PalX2-Dendra2-β-actin 3′UTR. Growth cones can be seen before conversion in “DIC” (leftmost panel), followed by “Pre Conversion” (overlay of green and red channels, but green fluorescence predominates), and also “Post Conversion” (overlay of green and red channels, but after UV conversion red fluorescence predominates). Following netrin-1 addition, the green fluorescence increases after 30 min in Zbp1+/+ growth cones, but not those from Zbp1−/− embryos (last two images in the series are the green channel only and shown in false color; see Figure 6A legend for explanation of false color scale). C, Application of netrin-1 results in an increase in green fluorescence in Zbp1+/+ growth cones transduced with PalX2-Dendra2-β-actin 3′UTR, as compared to Zbp1−/− growth cones transduced with the same construct. Neurons that received a vehicle control instead of netrin-1 or were transduced with a construct without the β-actin 3′UTR did not show an increase in fluorescence over basal translation rates. Data are represented as ΔF/F0 and then multiplied by 100. *p ≤ 0.01, Repeated-measures ANOVA with Bonferroni post hoc and correction (α = 0.01). D, Data shown in C, but only at the 30 min time point. E, Q-FISH to dendra2 mRNA demonstrates that the average intensity of dendra2 mRNA in Zbp1−/− growth cones was significantly reduced as compared to wild-type neurons. Both neuronal types were transduced with the PalX2-Dendra2-β-actin 3′UTR construct. *p ≤ 0.05, Mann–Whitney. F, Preincubation with a protein synthesis inhibitor, anisomycin, before stimulation with netrin-1 abolishes the increase in β-actin reporter translation. All groups were treated with netrin-1 in this experiment, and “+Vehicle” in the figure legend refers to the vehicle for anisomycin. Data are represented as ΔF/F0 and then multiplied by 100. *p ≤ 0.025, Repeated-measures ANOVA with Bonferroni post hoc and correction (α = 0.025).
- Figure 9.
ZBP1 regulates local β-actin synthesis and growth cone guidance. ZBP1 orchestrates a series of events that are necessary for responses to attractive guidance cues. First, ZBP1 binds to β-actin mRNA in the soma and transports it to the growth cone on microtubules. Then, in response to a growth or guidance cue, Src kinase phosphorylates ZBP1, which results in the local translation and enrichment of β-actin. This newly synthesized β-actin is locally integrated into the growth cone, resulting in a change in growth cone dynamics and/or guidance. As we have demonstrated, the loss of ZBP1 results in the perturbation of this cascade, and thus can disrupt normal cell motility.


Movies
- Movie 1.
Examples of turning assays. A, Rat cortical neurons show an attractive turning response to netrin-1 (5 μg/ml). Images were acquired by time-lapse phase microscopy. Frames were taken every 50 s for 20 min. B, Rat cortical neurons exhibit protein synthesis-dependent attractive turning to netrin-1. Preincubation of rat cortical neurons with anisomycin (40 μm) prior to application of netrin-1 (5 μg/ml) results in inhibition of the attractive turning response. Images were acquired by time-lapse phase microscopy. Frames were taken every 5 min for 30 min. C, Mouse cortical growth cones from Zbp1+/+ embryos exhibit attractive turning in response to netrin-1 (5 μg/ml). Images were acquired by time-lapse phase microscopy. Frames were taken every 5 min for 30 min. D, Mouse cortical growth cones from Zbp1-deficient embryos lose their attractive turning response to netrin-1 (5 μg/ml). Images were acquired by time-lapse phase microscopy. Frames were taken every 5 min for 30 min.
- Movie 2.
Anterograde and retrograde traffic of ZBP1 throughout the axon and growth cone. A, Expression of mCherry-ZBP1-wt (green) in rat cortical neurons demonstrates fast anterograde and retrograde movements of ZBP1-wt into and out of the growth cone. Images were acquired by time-lapse confocal microscopy. Frames were taken every 1 s for 100 s. B, Expression of mCherry-ZBP1-Y396F (green) in rat cortical neurons demonstrates fast anterograde and retrograde movements of ZBP1-Y396F into and out of the growth cone. Images were acquired by time-lapse confocal microscopy. Frames were taken every 0.5 s for 90 s.


