

Article Figures & Data
Figures
- Figure 1.
Overview of the experimental design. A, Subjects received several different phases of training. First they were acclimated to the training context for several days before and after surgery. This reduced their stress during subsequent training. After the acclimation phase, aversive classical conditioning with a tone and shock took place over several days, which is known to induce both conditioned responding to the tone and plasticity in A1. The last phase was discrimination training, which allowed us to test whether subjects had formed an associative memory for the CS+. B, Each of the conditioning and discrimination sessions could be divided into two phases. RFs were acquired by playing a series of tone pips, followed by the training phase. C, Trials featuring the CS+ were the same for both conditioning and discrimination; the CS+ was presented for 10 s, followed by a 1 s silent trace period, and then a 1 s shock. During discrimination, a 10 s CS− was presented for half the trials, without any reinforcement. US, Unconditioned stimulus.
- Figure 2.
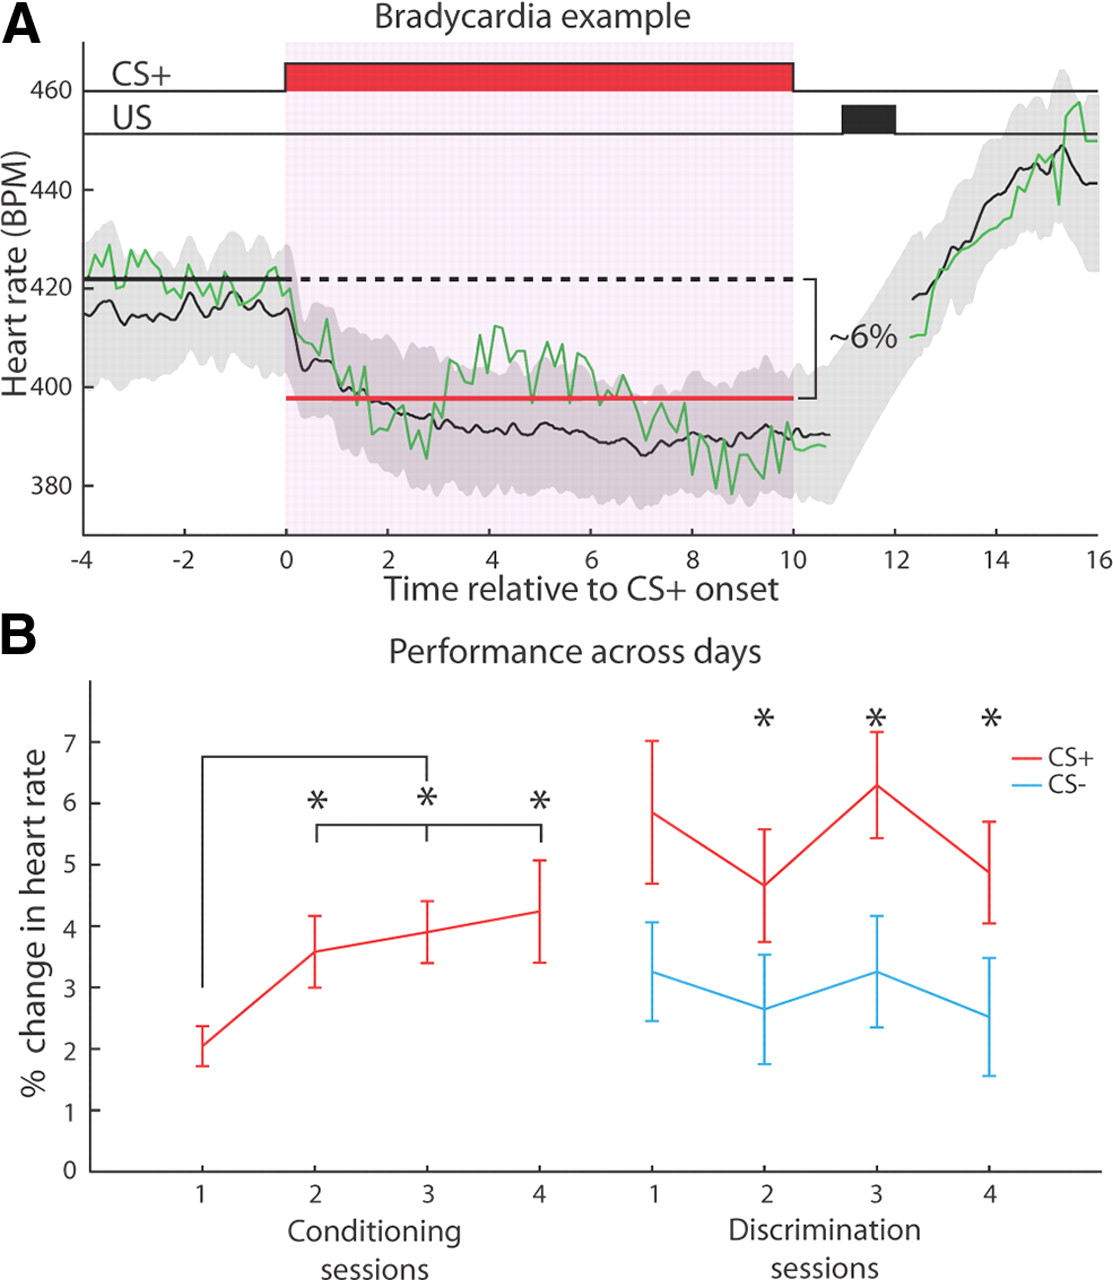
Behavior during training. A, An example of conditioned bradycardia from a single subject on the second day of conditioning. The green line is a single trial, and the black line and gray shading are the mean CR across all valid trials for that session and ±1 SD, respectively. The thick solid black line denotes the pre-CS baseline period, and the red line demonstrates the CS period used to calculate the CR strength. For each trial, the CR was defined as the percentage difference between the mean heart rate for each of these periods. US, Unconditioned stimulus. B, Subjects learned the tone/shock contingency within a single day of training, displaying asymptotic performance by the second day of training. They exhibited evidence of discrimination between the CS+ and CS− on the first day of training, and a within-session statistically significant difference between the responses to either stimulus was attained on the second day of training. Across all discrimination days, the CS+ elicited a significantly stronger CR than the CS−. Asterisks denote a significant difference (Wilcoxon rank-sum test). Error bars indicate mean ± SEM.
- Figure 3.
Characterization of the CS+-induced gamma activity. A, The mean spectrogram from all subjects across all recording sites and conditioning days. A brief broadband increase in spectral power occurs for 200 ms after the tone, followed by a relatively narrow activation in the gamma band from 40 to 120 Hz, which develops over several hundred milliseconds and appears to be strongest 0.5–4.0 s after tone onset. B, The mean z-score change in spectral power across all recording sites during conditioning. The blue line corresponds to the 4.0 s pretone baseline period, and the red line is the entire 10 s tone period. Shaded regions denote ±1 SD intervals. C, An example spectrogram from a single electrode, on a single trial. Note that gamma activation tends to occur in half-second bursts, which recur throughout the duration of the CS+. The saturated region between 11 and 12 s was caused by the shock artifact. D, Same data as shown in C, but instead the LFP waveform and several bandpass (10 Hz bandwidth around each center frequency, Butterworth filter) filtered traces are displayed. The LFP signal displays the hallmarks of low-voltage fast activity after tone onset, and the bandpassed traces show a decrease in power for a low-frequency band (9 Hz) and an increase in the higher frequency bands (40, 70, and 100 Hz). Each trace was z-normalized to its pre-CS+ baseline. The gray dotted line indicates the CS+ onset. E, Four magnified segments of the same data shown in D.
- Figure 4.
Gamma modulation of memory for the CS+ during conditioning. A, The CS+ on the first day of conditioning elicited gamma-band activation. Several examples of gamma responses from different subjects, in descending order from strongest to weakest. Each colored line is the mean for the first conditioning session, and the shaded gray portion denotes ±1 SD across trials. The color of each line indicates the corresponding data point in B. The lavender shaded portion of the graph (2–4.0 s from CS+ onset) was the analysis window used to judge induced gamma strength for all analyses. B, CS+-induced gamma during the first conditioning session predicted subsequent behavioral performance on the second session. C, The same analysis as in B, except that gamma during Session 2 is compared with performance during Session 3. D, Same analysis as in B, except that gamma during Session 3 is compared with performance during Session 4. E, The strength of CS+-induced gamma during the first conditioning session was compared with CR strength for the same session. For each plot, a straight red line is the best-fit linear regression. All correlations were assessed using Spearman's correlation coefficient. Axes labels in E also apply to C and D.
- Figure 5.
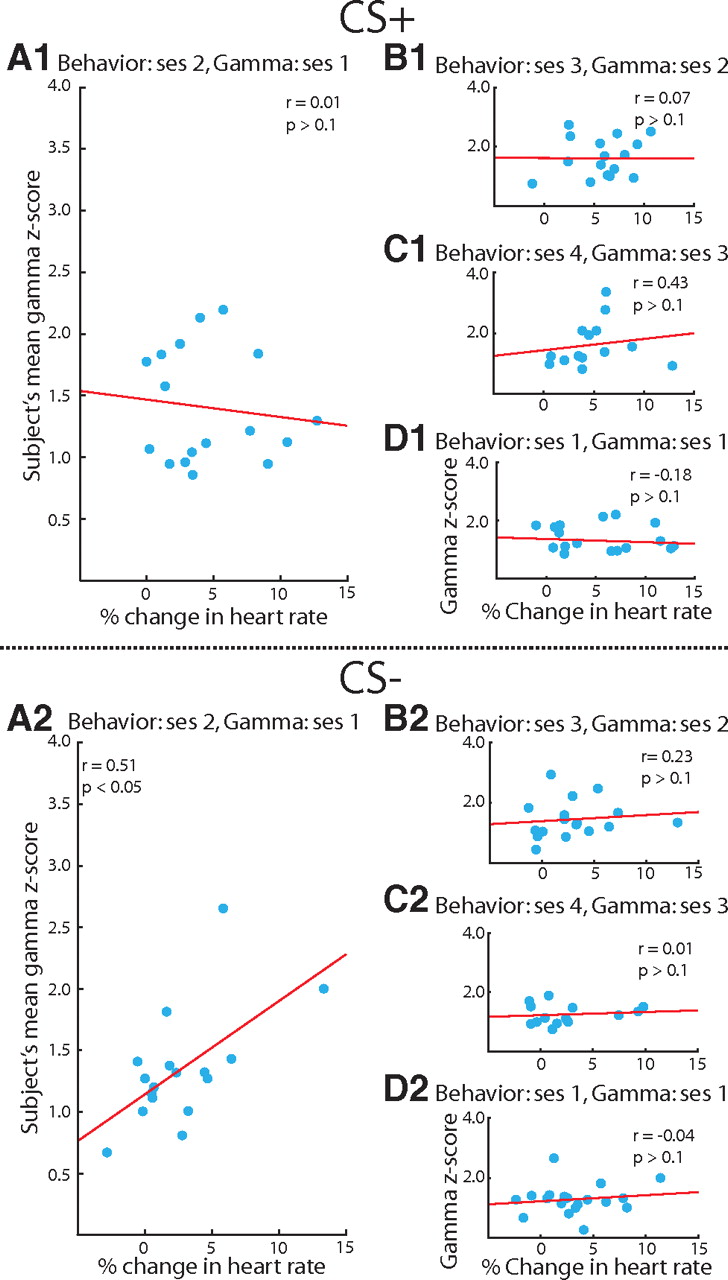
Gamma modulation of memory for the CS+ and CS− during discrimination training. Both Sections 1 and 2 of this figure are the same types of comparisons done in Figure 4, but during discrimination training. Section 1 shows the relationship between gamma and performance for the CS+, and Section 2 is the CS−. A1, B1, and C1 all demonstrate that discrimination training did not revive gamma modulation of responding to the CS+. D1, During the first discrimination session, CS+-induced gamma did not predict performance. This did not mean that gamma had ceased to modulate memory in general, because the gamma induced by the CS− during the first discrimination session correlated with responding to the CS− during the second session, A2. Similar to the CS+ during conditioning, the CS−-induced gamma correlated with responding to the CS− on the following day, but ceased to correlate with performance for the remaining sessions (B2, C2), and it was not predictive of responding within the first session (D2). All correlations were assessed using Spearman's correlation coefficient. Axes labels in D also apply to B and C.
- Figure 6.
Specificity of RF plasticity. A, Four examples of RF plasticity, each taken from a different subject. The black line is the baseline RF obtained immediately before the first conditioning session, and the red line is the mean RF obtained across all conditioning days. A green dotted line indicates the frequency of the CS+ tone. Increases at the CS+ frequency are evident. Error bars are mean ± SEM. B, RF plasticity was specific to the CS+. Across all RF changes during conditioning, only those at the CS+ frequencies were significantly greater than zero (Wilcoxon sign-rank test, p < 0.01), indicating a net increase in responding to the CS+. The median change for every other frequency within 1 octave of the CS+ was not significantly different from zero; no net change occurred in responding to non-CS+ frequencies. The inset bar graph further illustrates this point, showing that the changes at the CS+ were significantly greater than those for non-CS+ frequencies (Wilcoxon rank-sum test, p ≈ 0.01). Error bars indicate median ± SEM.
- Figure 7.
Gamma modulation of plasticity for the CS+. A, CS+-induced gamma was normalized relative to the subject's mean gamma. Relative gamma is the percentage difference between gamma on a particular electrode and the mean gamma for that subject. Pooling recording sites across all subjects, relative gamma had an inverted-U relationship with the magnitude of plasticity for the CS+. Recording sites with greater absolute relative gamma had weaker plasticity (Spearman's rank correlation, inset graph, r = −0.45, p ≈ 0.01). This relationship between gamma and plasticity at the CS+ was only present between relative gamma during the first conditioning session and RF plasticity detected on the subsequent day (B, C). D, To determine whether modulation of RF plasticity was specific to the CS+ frequency, we compared relative gamma during the first conditioning session with RF changes ±1 octave (±0.25 octave displayed) away from the CS+ on the following day. No relationship was present, indicating a high degree of specificity for gamma modulation of RF plasticity. For all graphs, the regression lines are the best-fit exponential curves. Two data points with outlier values for relative gamma are not shown, but were included for all statistical analyses.
- Figure 8.
Characteristics of relative gamma. A, Octave distance between the baseline RF's BF and the CS+ frequency was not significantly correlated with relative gamma. B, Gamma strength was significantly correlated with relative gamma. C, Gamma bandwidth, defined as the half-width for the entire induced gamma response (from 0.2 s after tone onset until tone offset), was significantly related to relative gamma, albeit weakly. Dashed lines denote the 68% confidence interval. Two data points with outlier values for relative gamma are not shown, but were included for all statistical analyses.


