

Article Figures & Data
Figures
- Figure 1.
Characteristics of fluorescent spots labeled with anti-Bassoon antibodies. A, Single confocal section of a NMJ labeled with anti-Bassoon-Alexa 647. Bassoon spots are distributed throughout the terminal. The region in the rectangle is enlarged below and illustrates the segmentation method using a watershed function to identify spots (left panel), which are then selected (blue) or deselected (magenta) according to spot size and brightness. Selected spots are then further segmented (right panel; white lines) (see Materials and Methods). Scale bar, 5 μm. B, The mean number of Bassoon spots per terminal is proportional to the terminal size (mean number of particles, 850 ± 252; n = 9; mean ± SD). C, Distribution of FWHMs of Bassoon spots from terminal in A. D, Distribution of the total brightness (integrated fluorescence) of Bassoon spots from a Z-projection from a different terminal. E, Relationship between maximum fluorescence values of each spot with the half-width of the spots, from terminal shown in A, showing a poor correlation between these two parameters.
- Figure 2.
Spatial pattern of Bassoon and Piccolo spots. A, Top panel, Z-projection of part of an anti-Bassoon-labeled terminal. Some spots are clearly aligned in parallel lines that run perpendicular to the long axis of the nerve terminal. Bottom panel, Terminal stained for Piccolo. B, Observed (left) nearest neighbor distribution of Bassoon spots in a representative terminal is well fit by a Gaussian. The mean ± SD nearest neighbor separation is 532 ± 260 nm. In a simulation (right), the same number of spots placed randomly in the terminal gave a very different distribution (p < 0.0001). C, Left panel, High-magnification of Bassoon spots showing the centroid (red squares) of each spot. Middle, The postsynaptic membrane stained with BTX-Rho shows regions of high intensity corresponding to the openings of postsynaptic folds. Right, Bassoon centroids lie precisely over postsynaptic folds. Scale bars, 2 μm.
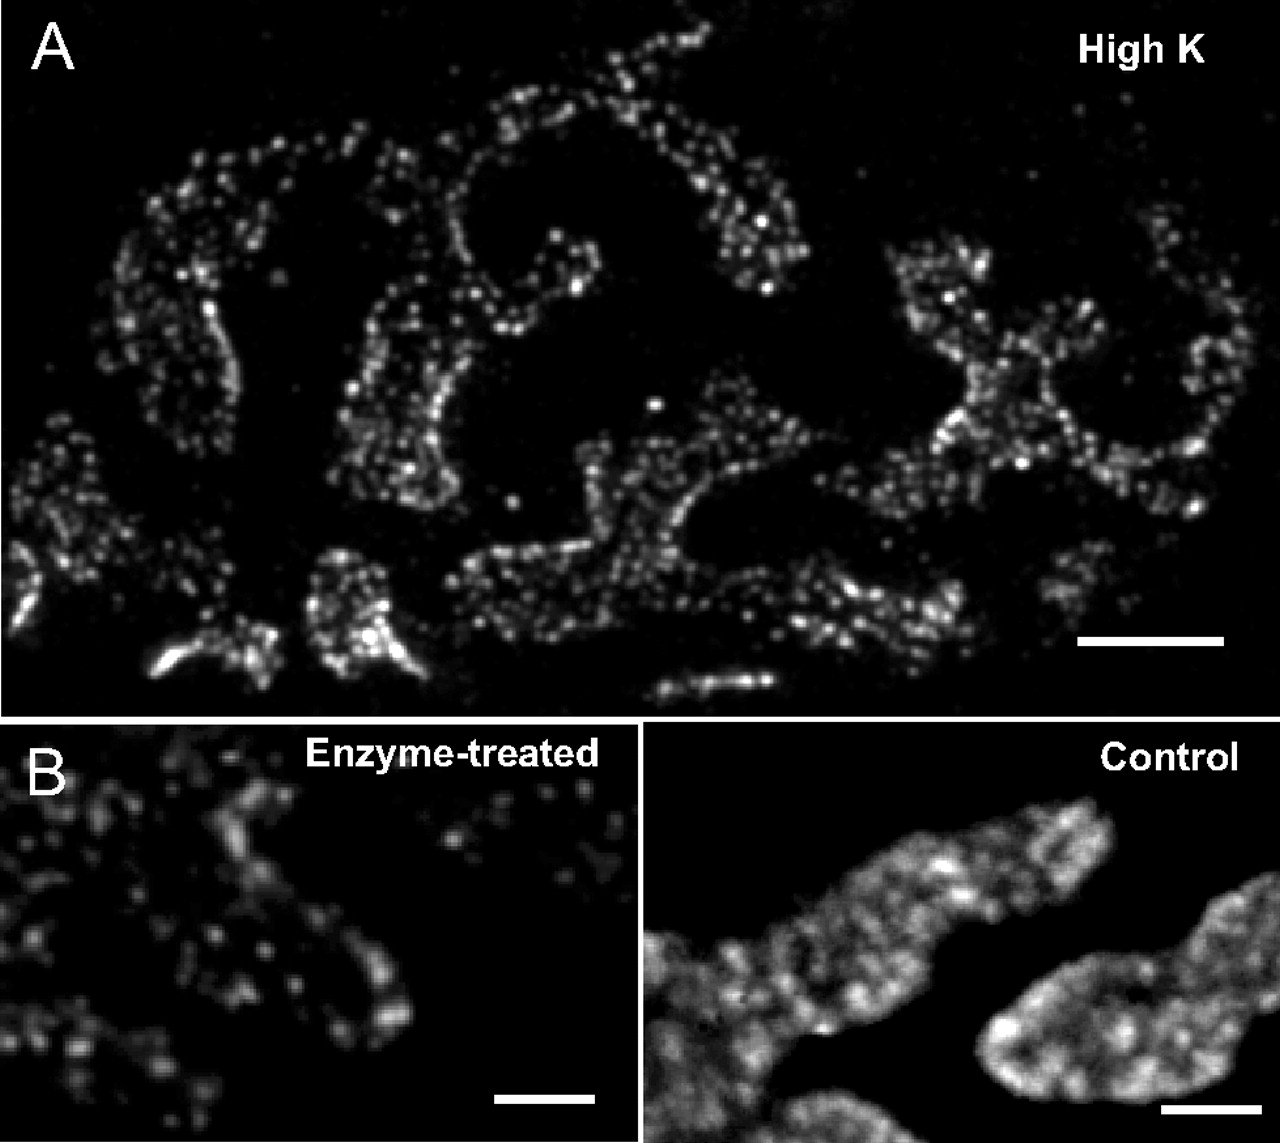
- Figure 3.
Bassoon spots under perturbing conditions. A, Stimulation with 70 mm K+ (1 min duration) did not disrupt the pattern of Bassoon staining, which is indistinguishable from controls. Scale bar, 5 μm. B, Left, Exposure to proteolytic enzymes (collagenase plus protease for 30 min) severely disrupted the amount and pattern of Bassoon staining. Right, Control terminal processed in parallel. Scale bars, 2 μm.
- Figure 4.
Dynamics of neurotransmitter release and calculation of RRP size. A, Peak endplate potential amplitudes during a 100 Hz, 1 s, train of stimulation show a characteristic decay to a plateau. B, Quantum contents (m) during the train (mean ± SEM for 3 sequential trains). C, Estimating RRP size by plotting cumulative m versus time, and linearly extrapolating to the y-axis (see text for critique). D, Estimating RRP size by plotting m (y-axis) versus cumulative m (x-axis) and linearly extrapolating the initial decline to the x-axis. E, Estimating RRP size and recruitment time by curve fitting to a function of the sum of exponential decay of the RRP plus sigmoidal rise of recruitment (dotted lines). Methods D and E ignore contributions from facilitation.
- Figure 5.
RRP recovery time course. Paired trains (each 100 Hz for 1 s) were given, separated by varying intervals. The size of the RRP was measured for each train, and the ratio (second train/first train) is plotted against intertrain interval. The best exponential fit to control preparations is 823 ms, with recovery reaching 87% of the control value. Also shown is the effect of treatment with PE (1 μm), which greatly accelerated recovery.
- Figure 6.
Frequency dependence of RRP size, depletion, and refilling. A, Quantum content of EPPs during trains of different frequencies [1 (black), 5 (yellow), 10 (light blue), 20 (dark blue), 50 (green), and 100 (red) Hz], each with 100 shocks, as a fraction of the largest EPP in the train. Logarithmic x-axis. B, Relative plateau values as a function of stimulation frequency. The plateau level declines steeply between 1 and 10 Hz, and then levels off, changing relatively little between 10 and 100 Hz. C, Three examples of quantum contents (1, 10, and 100 Hz trains) illustrating the tight coupling between RRP loss and recruitment, over a 100-fold range of frequency. Note the changing x-axis limits. D, The time constant of RRP loss (red) and the half-time of RRP refilling (black) are steeply dependent on stimulation frequency (x-axis) but tightly coupled. Logarithmic x-axis. E, Calculated RRP size depends on stimulation frequency, more than doubling as the frequency rises from 1 to 100 Hz. Error bars are ±1 SD.
- Figure 7.
Disrupting the coupling between RRP depletion and recruitment. A, Raising the temperature from 23°C (black) to 37°C (red) did not change the RRP size (decaying red and black are nearly identical) but shortened the half-time of recruitment (sigmoidal dashed lines). Muscle contraction was blocked with 1.1 μm curare in this experiment. B, PE (1 μm) increased initial m (from 44 to 64 quanta) but did not significantly change RRP size (control, 950; PE, 997). RRP rundown was faster (control, 218 ms; PE, 156 ms) and the half-time of the rise in recruitment was shorter (control, 280 ms; PE, 210 ms). PE also greatly accelerated the recovery of the RRP after the end of the train (Fig. 5, PE). C, Treatment with EGTA-AM reduced quantum content (left panel) and RRP size. When normalized to initial quantum contents (right panel), it is clear that EGTA treatment selectively decreased the plateau, which according to the kinetic model reflects slowed recruitment.
- Figure 8.
Calculations of n and p during a train of stimuli. Iterative calculations for each EPP during a train, based on different dead times, that is, the interval between exocytosis and reloading of a release site (see Materials and Methods for details). Dead time was constant during any single train. A, Dead time was assumed to equal the half-time of the sigmoidal recruitment curve (Fig. 6C), and the release probability p that would be required to produce the observed quantum content for each stimulus is plotted against stimulus number for different frequencies [1 (black), 5 (yellow), 10 (light blue), 20 (dark blue), 50 (green), and 100 (red) Hz]. Some p values rose to improbably high values (sometimes exceeding 1.0). B, The same plots shown for dead times that gave minimal variation in p during the train. C, The dead times from A (open circles) and B (filled circles) are plotted against stimulus frequency. They show a similar trend and reach a minimum dead time of 250–300 ms at 100 Hz. D, Values of the number of occupied release sites (n) for each frequency, calculated using the dead time values and p values from B (filled circles).


