

Article Figures & Data
Figures
- Figure 1.
Mutation of GluK2 dimer interface KA efficacy. A, Crystal structure of the dimeric GluK2 ligand-binding domain in complex with Glu and two cations (one green and one white sphere) and one anion (yellow sphere) (Protein Data Bank number 3G3F). B, Left, Representative response of wild-type (WT) GluK2 receptors to Glu (10 mm; black trace) and KA (1 mm; blue trace; patch number 030724p2). Right, Plot summarizing the effect of point mutations on the relative responsiveness of GluK2 receptors to KA. C, Membrane currents elicited by Glu (10 mm; black traces) and KA (1 mm; blue traces) for GluK2 mutants D776E (left; patch number 100121p6), T779N (middle; patch number 100128p2), and K531A (right; patch number 070215p2).
- Figure 2.
Anions do not affect responsiveness to GluK2 agonists. A, Typical membrane currents evoked by GluK2 receptors in response to Glu (10 mm) or KA (1 mm) in 150 mm NaCl (left; patch number 030724p2), NaNO3 (middle; patch number 051215p3), or NaI (right; patch number 060210p3). B, Summary plot comparing the relative peak response produced by each agonist in different external anion solutions [NaCl (black), NaNO3 (light gray), or NaI (dark gray)]. Each dotted line corresponds to a linear regression fit of the data obtained in different external anion solutions.
- Figure 3.
Cations profoundly affect responsiveness to GluK2 agonists. A, Representative currents elicited by GluK2 receptors in response to Glu (10 mm) or KA (1 mm) in 150 mm NaCl (left; patch number 030724p2), KCl (middle; patch number 051201p3), or RbCl (right; patch number 060502p1). B, Plot comparing the responsiveness to each agonist in different external cations relative to the response elicited by 10 mm Glu. Dotted lines show linear regression fits of the data in different external cations.
- Figure 4.
Cations regulate responsiveness to agonists even at saturating ionic conditions. A, Responses to Glu (10 mm), KA (1 mm), and AA (40 mm) in either 600 mm NaCl (left; patch number 100416p7) or 600 mm KCl (right; patch number 100420p1). Note that in KCl, the peak response to each partial agonist relative to Glu is reduced. B, Summary plot showing averaged data of the same experiment with the dotted lines indicating linear regression fits of the data in different external cations.
- Figure 5.
Cation substitution effects on Glu and KA dose–response curves. A, Membrane currents elicited by various concentrations of Glu in 150 mm NaCl (left; patch number 100930p4) or KCl (right; patch number 101005p3). B, Summary of dose–response data and fits for Glu in NaCl (black circles and line) and KCl (gray circles and line). C, Membrane currents elicited by various concentrations of KA in 150 mm NaCl (left; patch number 100927p5) or KCl (right; patch number 100928p5). D, Summary of dose–response data and fits for KA in NaCl (black circles and line) and KCl (gray circles and line).
- Figure 6.
Tethering a positively charged Lys at the 770 residue eliminates cation regulation of GluK2. A, Left, Crystal structure of wild-type GluK2 cation-binding site showing residues that directly interact with the bound cation (blue sphere) (Protein Data Bank number 3G3F). Right, Identical structure as on the left, with the Met770 residue replaced by Lys. Note that the Lys side chain extends into the binding site preventing the docking of an external cation. B, Left, Comparison of peak agonist responses (normalized to Glu in the indicated cation) in NaCl (black), KCl (light gray), and RbCl (dark gray) versus NaCl (abscissa) for all agonists tested on GluK2 wild-type receptors. Dotted lines show a linear regression fit of the data for each cation. Note that every agonist has a reduced peak response following cation substitution. Right, Similar comparison as shown on the left, but for GluK2 M770K receptors. Note in this case the effect of external cations on agonist peak responses is eliminated.
- Figure 7.
Agonist equilibrium/peak relationship. A, Membrane currents elicited by Glu (10 mm), KA (1 mm), AA (40 mm), and Dom (50 μm) in an outside-out patch expressing GluK2 receptors. Peak responses in each case were normalized to allow comparison (patch number 060207p2). B, Left, Summary plot showing that there is an approximate inverse relationship between peak (abscissa) and equilibrium (ordinate axis) GluK2 agonist responses in NaCl (open circles) and in NaI or NaNO3 (gray triangles). Each point represents a specific agonist from this study (see Table 1) or from that by Fay et al. (2009). The solid line is a fit of the NaCl data using Eq. 2 (n = 1.67, k = 1866, C = 0.01). Right, Summary plot showing the inverse relationship in NaCl (black line from NaCl fit on the left) and in KCl or RbCl (light gray squares). The light gray line is a fit of the K+ and Rb+ data using Eq. 2 (n = 1.8, k = 760, C = 0.1).
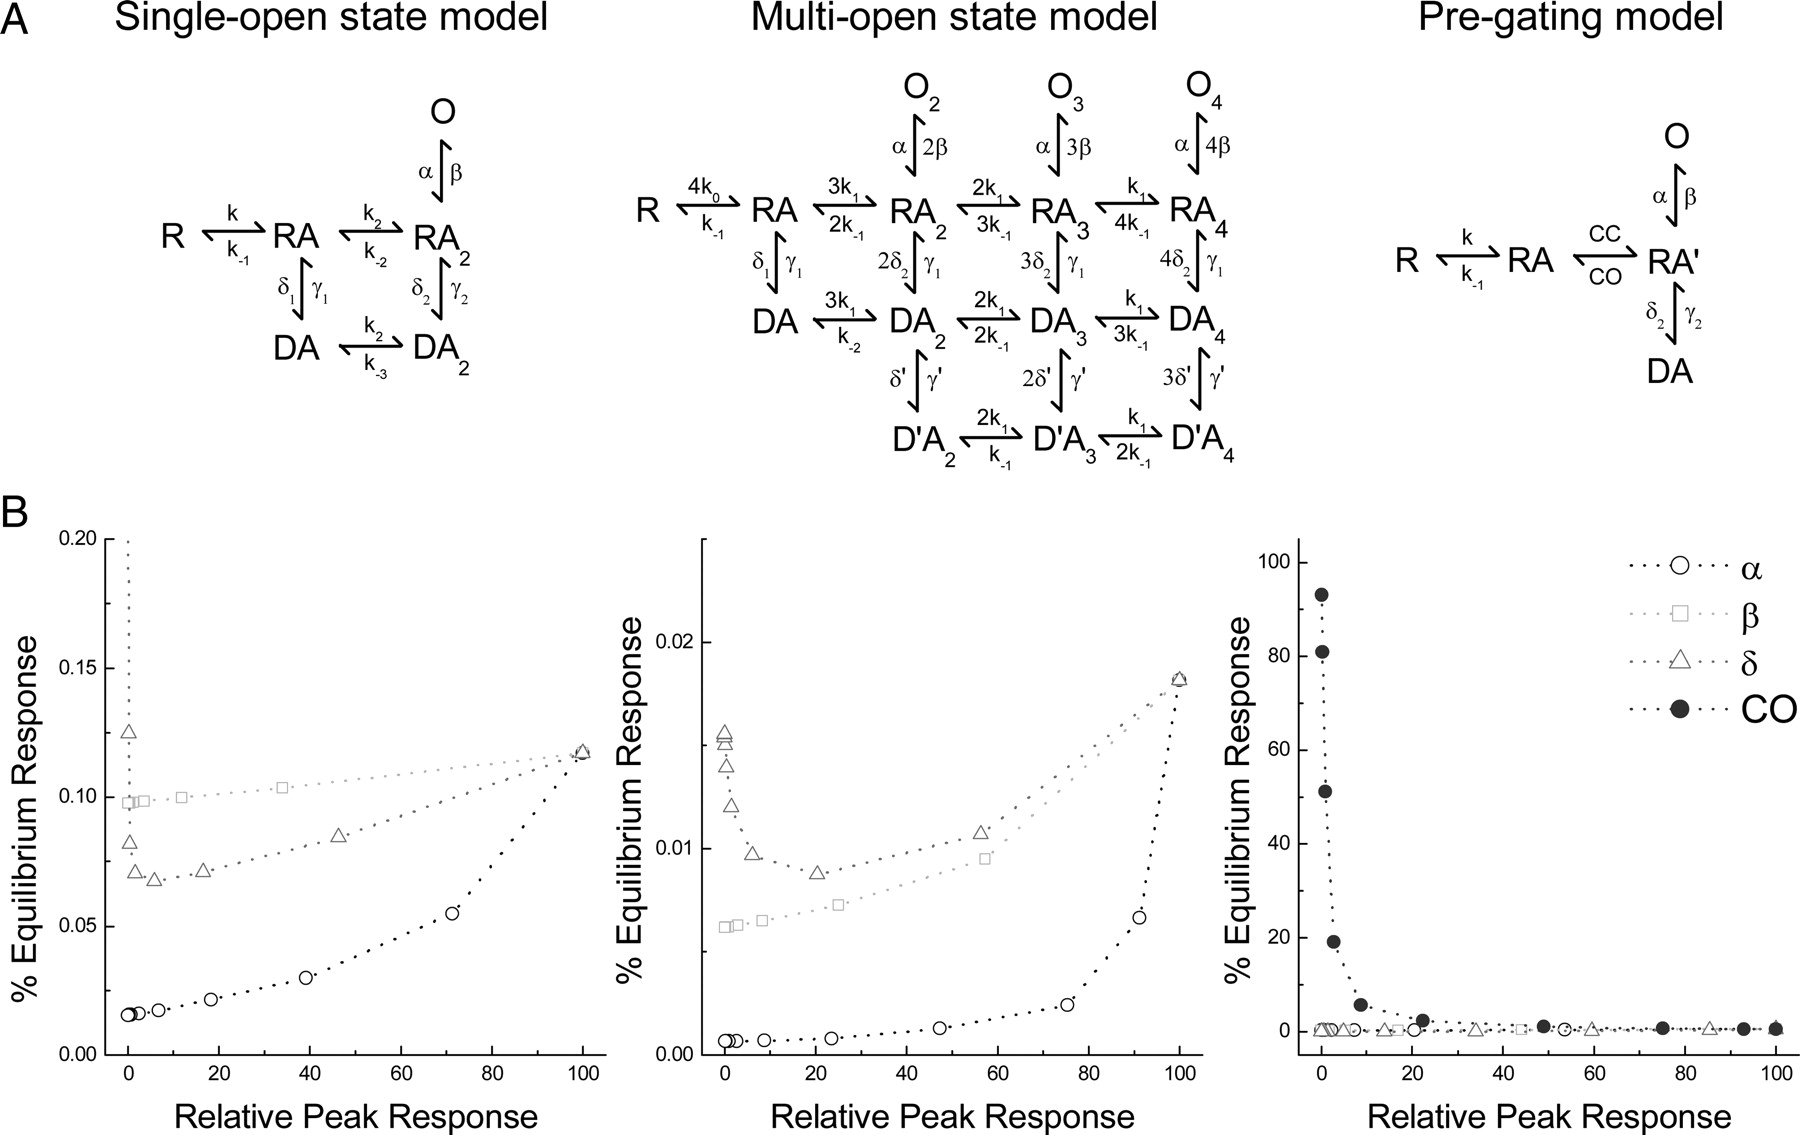
- Figure 8.
The equilibrium/peak relationship is reproduced by reducing the stability of the closed-bound state. A, Structures of the kinetic schemes from Bowie et al. (1998) (left), Perrais et al. (2009) (middle), and Zhang et al. (2008) (right) analyzed in B. B, Results of changing a single parameter (either α, β, δ, or CO) on the relationship between peak and equilibrium activation for the above models. Only alterations to CO reproduced the relationship.


Tables
Agonist Ion Number Relative peak τfast % Equilibrium Glu (10 mm) NaCl 13 100 4.9 ± 0.2 0.31 ± 0.04 - NO3 10 100 2.2 ± 0.1 1.1 ± 0.2 - I 4 100 2.2 ± 0.04 0.2 ± 0.002 K - 6 100 1.2 ± 0.1 0.3 ± 0.1 Rb - 5 100 0.6 ± 0.1 0.6 ± 0.3 Cys (40 mm) NaCl 13 95.8 ± 2.5 3.0 ± 0.2 0.6 ± 0.1 - NO3 8 91.1 ± 3.4 1.4 ± 0.1 4.9 ± 0.6 - I K - 5 64.4 ± 3.8 0.8 ± 0.05 1.0 ± 0.3 Rb - 3 32.3 ± 1.6 0.5 ± 0.1 1.1 ± 0.3 KA (1 mm) NaCl 13 44.9 ± 2.2 4.8 ± 0.2 1.8 ± 0.4 - NO3 8 43.5 ± 2.2 3.5 ± 0.2 3.2 ± 1.3 - I 4 39.9 ± 2.5 4.5 ± 0.4 2.4 ± 0.4 K - 6 19.8 ± 2.6 1.7 ± 0.3 3.1 ± 0.6 Rb - 3 16.6 ± 2.0 3.2 ± 0.2 3.4 ± 1.6 AA (40 mm) NaCl 13 14.0 ± 1.9 13.2 ± 0.7 11.1 ± 1.4 - NO3 5 14.1 ± 3.3 4.7 ± 0.7 14.1 ± 3.1 - I K - 4 6.7 ± 1.4 3.8 ± 0.2 11.4 ± 4.1 Rb - 3 9.4 ± 1.8 1.0 ± 0.3 3.3 ± 1.4 Dom (50 μm) NaCl 8 15.3 ± 1.9 16.9 ± 4.5 34.8 ± 5.4 - NO3 4 15.3 ± 2.2 48.0 ± 4.4 72.2 ± 5.7 - I 4 14.1 ± 2.2 80.3 ± 9.4 K - 3 4.2 ± 0.6 53.8 ± 8.3 Rb - 3 7.6 ± 2.6 38.2 ± 3.1


