
Abstract
Alzheimer's disease (AD) in the early stages is characterized by memory impairment, which may be attributable to synaptic dysfunction. Oxidative stress, mitochondrial dysfunction, and Ca2+ dysregulation are key factors in the pathogenesis of AD, but the causal relationship between these factors and synaptic dysfunction is not clearly understood. We found that in the hippocampus of an AD mouse model (Tg2576), mitochondrial Ca2+ handling in dentate granule cells was impaired as early as the second postnatal month, and this Ca2+ dysregulation caused an impairment of post-tetanic potentiation in mossy fiber-CA3 synapses. The alteration of cellular Ca2+ clearance in Tg2576 mice is region-specific within hippocampus because in another region, CA1 pyramidal neuron, no significant difference in Ca2+ clearance was detected between wild-type and Tg2576 mice at this early stage. Impairment of mitochondrial Ca2+ uptake was associated with increased mitochondrial reactive oxygen species and depolarization of mitochondrial membrane potential. Mitochondrial dysfunctions in dentate granule cells and impairment of post-tetanic potentiation in mossy fiber-CA3 synapses were fully restored when brain slices obtained from Tg2576 were pretreated with antioxidant, suggesting that mitochondrial oxidative stress initiates other dysfunctions. Reversibility of early dysfunctions by antioxidants at the preclinical stage of AD highlights the importance of early diagnosis and antioxidant therapy to delay or prevent the disease processes.
Introduction
Alzheimer's disease (AD) is the most common neurodegenerative disease, characterized by progressive memory impairment and accumulation of extracellular amyloid plaques along with intraneuronal neurofibrillary tangles. Since the earliest clinical symptom characteristic of AD is a pure impairment of memory, it has been proposed that AD begins with subtle alteration of hippocampal synaptic efficacy before frank neuronal degeneration (Selkoe, 2002). Cellular dysfunctions such as mitochondrial dysfunction (Du et al., 2008; Moreira et al., 2010), increased oxidative stress (Smith et al., 1996; Beal, 2005), and dysregulation of Ca2+ homeostasis (Tu et al., 2006; Bezprozvanny and Mattson, 2008) are associated with the pathogenesis of AD. Despite numerous studies, it is still elusive which is, indeed, the earliest cellular event causing subsequent neuronal dysfunctions specific to AD. To gain mechanistic insight into the pathogenesis of AD and to develop therapeutic strategies for preventing disease progression, it is critical to investigate early functional changes at the preclinical, and possibly reversible, stage of the disease.
The amyloid β protein (Aβ) is believed to be a common initiating factor in AD (Hardy and Selkoe, 2002; Tanzi and Bertram, 2005). The relationship between Aβ and Ca2+ dysregulation has been widely investigated (Mattson et al., 1992; Demuro et al., 2005), but it is still unclear whether overproduction of Aβ in vivo can indeed cause Ca2+ dysregulation, and if so, what the mechanism is. Most of the previous studies mainly focused on the mechanisms of Ca2+ overload leading to cell death, but failed to uncover AD-specific features of the Ca2+ dysregulation. Considering that Ca2+ homeostasis is achieved by the balance between the multitude of Ca2+ influx/releasing mechanisms (Ca2+ channels) and Ca2+ clearance mechanisms (pumps and exchangers), a careful quantitative analysis of each mechanism is necessary to identify subtle alterations that may occur at the early stage of AD pathogenesis. More importantly, Aβ is also known to cause various forms of synaptic dysfunction (Walsh et al., 2002; Palop et al., 2007; Shankar et al., 2008; He et al., 2009; Witton et al., 2010), but causal relationship between Aβ-induced synaptic dysfunction and Ca2+ dysregulation is not clearly understood.
Here, using an amyloid precursor protein (APP) transgenic mouse model (Tg2576) at the age of 1–2 months, we investigated the Ca2+ dynamics of hippocampal neurons and discovered that a selective impairment of mitochondrial Ca2+ uptake in dentate granule cells (GCs) is the earliest sign of Ca2+ dysregulation. We also demonstrate that the impaired mitochondrial Ca2+ handling is attributable to mitochondrial dysfunction that involves increased reactive oxygen species (ROS) production, and this leads to the impairment of short-term plasticity in the mossy fiber-CA3 synapse. Furthermore, antioxidant pretreatment effectively restored synaptic plasticity as well as mitochondrial Ca2+ handling. Our data provide the first evidence of a causal link between mitochondrial dysfunction and impaired synaptic plasticity in AD pathogenesis at the early preclinical stage.
Materials and Methods
Preparation of brain slices.
Brain slices were prepared from male Tg2576 transgenic mice and their littermate wild-type control mice aged from 1 to 2 months old. Mice were killed by decapitation after being anesthetized with pentobarbital sodium, and the whole brain was immediately removed from the skull and chilled in artificial CSF at 4°C. Transverse hippocampal slices (300 μm thick) were prepared using a vibratome (VT1200S, Leica). For functional studies, slices were incubated at 35°C for 30 min and thereafter maintained at 32°C until in situ slice patch recordings and fluorescence microscopy. Hippocampal granule cells of dentate gyrus were visualized using an upright microscope equipped with differential interference contrast (DIC) optics (BX51WI, Olympus). All experiments procedures were conducted in accordance with the guidelines of the University Committee on Animal Resource in Seoul National University (Approval No. SNU-090115–7).
Preparation of oligomeric Aβ1–42 and Aβ1–40.
Oligomeric Aβ1–42 and Aβ1–40 were prepared as previously described (Hong et al., 2009). To prepare the oligomer, Aβ1–42 or Aβ1–40 peptides were incubated with PBS at 4°C for 24 h. The resulting oligomers were verified by atomic force microscopy (AFM, PARK Systems) as previously described (Maezawa et al., 2006). For AFM analysis, peptide solutions were aliquoted and immediately spotted onto freshly cleaved micas. The micas were rinsed with water twice and dried in the air. AFM images were examined to characterize the size of oligomeric Aβ. It showed globular aggregate structures between 5 and 15 nm in size.
Measurement of Aβ content.
Extracts from different brain regions were measured by a sandwich ELISA as described previously (Cho et al., 2009). Briefly, cortical region, dentate gyrus (DG), and hippocampus without dentate gyrus [Hippo(-DG)] were lysed by sonication in 70% formic acid solution. After centrifugation, formic acid-extracts were neutralized initially by 1:20 dilution into 1 m Tris phosphate buffer, pH 11, and then diluted as necessary in EIA buffer (1% BSA, 0.05% Tween 20 in PBS). Aβ levels were measured by a sandwich ELISA kit using an anti-Aβ1–40 or -Aβ1–42 antibody, according to the manufacturer's instructions (Immuno-Biological Laboratories). Using the wet weight of brain in the original homogenate, the final values of Aβ in the brain were expressed as nanogram per milligram wet weight.
Electrophysiological recordings.
Whole-cell patch-clamp techniques were used for introducing Ca2+-indicator dye into the soma of hippocampal neurons and also for applying depolarizing pulses. The pipette solution contained the following (in mm): 143 K-gluconate, 7 KCl, 15 HEPES, 4 MgATP, 0.3 NaGTP, 4 Na-ascorbate, and 0.1 EGTA/or Fura-2 pentapotassium salt with the pH adjusted to 7.3 with KOH. The bath solution (or aCSF) for the control experiments contained the following (in mm): 125 NaCl, 25 NaHCO3, 2.5 KCl, 1.25 NaH2PO4, 2 CaCl2, 1 MgCl2, 20 glucose, 1.2 pyruvate, and 0.4 Na-ascorbate, pH 7.4 when saturated with carbogen (95% O2 and 5% CO2). The superfusion rate of bathing solution and the volume of the recording chamber for slices were 2.2 ml/min and 1.2 ml, respectively. Patch pipettes with a tip resistance of 5–6 MΩ were used. The series resistance (Rs) after establishing whole-cell configuration was between 10 and 15 MΩ. Electrophysiological recordings were made in somata with EPC-8 amplifier (HEKA). Experiments were performed at 32 ± 1°C. All chemicals were obtained from Sigma, except Fura-2 pentapotassium salt and MitoSOX Red (Invitrogen). EPSCs at mossy fiber (MF) synapses were recorded from CA3 pyramidal cells (CA3-PCs) in a whole-cell mode at a holding potential of −60 mV. Patch pipettes (2–4 MΩ) were filled with an internal solution containing the following (in mm): 143 K-gluconate, 7 KCl, 15 HEPES, 4 MgATP, 0.3 NaGTP, and 4 Na-ascorbate, 0.1 EGTA at pH 7.3 (adjusted with KOH). Synaptic responses were evoked by extracellular stimulation (100 μs duration; 10–25 μA) via a stimulator (Stimulus Isolator A360; WPI) connected to a patch electrode filled with aCSF solution, and placed in stratum lucidum of CA3 field. The stimulus intensity was adjusted such that EPSC amplitude is in the range between 100 pA and 300 pA. After 10–15 min of stabilization from the break-in, EPSCs were recorded initially by 0.2 Hz stimulation for 3–5 min followed by high-frequency stimulation (HFS; 25 Hz, 5 s) to induce a post-tetanic potentiation (PTP). EPSC recordings with <20% series resistance change were included for data analysis. At the end of each experiment, we examined the effect of 2 μm DCG4, a group II mGluR agonist, to confirm that we had studied MF synapses.
Cytosolic Ca2+ measurements.
The procedures for cytosolic Ca2+ measurement in slices have been previously described in detail (Lee et al., 2007, 2009). Briefly, we measured [Ca2+]i in somata of hippocampal GCs and CA1 PCs using Fura-2 pentapotassium salt introduced by a patch pipette. Fluorescence imaging was performed with a 60× water-immersion objective (NA 0.9, LUMPlanFl, Olympus), an air-cooled slow-scan CCD camera (SensiCam, PCO) and a monochromator (Polychrome-IV, TILL-Photonics), which were controlled by a personal computer and ITC-18, running a custom-made software programmed with Microsoft Visual C++ (version 6.0; CCDLabo1.2). To increase the time resolution and minimize photo-bleaching, we adopted the single-wavelength protocol for Ca2+-imaging of the slices. Images were taken at 20 Hz with single wavelength excitation at 380 nm (F380). The isosbestic fluorescence values (Fiso) at 360 nm were linearly interpolated between points just before and after the period of excitation at 380 nm. The ratio r = Fiso/F380 was converted to [Ca2+] values using the following equation:
 Calibration parameters were determined using the in-cell calibration method. Rmin and Rmax were measured in the somata of granule cells which were intracellularly perfused with a pipette solution containing 10 mm BAPTA or 10 mm CaCl2, respectively. The ratio at intermediate [Ca2+]i was measured using a pipette solution containing 10 mm BAPTA and 5 mm CaCl2 ([Ca2+]i ≈ 216 nm). The effective dissociation constant of fura-2 (Keff) was calculated by measuring the fluorescence ratio at the intermediate [Ca2+]i and by rearranging Equation 1 for Keff. Typical values for Rmin, Rmax, and Keff were 0.89, 4.86, and 1.48 μm, respectively.
Calculation of the Ca2+ decay rate constant from a biexponential function.
We estimated the calcium clearance of a cell from the decay phase of Ca2+ transients (CaTs; Lee et al., 2009). The CaTs recorded in the somata of the GCs were best fitted with a biexponential function:
 The Ca2+-decay rate at the peak (d[Ca2+](t)/dt|t = 0, denoted by rt = 0) of the CaT which is fitted with Equation 2 can be estimated from the following equation:
 Because rt = 0 highly depends on the amplitude of CaTs (Δ[Ca2+]peak), it cannot be used as a parameter for statistical comparison of the Ca2+ clearance between two CaTs with different peak amplitudes. Therefore, we obtained a Ca2+-decay rate constant at the peak of a CaT (λt = 0) as follows:
 Previously, we demonstrated that this term is relatively constant when Δ[Ca2+]peak is >0.8 μm (Lee et al., 2009). Therefore, we used λt = 0 obtained from the CaTs that have an amplitude within the range of 0.8–1.2 μm as a parameter for representing Ca2+ clearance of a cell, and used this term for the statistical analysis. The difference between the Ca2+ clearance under control conditions and that in the presence of an inhibitor of X was regarded as the contribution made by X. Since Li+ enhances GABAergic activity in dentate GCs, choline-Cl was used as a substitute for extracellular Na+ to study Na/Ca exchange activity. The PMCA-mediated Ca2+ clearance was calculated from the difference of thapsigargin (TG) alone and TG + 5(6)-carboxyeosin diacetate (CE) because CE alone partially blocks SERCA in addition to PMCA inhibition.
Measurement of mitochondrial superoxide level and membrane potential.
The mitochondrial superoxide levels and mitochondrial membrane potential (ΔΨm) were assessed by the fluorescence of MitoSOX Red (Invitrogen) and tetramethylrhodamine ethyl ester perchlorate (TMRE; Invitrogen), respectively. Hippocampal slices were loaded with 200 nm MitoSOX Red for 30 min or 200 nm TMRE for 40 min in the dark at 37°C while carbogen was continuously supplied in the bath solution. MitoSOX Red and TMRE were excited by 510 and 540 nm of monochromatic light, respectively. A cooled CCD camera was used to collect emission fluorescence through the 624/40 nm bandpass emission filter. Time-lapse TMRE fluorescence images were captured in every 100 ms with an exposure time of 20 ms.
Statistical analysis.
Data were analyzed with IgorPro (Version 4.1; Wave-Metrics) and are presented as the mean ± SEM. n indicates the number of cells. The statistical significances were evaluated using Student's t test.
Results
Calcium clearance is impaired in Tg2576 granule cells
We investigated Ca2+ dynamics of the hippocampal neurons from mice aged 1–2 months by imaging the fluorescence of fura-2 in the soma, which was introduced at a concentration of 100 μm via a whole-cell patch pipette. CaTs were evoked by applying depolarizing pulses (from −70 to 0 mV) of various durations from 10 to 200 ms under voltage-clamp conditions. In GCs of the dentate gyrus, the decay kinetics of CaTs showed a significant difference between the litter-mate wild-type (WT, blue traces) and Tg2576 mice (red traces; Fig. 1). Because GCs in the same brain slice display heterogeneous stages of maturation and Ca2+ dynamics are regulated developmentally, we confined our analysis to mature GCs, which exhibit typical electrophysiological criteria: low input resistance and high threshold current for an action potential (Lee et al., 2009). Figure 1A shows representative sets of CaTs recorded from a mature WT GC and a Tg2576 GC. While the resting calcium level ([Ca2+]rest: WT, 64.5 ± 3.2 nm; Tg2576, 72.2 ± 2.5 nm) and the peak amplitude of CaTs (Δ[Ca2+]peak, Fig. 1B) are not significantly different between WT GCs and Tg2576 GCs, the decay phase of the CaTs was significantly slowed in Tg2576 GCs (Fig. 1A). We fitted the decay phase of each CaT with a biexponential function and estimated the Ca2+ decay rate (d[Ca2+]i/dt|t=0 or rt=0) at the peak of each CaT according to Equation 3. Because the Ca2+ decay rate depends on the cytosolic Ca2+ level ([Ca2+]i), it was plotted as a function of Δ[Ca2+]peak (inset, Fig. 1A). The composite data obtained from WT (blue circles) and Tg2576 mice (red circles) were compared in Figure 1C, showing that the difference in the Ca2+ decay rate between WT GCs and Tg2576 GCs became evident in the range of Δ[Ca2+]peak > 0.5 μm. We obtained the Ca2+ decay rate constant (λt = 0) by normalizing the Ca2+ decay rate to its peak amplitude (Eq. 4) and plotted it against Δ[Ca2+]peak (Fig. 1D). Values for λt = 0increased as [Ca2+]i increased at a low range of Δ[Ca2+]peak, but became fairly independent of the Δ[Ca2+]peak when the Δ[Ca2+]peak was > 0.8 μm (Fig. 1D). Since CaTs evoked by a 200 ms depolarizing pulse were > 0.8 μm, we defined “Ca2+ clearance (CCa)” as the λt = 0 value obtained from CaTs evoked by a 200 ms depolarizing pulse, and used this term for the statistical analysis. The mean value for CCa was significantly lower in the Tg2576 GCs (1.407 ± 0.027 s−1, n = 36) than in the WT GCs (2.035 ± 0.028 s−1, n = 29, p < 0.01; Fig. 1E), indicating that the impairment of Ca2+ clearance is the earliest sign of Ca2+ dysregulation ever shown in Tg2576 mice.

Ca2+ clearance in the granule cells of the wild-type and Tg2576 mice. A, Representative CaTs in the soma of a GC of the hippocampal dentate gyrus from wild-type (WT, blue) and Tg2576 (red) mice. CaTs were evoked by a depolarizing step pulse of various durations (10, 30, 50, 100, 150, and 200 ms; from −70 to 0 mV). The insets are plots of [Ca2+] decay rates (d[Ca2+]i/dt) at the peak of each CaTs calculated from Equation 3 against the amplitudes of the CaT (Δ[Ca2+]peak). The largest CaTs in each set of CaTs from WT and Tg2576 are superimposed in the rightmost image. B, The peak amplitudes of CaTs (Δ[Ca2+]peak) induced by a depolarizing step of various durations are shown for WT (blue circle) and Tg2576 (red circle). C, A summary graph for Ca2+ decay rates as a function of Δ[Ca2+]peak. Numbers in parentheses are the numbers of neurons/mice studied. D, Ca2+ decay rate constant (λt = 0) as a function of Δ[Ca2+]peak. λt = 0 was calculated by dividing each value for Ca2+ decay rate shown in C by corresponding Δ[Ca2+]peak according to Equation 4. E, Mean values for Ca2+ clearance (CCa) obtained from WT (blue) and Tg2576 (red). CCa is defined as the λt = 0 value at Δ[Ca2+]peak > 0.8 μm, and typically estimated from a CaT evoked by a 200 ms step pulse. n, number of cells tested. Mean ± SEM. **p < 0.01.
Mitochondrial dysfunction underlies the impaired Ca2+ clearance in the Tg2576 GCs
The Ca2+ clearance of GCs is attributable to Na/Ca exchanger (NCX), sarcoendoplasmic reticulum Ca2+-ATPase (SERCA), plasma membrane Ca2+-ATPase (PMCA), and mitochondria (Lee et al., 2009). To understand which Ca2+ clearance mechanisms are impaired in the Tg2576 mice, we estimated the contributions of each mechanism to the decay phase of CaTs by comparing Ca2+ clearance before and after inhibition of a given mechanism (Fig. 2). To inhibit the forward mode of NCX, extracellular Na+ concentration ([Na+]o) was reduced to 26 mm by replacing 125 mm NaCl with equimolar choline-Cl. Under this condition, resting [Ca2+]i and Δ[Ca2+]peak were unchanged, confirming that Ca2+ influx through the reverse mode of NCX was not activated. SERCA and mitochondrial Ca2+ uptake were inhibited by thapsigargin (TG, 2 μm) and Ru360 (20 μm), respectively. The role of PMCA in Ca2+ clearance was assessed using 5(6)-carboxyeosin diacetate (CE, 40 μm). Because CE can partially inhibit SERCA, we assessed the effects of CE in slices pretreated with TG for 10 min. We analyzed d[Ca2+]i/dt|t = 0 at various Δ[Ca2+]peak in the presence of each specific inhibitor (Fig. 2A), and the results are superimposed with the control values shown in Figure 1C. Figure 2B shows representative traces of CaTs after inhibiting NCX, SERCA, SERCA + PMCA, or mitochondrial Ca2+ uptake (black or gray traces), which were superimposed with control CaTs obtained from the WT GCs and the Tg2567 GCs (blue or red broken line). The mean values for CCa estimated before and after inhibition of each mechanism are presented in the bottom of each trace (Fig. 2B). The decrement in CCa (ΔCCa) caused by inhibition of each mechanism was regarded as the contribution of that mechanism to the Ca2+ clearance (Fig. 2C). In WT GCs, NCX, mitochondria, SERCA, and PMCA contributed to the Ca2+ clearance in the decreasing order, which is consistent with the previous report (Lee et al., 2009). Despite reduced Ca2+ clearance in Tg2576 GCs, the ΔCCa caused by low [Na+]o, thapsigargin and CE in Tg2576 GCs were not significantly different from those in WT GCs. However, the effect of Ru360 on Ca2+ clearance was negligible in the Tg2576 GCs, indicating that the contribution of mitochondria was significantly lower in Tg2576 GCs (Fig. 2C). These results indicate that the function of mitochondrial Ca2+ uptake is selectively impaired in the Tg2576 GCs, resulting in the reduced Ca2+ clearance.

Contributions of specific Ca2+ clearance mechanisms in wild-type and Tg2576 GCs. A, Analysis of [Ca2+]i decay rate (d[Ca2+]i/dt) before and after inhibition of specific calcium clearance mechanism. The values of Ca2+ decay rate at the peak are plotted against the corresponding Δ[Ca2+]peak in WT (top) and Tg2576 (bottom) GCs. CaTs with various Δ[Ca2+]peak were evoked by a depolarization pulse of various durations from 10 to 200 ms. NCX was inhibited by lowering [Na+]O to 26 mm (low [Na+]O, left, black). Extracellular 125 mm NaCl (Ctrl) was replaced with equimolar choline-Cl. SERCA pump was inhibited by pretreatment of thapsigargin (TG, 2 μm, middle, black). Since the PMCA inhibitor, 5(6)-carboxyeosin diacetate (CE, 40 μm), also partially inhibits SERCA, the additional slow-down of Ca2+ decay rate by CE in the presence of TG is attributable to PMCA activity (TG + CE, middle, gray). Mitochondrial Ca2+ uptake is inhibited by addition of 20 μm Ru360 in the patch pipette (right, black). Control Ca2+ decay rates before various inhibitors are plotted in WT (top, blue) and Tg2576 mice (bottom, red). B, Representative CaTs recorded before (WT, blue dotted line; Tg2576, red broken line) and after inhibition of specific Ca2+ clearance mechanisms using low [Na+]O (left, black), TG (middle, black), TG + CE (middle, gray) or Ru360 (right, black) in WT and Tg2576. Scale bars indicate 200 nm [Ca2+]i and 2 s. Mean values for Ca2+ clearance (CCa) are summarized in the bar graphs on the bottom of each traces (blue bars, WT; red bars, Tg2576). Open circles indicate individual values for CCa, and the data obtained from the same cell before and after inhibition of specific Ca2+ clearance mechanisms are connected with lines. C, The decrements of CCa (ΔCCa) caused by inhibition of each Ca2+ clearance mechanism. The further decrease of CCa caused by CE in the presence of TG was denoted as “TG + CE.” Because Ru360 is impermeable to the cell membrane, we compared its effect between different cells into which Ru360 or its vehicle was introduced via a whole-cell patch pipette. The mean and SE of estimates for decrement of CCa caused by Ru360 was calculated from 50 bootstrap samples obtained by randomly sampling with replacement from original data (p < 0.01). n, the number of CaTs studied in different cells. **p < 0.01; NS, not significantly different. Error bars indicate SEM.
The hippocampus is subdivided into three main regions: the dentate gyrus, CA1, and CA3 fields. The principal cells in each regions show distinctive characteristic in their electrical properties and Ca2+ dynamics. Region-specific disturbances are also reported in age-dependent changes (Burger, 2010). To examine whether selective impairment of mitochondrial Ca2+ uptake in Tg2576 is specific to GCs in dentate gyrus, we conducted the same series of experiments in CA1 pyramidal cells (PCs; Fig. 3). Unlike dentate GCs, the amplitude and the kinetics of CaTs did not show any significant differences between wild-type (WT) and Tg2576 mice in CA1 PCs (Fig. 3A). Furthermore, Ca2+ decay rate and Ca2+ clearance were unaffected by Ru360, indicating that the mitochondrial contribution to Ca2+ clearance is negligible in the CA1 PCs (Fig. 3B,C). These results support the idea that a significant contribution of mitochondria to Ca2+ clearance is a unique feature of dentate GCs, which makes GCs susceptible to mitochondrial impairment.

Ca2+ clearance in CA1 pyramidal cells of wild-type and Tg2576 mice. A, CaTs in the soma of PCs of CA1 hippocampus evoked by a depolarizing step pulse (from −70 to 0 mV) of various durations (10, 30, 50, 100, and 150 ms) in wild-type (WT, blue), Tg2576 (red), and WT + Ru360 (green). Inset, a plot of decay rates at each peak of CaTs against the corresponding Δ[Ca2+]peak. B, A summary graph for Ca2+ decay rates as a function of Δ[Ca2+]peak. Numbers in parentheses are the numbers of neurons/mice studied. C, Ca2+ clearance (CCa) as a function of Δ[Ca2+]peak. NS, not significantly different. Error bars indicate SEM.
Pretreatment with Aβ1–42 decreases Ca2+ clearance specifically in dentate GCs
Aβ is believed to be the most important pathogenic factor in AD. Before we investigated the involvement of Aβ in the impairment of Ca2+ clearance in Tg2576 mice, we first examined whether the measurable amount of Aβ is produced at the age of Tg2576 mice used in this study. Among various species of Aβ, Aβ1–40 is most abundant and Aβ1–42 is most toxic (Mucke et al., 2000; Walsh and Selkoe, 2007). We measured the amount of Aβ1–40 and Aβ1–42 in different regions of brain slices of the Tg2576 mice using ELISA assay (Fig. 4C). Both Aβ1–40 and Aβ1–42 were detected in cerebral cortex (Ctx) and hippocampus, with no significant difference among the different regions, except that the level of Aβ1–42 in the dentate gyrus (DG) was higher compared with that in other regions of the hippocampus [Hippo(-DG)] or in the cortex.

Effects of exogenous Aβ on Ca2+ clearance of dentate GCs and CA1 PCs in wild-type mice (A, B), and the regional differences in production of endogenous Aβ in Tg2576 mice (C). A, B, Left, Representative CaTs evoked by a short depolarization in dentate GCs (A) or CA1 PCs (B) after 60 min pretreatment of 1 μm Aβ1–42. Inset, a plot of Ca2+ decay rate at the peak of each CaT as a function of corresponding Δ[Ca2+]peak. The duration of a short depolarizing step pulse from −70 to 0 mV was varied between 10 and 150 ms to obtain CaTs of different amplitude. Scale bars: 200 nm and 2 s. Middle, a summary graph of Ca2+ decay rate against Δ[Ca2+]peak in WT control (blue), WT+Aβ1–40 (gray), and WT+Aβ1–42 (black symbols). Right, Ca2+ clearance (CCa) in WT (blue), WT+Aβ1–40 (gray), and WT+Aβ1–42 (black). The CCa estimates were obtained by dividing Ca2+ decay rates shown in the middle by Δ[Ca2+]peak, according to Equation 4. C, Contents of Aβ1–40 and Aβ1–42 in the cortical and hippocampal regions from 1- to 2-month-old Tg2576 mice. Aβ levels were measured using antibodies against Aβ1–40 (left) or Aβ1–42 (right). Aβ contents are expressed as a unit of nanogram per milligram wet weight (n = 3 mice). Ctx, cortex; Hippo, hippocampus; DG, dentate gyrus. Hippo(-DG) denotes the hippocampus region except dentate gyrus. Mean ± SEM; **p < 0.01; NS, not significantly different. Error bars indicate SEM.
We then examined whether impairment of the Ca2+ clearance observed in the Tg2576 GCs could be mimicked by exogenous application of oligomeric Aβ1–42 or Aβ1–40 to the WT GCs. We used a relatively high concentration (1 μm) to minimize the incubation time. After an hour incubation in the Aβ1–42-containing aCSF, the hippocampal slices from the WT mice exhibited slower decay phases of the CaTs than the un-treated controls (Fig. 4A) whereas the [Ca2+]rest (WT, 64.5 ± 3.2 nm vs WT + Aβ, 74.4 ± 3.4 nm) and Δ[Ca2+]peak (WT, 1.26 ± 0.14 nm vs WT + Aβ1–42, 1.28 ± 0.10 nm) were not significantly different. The mean value for CCa in Aβ1–42-treated WT GCs was 1.37 ± 0.03 s−1 (n = 17), which is significantly slower than that of un-treated WT GCs (p < 0.01) but comparable to the value obtained from Tg2576 GCs. In contrast, pretreatment with Aβ1–40 did not affect Ca2+ clearance, supporting a key role of oligomeric Aβ1–42 in the impaired Ca2+ clearance observed in the Tg2576 GCs.
We showed that Ca2+ clearance in CA1 PCs is not affected in Tg2576 (Fig. 3), and suggested that a negligible contribution of mitochondria to the Ca2+ clearance in CA1 PCs makes CA1 PCs not susceptible to mitochondrial impairment induced in Tg2576. However, it may also be possible that a lower level of Aβ1–42 in CA1 region is responsible for the normal Ca2+ clearance in Tg2576 CA1 pyramidal neurons. To examine this possibility, we examined the effect of exogenous Aβ1–42 on Ca2+ clearance in CA1 PCs. Unlike the effect on GCs (Fig. 4A), there was no significant effect of Aβ1–42 on Ca2+ clearance in CA1 PCs (Fig. 4B). These results support the idea that Aβ1–42 under this experimental condition specifically induces the impairment of mitochondrial Ca2+ uptake, and thus does not affect Ca2+ clearance of CA1 PCs in which mitochondrial contribution is negligible.
Mitochondria in the Tg2576 GCs are under oxidative stress and become depolarized
What is the underlying mechanism of the impaired mitochondrial Ca2+ uptake in the Tg2576 GCs? To determine whether mitochondrial dysfunction underlies the impairment of Ca2+ uptake in Tg2576, mitochondrial ROS generation and membrane potential (ΔΨm) were evaluated in the dentate GCs using MitoSOX Red and TMRE, respectively (Fig. 5). Whereas the cell morphology in DIC images was not changed, MitoSOX Red fluorescence was significantly increased in the Tg2576 GCs compared with that of the WT GCs, which is indicative of the increased mitochondrial superoxide level in the Tg2576 GCs (Fig. 5A). Furthermore, the TMRE fluorescence image indicates that the ΔΨm of the Tg2576 GCs is partially depolarized compared with that of the WT GCs (Fig. 5B). Figure 5Bb shows recordings of TMRE fluorescence intensity of hot spots, in-focused mitochondria, indicated by arrowheads in TMRE fluorescence images, before and after addition of 1 μm carbonylcyanide p-trifluoromethoxyphenylhydrazone (FCCP). A hot spot is defined as a pixel, the brightness of which is higher than two SDs of the Gaussian fit to the intensity histogram of the ROI drawn over the focused GC layer. The mean FCCP-sensitive TMRE fluorescence (ΔFTMRE) was significantly lower in the Tg2576 GCs (29 mitochondria from 5 mice) compared with that of the WT GCs (24 mitochondria from 3 mice; Fig. 5Bc). Interestingly, the TMRE fluorescence of the individual hot spot in the WT GCs showed a small flickering, a brief drop of the fluorescence intensity, reflecting a brief and reversible depolarization (Fig. 5Bb, WT). Such flickering was observed previously in cultured neurons and considered to be an indication of normal mitochondrial respiratory function (Buckman and Reynolds, 2001). However, reversible fluctuations of ΔFTMRE were rarely observed in the Tg2576 GCs.

Mitochondrial superoxide generation (A) and mitochondrial membrane potential (ΔΨm, B) probed by MitoSOX Red and TMRE, respectively, in wild-type and Tg2576 GCs. A, DIC (Aa) and MitoSOX Red (Ab) fluorescence images of the GC layer of the dentate gyrus in WT (left), Tg2576 (middle), and Tg2576+Trolox (right). The right images were taken from Tg2576 GCs after pretreatment with 500 μm Trolox for 2 h. Ac shows fluorescence intensity histograms of the MitoSOX Red fluorescence images shown in Ab (blue, WT; red, Tg2576; light blue, Tg2576+Trolox). A MitoSOX Red-positive pixel is defined as a pixel whose fluorescence intensity is higher than two SD of the control intensity profile (indicated by the vertical dashed line and shaded area on Ac). Ad summarizes the proportion of MitoSox Red-positive pixels in individual MitoSox Red images. The numbers in parentheses indicate the numbers of brain slice images/mice studied under each condition. Ba, TMRE fluorescence images of dentate gyrus GCs from WT (left), Tg2576 (middle), and Tg2576+Trolox (right). Bb, Representative traces of TMRE fluorescence measured at hot spots, in-focused mitochondria indicated by arrows in the TMRE images (Ba) from the GCs of WT (blue), Tg2576 (red), and Tg2576+Trolox (light blue). Black traces are TMRE intensities after addition of 1 μm FCCP. Bc, Summary bar graph for the mean FCCP-sensitive TMRE fluorescence (ΔFTMRE). The numbers in parentheses are the numbers of hot spots/mice studied under each condition. Scale bars: 20 μm; *p < 0.05; **p < 0.01. Error bars indicate SEM.
Mitochondrial dysfunction can be restored by antioxidant treatment
To further determine whether the increased mitochondrial ROS generation is causally related to mitochondrial dysfunction and Ca2+ dysregulation in the Tg2576 mice, we examined whether the antioxidant, 6-Hydroxy-2,5,7,8-tetramethylchromane-2-carboxylic acid (Trolox), can restore ΔΨm and Ca2+ clearance. Preincubation of the Tg2576 GCs in the aCSF containing 500 μm Trolox reduced MitoSOX Red fluorescence (Fig. 5Ab-3), suggesting its effective scavenging of mitochondrial ROS. Under this condition, ΔFTMRE was fully restored to the level of the WT GCs (Fig. 5B). Furthermore, Trolox also restored the Ca2+ clearance in the Tg2576 GCs (Fig. 6). The mean value for CCa in the Tg2576 (1.407 ± 0.027 s−1, n = 36) was significantly increased by the Trolox treatment (2.187 ± 0.078 s−1, n = 9, P < 0.01), becoming comparable to the value for the WT GCs (2.035 ± 0.028 s−1, n = 29, Horizontal dotted line, Fig. 6C). To exclude the possibility that Trolox nonspecifically affects Ca2+ clearance, we confirmed that the Trolox effect in Tg2576 GCs was abolished in the presence of Ru360. In addition, we confirmed that Trolox did not affect Ca2+ clearance in WT GCs (1.908 ± 0.046 s−1, n = 3), further supporting that the Trolox effect in Tg2576 GCs is indeed attributable to rescuing mitochondrial dysfunction. Together, restoration of the ΔΨm and Ca2+ clearance by Trolox in the Tg2576 GCs is consistent with the idea that the increased mitochondrial ROS in the Tg2576 GCs is responsible for the depolarization of ΔΨm and impaired mitochondrial Ca2+ clearance.
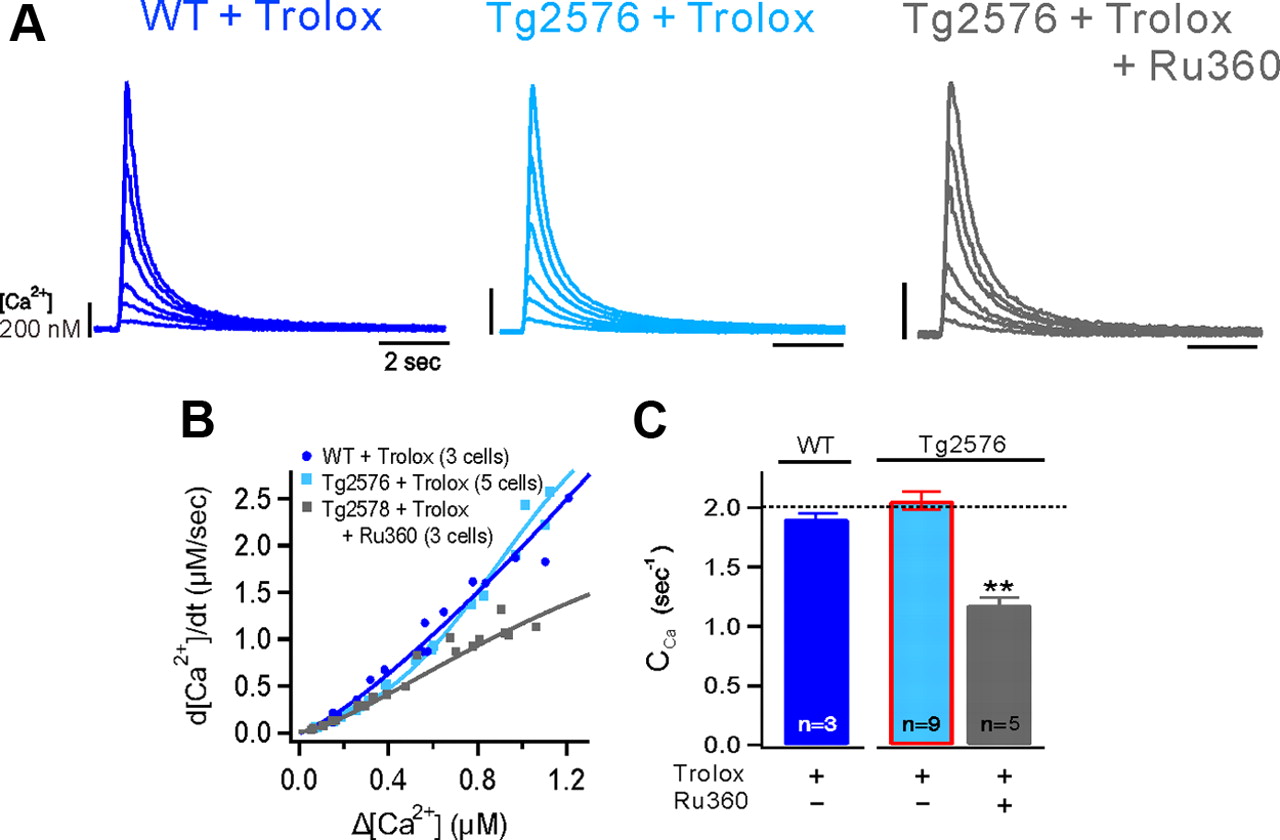
Effects of pretreatment with Trolox on Ca2+ clearance in GCs from wild-type and Tg2576 mice. A, The CaTs in the soma of a GC from WT (left) and Tg2576 (middle) mice after pretreatment with Trolox (500 μm for 2 h). Right, The CaTs show the effects of Ru360 on the latter. CaTs were evoked by a depolarizing step pulse of various durations. B, A summary graph for CA2+ decay rates as a function of Δ[Ca2+]peak from GCs of WT+Trolox (blue), TG+Trolox (light blue), and TG+Trolox+Ru360 (gray). C, Mean values for Ca2+ clearance (CCa) in each condition. The horizontal dotted line represents the mean value of Ca2+ clearance in the WT GCs. Scale bars: 2 s and 200 nm; **p < 0.01; n, number of cells. Error bars indicate SEM.
Mitochondrial dysfunction underlies the synaptic dysfunction in the Tg2576 GCs
Previously, we reported that presynaptic mitochondrial Ca2+ uptake during HFS and subsequent post-tetanic Ca2+ release from mitochondria are responsible for presynaptic residual calcium (Cares) which mediates PTP at the synapses made by large terminals of MF, an axon fiber of hippocampal GCs (Lee et al., 2007a). Given that mitochondrial Ca2+ uptake is impaired in the Tg2576 GCs, we hypothesized that MF axon terminals of Tg2576 mice exhibit lower post-tetanic Cares, and thus the MF-CA3 synapses of Tg2576 show lower PTP compared with those of the WT mice. To examine this hypothesis, we recorded the baseline EPSC amplitudes for 3 min at the MF-CA3 synapse, and then stimulated MFs at 25 Hz for 5 s to induce PTP. A representative time course of the change in normalized EPSC amplitudes recorded from the WT CA3-PCs is shown in Figure 7A. To assess the mitochondrial dependence of PTP, we used 2 μm of tetraphenylphosphonium (TPP+) instead of Ru360, because the effect of Ru360 cannot be evaluated in the same synapse due to its low permeability. TPP+ is well permeable through the cell membrane and specifically inhibits post-tetanic mitochondrial Ca2+ release (Lee et al., 2007a, 2008). Consistent with our previous reports, PTP of EPSCs induced in the WT CA3-PCs was substantially reduced by 2 μm TPP+, whereas TPP+ had no significant effect on the baseline EPSC amplitude, indicating a mitochondrial contribution to PTP at the MF-CA3 synapses (Fig. 7A). When PTP was induced by the same protocol at MF-CA3 synapses of the Tg2576 mice, it was significantly reduced, so that the mean magnitude of PTP under the control conditions in the Tg2576 mice was similar to that in the WT mice in the presence of TPP+ (Fig. 7B). Furthermore, PTP at the MF-CA3 synapses in the Tg2576 mice was hardly affected by TPP+ (Fig. 7B), indicating that the contribution of mitochondria-dependent Cares to PTP is negligible in the Tg2576 mice. These results are consistent with the hypothesis that impaired mitochondrial Ca2+ uptake in the Tg2576 GCs leads to the reduction of post-tetanic mitochondrial Ca2+ release, which is a key mechanism for PTP at the MF-CA3 synapses. Finally, we examined the effect of Trolox that restored mitochondrial Ca2+ uptake. After 2 h of treatment with Trolox (500 μm), PTP of MF-CA3 synapse of Tg2576 was restored to the level comparable to that in the WT mice and regained its sensitivity to TPP+ (Fig. 7C). The magnitude of PTP was quantified as the average of the first three post-tetanic EPSC amplitudes normalized to the mean baseline amplitudes, and is summarized in Figure 7D. Whereas Trolox did not affect PTP and its sensitivity to TPP+ in the WT MF synapse (Fig. 7D, squares), it restored the mitochondrial contribution to PTP at the MF-CA3 synapses of Tg2576 mice. These results imply that the restoration of PTP by Trolox can be attributed to reduced ROS and consequent restoration of ΔΨm and Ca2+ uptake. In contrast to the significant impairment of PTP at the MF-CA3 synapses in the Tg2576 mice, paired pulse ratios obtained at varying intervals (10, 30, 50, 100, and 200 ms) showed no significant difference (Fig. 7E), suggesting that paired pulse facilitation is not affected by mitochondrial dysfunction. These results support that PTP in the MF-CA3 synapse depends on mitochondrial Ca2+ handling and is selectively impaired in the early preclinical stage of AD.

Impaired mitochondrial Ca2+ uptake underlies the reduced PTP at the mossy fiber synapses of the Tg2576 mice. Post-tetanic potentiation was induced by HFS (25 Hz, 5 s) at the MF synapses onto the CA3 PCs in both the WT and Tg2576 mice. A, B, Representative time course of PTP and the effect of TPP+, a mitochondrial NCX inhibitor, on PTP of EPSCs in the CA3-PCs of a WT (A) and Tg2576 (B) mouse. DCG4 (2 μm) was applied at the end of each experiment to confirm that MF synapses are studied. C, Effect of pretreatment with Trolox on PTP in the Tg2576 CA3-PCs. D, A summary bar graph for the mean magnitude of PTP. For WT MF synapses, data from control synapses (circles) and those pretreated with Trolox (500 μm, squares) were pooled because they were not statistically different. The numbers in parentheses are number of neurons/mice studied in each condition. E, A mean paired-pulse ratio was plotted as a function of the interpulse interval. The numbers in parentheses indicate the number of paired EPSCs pooled in each data point. **p < 0.01. Error bars indicate SEM.
Discussion
In the present study, using 1- to 2-month-old APP transgenic mice that overproduce Aβ, we discovered that mitochondrial dysfunctions, which include increased ROS production, partial depolarization of ΔΨm and impaired Ca2+ uptake, occur very early in dentate GCs, much earlier than any other functional or morphological changes known so far. Furthermore, we found that PTP in the MF-CA3 synapse was impaired, consistent with the notion that PTP is dependent on Cares originating from mitochondria (Lee et al., 2007a). The observation that antioxidant treatment can restore the short-term plasticity and mitochondrial Ca2+ uptake compromised in the transgenic mice suggests that the increased ROS production in mitochondria is initiating the other dysfunctions. Our study, for the first time, unravels the causal relationships between mitochondrial dysfunction and impaired short-term plasticity in early AD pathogenesis.
Previous studies on Aβ-induced Ca2+ dysregulation have mainly focused on the mechanisms of how Aβ induces an increase of [Ca2+]i (Arispe et al., 1993; Quist et al., 2005). To identify subtle alterations in Ca2+ homeostasis, we focused on changes in Ca2+ clearance mechanisms (CCMs). Employing a method for quantitative analysis of CCMs that we established in previous studies (Lee et al., 2007b, 2009), we discovered that, in the mature GCs from the hippocampus of 1- to 2-month-old Tg2576 mice, somatic Ca2+ clearance was decreased by 25%, and this decrease is attributable to the selective impairment of mitochondrial Ca2+ uptake without changes in the activity of other CCM. Mitochondria participate in Ca2+ clearance at higher Δ[Ca2+] than other CCMs (Kim et al., 2005). Consistent with this notion, we found that the resting [Ca2+]i was not significantly altered in the Tg2576 mice at this early stage. A recent study using in vivo Ca2+ imaging also reported that basal Ca2+ levels in the neurites and spines of AD mice did not show any sign of Ca2+ overload before Aβ plaques were formed (Kuchibhotla et al., 2008). An increased basal Ca2+ level has been regarded as a sign of Ca2+ dysregulation, but it may not reflect dysfunction of CCMs, which are activated under conditions of high [Ca2+]i, such as during high-frequency neuronal activity. Therefore, analysis of Ca2+ clearance over a wide range of [Ca2+]i levels enabled us to detect the earliest changes in Ca2+ homeostasis.
Pathogenic mechanisms of how Ca2+ overload leads to neuronal degeneration have been extensively studied. However, initial neuronal dysfunction caused by a subtle alteration of Ca2+ dynamics is largely unexplored. Given that different subcellular compartments in a neuron exhibit a varying repertoire of CCMs (Lee et al., 2007c), they might be differentially affected by alteration of a CCM. Presynaptic axon terminals undergo much higher [Ca2+] increments during high-frequency firing, and are likely to be more vulnerable to mitochondrial dysfunction than any other neuronal compartments. Presynaptic mitochondria play an essential role in the generation of post-tetanic residual Ca2+ (Cares), which was shown to be a key mechanism of PTP at several central synapses including MF synapses (Lee et al., 2007a, 2008). We confirmed that PTP in MF-CA3 synapses is indeed impaired in the Tg2576 mouse brain (Fig. 7B). These results suggest that presynaptic mitochondria are impaired similar to somatic ones in the Tg2576 GCs. Importantly, synaptic mitochondrial dysfunction in AD pathogenesis has been recently highlighted (Gillardon et al., 2007). Synaptic mitochondria show a greater degree of age-dependent accumulation of Aβ, and are more susceptible to Aβ-induced damage (Du et al., 2010).
Most of the previous studies investigating Aβ-induced synaptic dysfunction have focused on demonstrating deficits in long-term plasticity (Selkoe, 2002). It has been reported that LTP (Walsh et al., 2002) and LTD (Shankar et al., 2008; Li et al., 2009) are altered in the hippocampal CA1 area, which may involve postsynaptic dysfunction. Recently, a causal relationship between mitochondrial ROS imbalance and Aβ-induced impairments in hippocampal LTP has been claimed (Ma et al., 2011), highlighting the importance of mitochondrial ROS in AD pathogenesis. In this study, LTP impairment was measured in slices from 10- to 12-month-old APP/PS1 transgenic mice. Considering that impaired long-term plasticity was observed in the Tg2576 mice aged at least 5 months (Jacobsen et al., 2006), impairment of presynaptic mitochondria-dependent PTP is likely to be the earliest synaptic dysfunction in AD model mice reported so far. It remains to be investigated whether presynaptic and postsynaptic mechanisms underlying short-term and long-term synaptic plasticity are independently targeted by Aβ or presynaptic and postsynaptic dysfunctions are causally related. This issue has been recently investigated in another AD mouse model generated by mutant presenilins (PSs), another causative molecule in AD pathogenesis. Using a genetic approach to inactivate PSs conditionally in either presynaptic CA3 or postsynaptic CA1 PCs of the hippocampal Schaffer-collateral pathway, it was demonstrated that presynaptic but not postsynaptic deletion of PSs causes a decrease in LTP as well as short-term facilitation (Zhang et al., 2009). It was thus suggested that presynaptic dysfunction might be one of the earliest pathogenic changes that can lead to postsynaptic dysfunction. Supporting this idea, the present study shows that impairment of PTP, which reflects presynaptic dysfunction, occurs in the preclinical stage of AD. If behavioral studies to detect deficit in short-term plasticity were developed, they would be beneficial for the early detection of cognitive deficits in AD.
The hippocampus is divided into three main fields (CA1, CA3, and the dentate gyrus), and each field displays distinctive anatomical, molecular, and biophysical properties. We showed that delayed Ca2+ clearance in young Tg2576 mice was detected in dentate GCs, but not in CA1 PCs (Fig. 1 vs Fig. 3). Several possible mechanisms for these region-specific effects can be postulated. First, dentate GCs could produce more Aβ. Indeed, we found that the level of Aβ1–42 was higher in the dentate gyrus compared with that in other regions of the hippocampus or in the cortex (Fig. 4C). Considering that Aβ1–42 is more toxic than other species of Aβ (Mucke et al., 2000; Walsh and Selkoe, 2007), higher levels of Aβ1–42 in dentate GCs could lead to the higher susceptibility of dentate GCs in Tg2576 mice brain. A second possible mechanism is that mitochondria in dentate GCs are more susceptible to Aβ. Finally, the mitochondrial contribution to Ca2+ clearance differs between the different regions. Indeed, we found that the mitochondrial contribution to Ca2+ clearance was negligible in the CA1 PCs when Ca2+ influx was evoked by a depolarizing pulse (Fig. 3). We do not know the reason for the greater role of mitochondria in Ca2+ dynamics in dentate GCs, but it appears to be obvious that the neurons in which mitochondrial contribution is higher can be more vulnerable to mitochondrial dysfunction, and thus to Aβ1–42. It is interesting to note that disruption of a specific gene causes a different phenotype depending on a subregion even if the genes are normally expressed in all regions of the hippocampus. In calretinin-deficient mice, induction of long-term potentiation (LTP) was selectively impaired in the dentate gyrus (Schurmans et al., 1997). A hypomorphic mutation of GluN1 caused a complete suppression of early LTP in the dentate gyrus with no effect on LTP in the CA1 region (Chen et al., 2009). Similarly, subregion-specific disturbances have also been found in age-dependent changes (Burger, 2010). Likewise, assemblies of CCMs may be specialized in distinct subregions with being differentially affected by Aβ in the Tg2576 mice. Precise mechanisms for these region-specific effects remain to be investigated in future studies.
In conclusion, we provided the first direct evidence that mitochondrial dysfunction at the early stage of AD is causally related to Ca2+ dysregulation and impaired short-term plasticity. More importantly, Ca2+ dysregulation and impaired short-term plasticity could be restored by antioxidant treatment. Although we did not determine the oldest age when this reversibility can be achieved by the antioxidant treatment, it was shown that vitamin E supplementation in a Tg2576 mouse model reduced the Aβ level and amyloid deposition only when the supplementation was started at young ages (5 months; Sung et al., 2004). In human trials, many of the antioxidant-based therapies have not proved significantly effective for the treatment of AD; rather they showed better results for the prevention of AD (Dumont and Beal, 2011). These reports including our present findings support the idea that therapies targeting oxidative stress and mitochondria are successful when used in the very early stages of the disease, or even for prevention. The present study provides a cell biology-based rationale for early antioxidant therapy in preclinical stages of AD.
Footnotes
- Received January 31, 2012.
- Accepted March 1, 2012.
This work was supported by the World Class University Neurocytomics Program (R32–10084) and the Science Research Center Program (2010-0029394) from the Korean Ministry of Education, Science and Technology.
The authors declare no competing financial interests.
- Correspondence should be addressed to either of the following: Dr. Won-Kyung Ho, Department of Physiology, Seoul National University College of Medicine, 103 Daehak-ro, Jongno-gu, Seoul 110–799, Republic of Korea, wonkyung{at}snu.ac.kr; or Dr. Suk-Ho Lee, Department of Physiology, Seoul National University College of Medicine, 103 Daehak-ro, Jongno-gu, Seoul 110–799, Republic of Korea, leesukho{at}snu.ac.kr
- Copyright © 2012 the authors 0270-6474/12/325953-11$15.00/0