

Article Figures & Data
Figures
- Figure 1.
Displayed are the visual stimuli, their duration, and their temporal order during a typical trial (from left to right). Participants are required to maintain gaze in the center of the screen for the first two screens. In the third screenshot (cue period), a saccade 8° (deg) from the fixation point in the opposite direction of the cue is required. Arrows indicate initial gaze refixation during the cue period; a saccade to the donut is considered an error. COR, Correct; ERR, error.
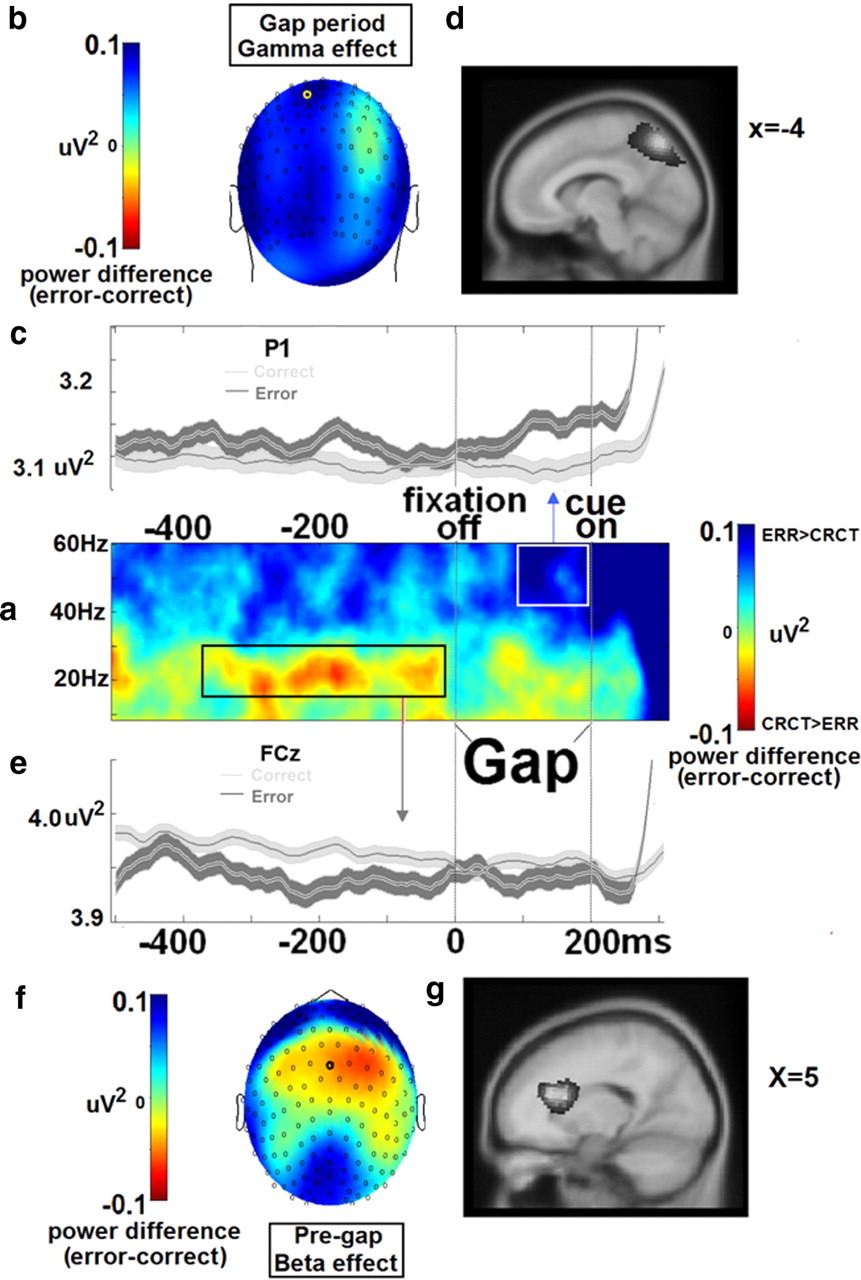
- Figure 2.
Power effects. a, Correct minus error trial difference in pre-cue time/frequency data. b–d, Shown above is the gamma effect (right box in a), which consisted of greater power 100–0 ms before cue onset on error trials and an estimated source location of posterior parietal cortex/precuneus, depicted in the topography (b), time course (c), and estimated cortical source location (d). e–g, Below is the beta effect (left box in a), which consisted of less power 400–0 ms before the gap onset on error trials and an estimated source location of anterior cingulate cortex depicted in the time course (e), topography (f), and the estimated cortical source location (g). Source images are in neurological convention (left is left); coordinates depicted in d and g are Talairach space.
- Figure 3.
ITC effects. Error trials are characterized by less ITC at cue onset, and this difference is present in sensor Iz and was localized to left inferior parietal lobule, cuneus, and right middle occipital gyrus. a–c, Differences between error (ERR) and correct (CRCT) trial ITC displayed as topography (a), a time–frequency distribution (b), and an estimated cortical source location (Talairach coordinates, neurological convention) (c). d, Time courses of ITC for each trial type are displayed. Results in a, c, and d are derived from data within the white square in b.
- Figure 4.
Phase bifurcation effects. Alpha phase at the onset of the gap period (200 ms pre-cue) from 6 to 9 Hz originating in left prefrontal/premotor cortex and left visual cortex is different between error and correct trials. a–c, Phase bifurcation values displayed as topography (a), a time–frequency distribution (b), and an estimated cortical source location (Talairach coordinates, neurological convention) (c). d, A plot of proportion of error antisaccades as a function of instantaneous phase bin indicates that performance varies depending on a subject's pre-trial alpha phase. Results in a, c, and d are derived from data within the white square in b. Error bars in d reflect within-subjects standard errors (Cousineau, 2005).


