

Article Figures & Data
Figures
- Figure 1.
Stimulus-evoked field potentials and O2 and NADH changes. A, Diagram of the electrode positions and area imaged. B, Inset: Specimen field potentials evoked at 0.33 Hz, in the absence and presence of TTX. Main panel: Trace from inset without TTX minus the trace in TTX, annotated to show how field potential amplitudes were measured. C, Decrease of extracellular [O2] evoked by 10 s of 20 Hz stimulation. D, Biphasic NADH response (change in fluorescence/fluorescence at the start of stimulation, ΔF/F0) evoked by 10 s of 20 Hz stimulation in the stratum radiatum (s.r.), stratum pyramidale (s.p.), and stratum oriens (s.o.). E–G, Resting NADH fluorescence (E), decrease of NADH fluorescence evoked by 20 Hz stimulation (F), and subsequent increase of NADH fluorescence above resting level (G) in the s.r., s.p., and s.o. All p values are from paired t tests. H, How the rates of glycolysis, the TCA cycle, and oxidative phosphorylation determine whether the NADH level falls or rises. An increase in the rate of oxidative phosphorylation will lower [NADH]. An increase in the rate of glycolysis (in astrocytes or in neurons) will increase [NADH], if not balanced by NADH consumption in the conversion of pyruvate to lactate, as will an increase in the rate of the tricarboxylic acid cycle. Lactate dehydrogenase is proposed to convert pyruvate to lactate in astrocytes, and lactate to pyruvate in neurons.
- Figure 2.
Pharmacological analysis of O2 use on different subcellular mechanisms. A, Schematic showing experimental protocol, with three stimulation sets in each condition applied at 6 min intervals (see Materials and Methods): during the first stimulation phase, no drug is present for all slices. In the second phase, some slices are exposed to drug, while some remain drug free as controls. In the third phase, 1 μm TTX is applied (to allow subtraction of the stimulation artifact from the field potential data). Responses in phase 2 are reported as a percentage of the response in phase 1, to normalize to the number of axons activated in each slice. Comparing the normalized responses for control and drug in phase 2 defines the effect of the drug tested. B–D, Amplitude of presynaptic action potential volley (B), postsynaptic field EPSP (C), and postsynaptic action potential population spike (D) measured as in Figure 1B, in the presence of NBQX+AP5 or Cd2+ together with the amplitude seen on the second application of 20 Hz stimulation in the absence of drugs (Con). The p values are from one sample t tests comparing with 100% (the response in the first stimulation phase), unless marked with an asterisk, in which case the comparison is versus zero. E–G, Amplitude of the [O2] decrease (E), decrease in NADH fluorescence (F), and overshoot of NADH fluorescence above its baseline value (G) in the presence of NBQX+AP5, Cd2+, and TTX, compared to the amplitude seen on the second application of 20 Hz stimulation in the absence of drugs (Con; these values are not significantly different from the responses to the first set of stimuli). Incrementally blocking postsynaptic activity (NBQX+AP5), transmitter release (Cd2+), and all evoked activity (TTX) incrementally decreased the [O2] decrease. The p values are from unpaired t tests, corrected for multiple comparisons. H, I, Specimen traces (H) and mean values (I) for the decrease of [O2] evoked by 500 μm glutamate in 250 μm Cd2+ and in Cd2+ + 1 μm TTX. The resting [O2] was not significantly affected by Cd2+ (reduced by 42 ± 36%; p = 0.29) nor by TTX (in Cd2+; reduced by 12 ± 36%; p = 0.75) in seven slices.
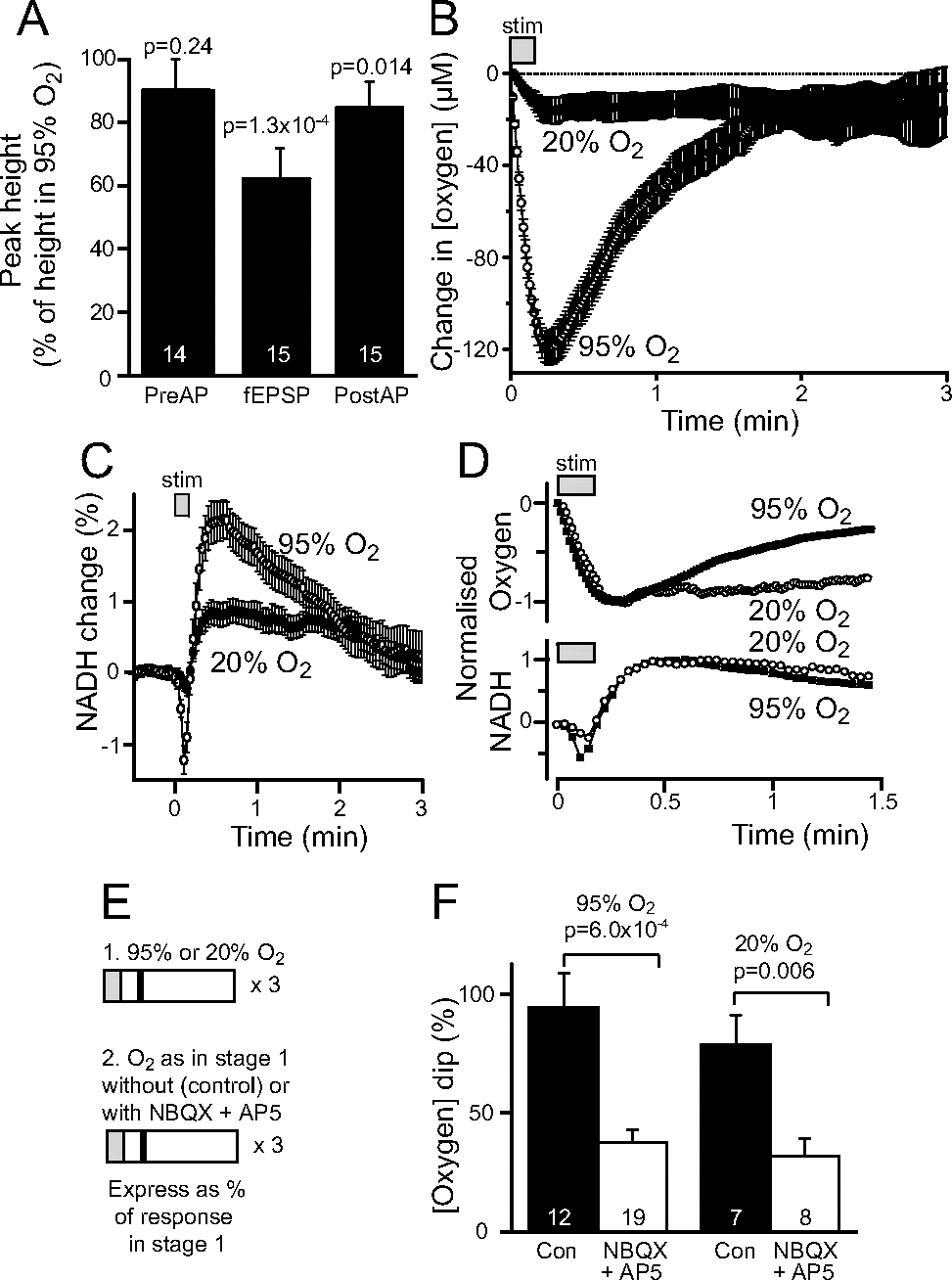
- Figure 3.
Oxidative phosphorylation powers neuronal activity at physiological [O2]. A, Effect of switching from 95% to 20% O2 in the superfusion solution on the amplitude of the presynaptic action potential, the postsynaptic fEPSP, and the postsynaptic action potential (population spike). B, Mean time course of [O2] decrease in 20% O2 solution in 15 slices, compared with that in 95% O2 solution (56 slices). C, Mean time course of NADH changes in 20% and 95% O2 solution (in 11 and 15 slices, respectively). D, Oxygen and NADH responses in 20% (open circles) and 95% (filled squares) O2, normalized to the peak dip and overshoot, respectively. E, F, Effect of GluR blockers on O2 dip in 95% and 20% O2. E, Experimental design. The first stimuli were presented in 95% or 20% O2. The same [O2] was maintained for the second stage, when NBQX+AP5 was applied to 8 of 15 slices in 20% O2 or 19 of 31 slices in 95% O2. F, Effect of NBQX+AP5 on the oxygen dip in 95% and 20% O2. Control bars show response to second stimulation normalized to response to first stimulation in the same O2 (not significantly different from the response to the first stimulation, p = 0.73 for 95%; 0.14 for 20% O2). NBQX+AP5 bars show response to second stimulation in NBQX+AP5 normalized to response to first stimulation without drugs in the same O2. There was no significant difference between the effect of NBQX+AP5 in the two O2 concentrations (univariate ANOVA, p = 0.64).
- Figure 4.
Blocking LDH does not affect the [O2] and [NADH] decreases. A, Effect of LDH inhibition on lactate level in the extracellular solution (5 slices). Oxamate significantly inhibits lactate accumulation (the inhibition of LDH is even stronger than the reduction in lactate concentration shown in the graph, because lactate made before the oxamate was applied will not be removed by the oxamate). B, Experimental protocol. Oxamate was added or not added during stage 2, and responses in E–G were expressed as a percentage of those in stage 1. C, D, Example traces showing the effect of 20 mm oxamate on the O2 transient (C) and the NADH dip and overshoot produced by Schaffer collateral stimulation (D). E–G, Mean data showing the effect of oxamate on the [O2] decrease (E), initial NADH fluorescence decrease (F), and late NADH fluorescence increase (G), normalized as in B. Solutions contained 95% O2.
- Figure 5.
Effects of oxamate on field potentials. A, Example traces showing the effect of 20 mm oxamate on the field potential produced by Schaffer collateral stimulation. B–D, Effect of oxamate on the presynaptic action potential volley (preAP; B), the fEPSP (C), and the postsynaptic population spike (postAP; D). E, Effect of oxamate on the half-maximum width of the population spike and on the fEPSP decay time constant. In control conditions, repeated stimulation had no effect on the kinetics of the population spike (half-maximum width, 110 ± 3% of that for first stimuli; p = 0.12; n = 10) or fEPSP (decay time constant, 114 ± 20%; p = 0.47; n = 9).
- Figure 6.
Modeling the O2 consumption of the slice. A, [O2] profile across the unstimulated slice in the stratum radiatum and stratum pyramidale (N = 6 slices). The slice surface is denoted position 0. B, Mean of data in the two regions in A (circles), and theoretical fits for different assumed Vmax values for O2 consumption (given by each curve), constrained to have the value 387 μm at x = 0. The best fit (in red) is with Vmax = 0.7 mm/min. C, Fitting the [O2] decrease evoked by stimulation at a position 92 μm into the slice. Black circles are the mean control data in 95% O2 from Figure 3B. Each smooth curve is the computed response to an increase of Vmax from 0.7 to 1.5 mm/min, followed by a decay back to 0.7 mm/min with the rate constant (in min−1) shown by each curve. The best fit (red) is with a rate constant of 2.5 min−1, i.e., a time constant of 0.4 min or 24 s. D, Predicted [O2] profiles across the slice in the resting state and at the peak of the O2 dip following stimulation. E, Predicted dependence of the amplitude of the [O2] transient on the underlying increase of the Vmax for O2 use. F, Predicted relationship between the increase in O2 consumed at the recording site and the size of the O2 dip (the curve is O2 consumption/mm = 7.8 × (oxygen dip/mm)1.3).
- Figure 7.
The distribution of O2 use across different subcellular processes. A, The O2 use on AMPA/KA and NMDA receptor currents and postsynaptic action potentials (blocked by NBQX+AP5); on presynaptic Ca2+ entry, vesicle release and refilling, mGluR activity, and transmitter uptake (blocked by Cd2+ but not by NBQX); and on presynaptic action potentials (blocked by TTX but not by Cd2+). B, The O2 use on different subcellular mechanisms derived from A by using the analysis of O2 use on postsynaptic glutamate-gated currents and action potentials derived from experiments applying glutamate in Figure 2I. Activity-induced ATP use on mGluRs and astrocytes are ignored, but were estimated by Attwell and Laughlin (2001) to be ∼2% and <7% of that in neurons, respectively.


