

Article Figures & Data
Figures
- Figure 1.
Schematic illustration of the correlogram calculation. A, The 3 spike trains above the correlogram represent responses of a single fiber to stimulation with broadband noise at a variable intensity (SPLX); the 3 spike trains at the bottom of the panel represent responses of the same fiber to the same stimulus at a reference intensity (SPLref). A spike is selected (circle) in the responses to SPLX and all intervals between this spike and all spikes in response to SPLref are tallied in a histogram with a binwidth of 50 μs. Note that calculating these intervals is no different from determining whether two spikes, shifted in time by a certain delay, are coincident. For each coincidence or interval value, the corresponding histogram bin is increased by 1 (indicated in black). B, A different spike is selected; the histogram is recentered so that the new spike represents 0 ms delay; and again all intervals between this new spike and spikes at SPLref are calculated. This process is repeated until all spikes to SPLX have been used once. In the schematic, the spike train in response to SPLX leads in time relative to SPLref which results in a shift of the correlogram to positive delays.
- Figure 2.
Simple model to illustrate the effect of interaural phase difference (IPD) on the cross-correlation function. The output of identical 150 Hz wide Gaussian filters centered at 500 Hz, in response to broadband noise, are cross-correlated. The phase spectrum of one input is kept constant across all four panels. The phase spectrum of the other “ear” is manipulated such that IPD varies linearly with frequency. A, The phase spectra are identical (IPD = 0, top): the cross-correlation is effectively an autocorrelation, peaking at 0 ms (bottom). The thin line shows its envelope, obtained with the Hilbert transform, which also peaks at 0 ms. B, Pure time delay: IPD is proportional to frequency f and equals 0.001 f, simulating a delay of 1 ms. The entire cross-correlation function is shifted by 1 ms: its fine-structure (bold line) and its envelope (thinner line). The correlation and IPD function of A are also shown for comparison. C, Constant phase shift: IPD = 0.5 cycle. Shifting the phase of the impulse response of one “ear” by a half-cycle results in an inversion of the fine-structure of the cross-correlation function, without affecting its envelope. D, Combination of a time shift (1 ms) and phase shift (−0.5 cycle), such that the IPD pivots at the filter's center frequency: IPD = 0.001f - 0.5. The cross-correlation function's envelope shifts by 1 ms, but not its fine-structure.
- Figure 3.
The ongoing timing of responses shows submillisecond shifts with increasing level. Examples of correlograms for a fiber with low CF (A, B: CF = 521 Hz, SR = 71 spikes/s) and high CF (C, D: 27 kHz, SR 0.4 spikes/s), using a reference SPL of 70 dB. A, correlograms based on responses to correlated (bold line) and anticorrelated (thin line) noise pairs at different levels. Levels for each noise pair (e.g., 80|70) indicate test (e.g., 80) and reference (e.g., 70) level, respectively. Positive correlogram values indicate lag of the response at the reference SPL relative to the test SPL. At test levels higher than the reference (80|70, top) the response at the reference SPL slightly lags that at the test SPL, while the opposite is true at 60|70 and 50|70. The correlograms at 70|70 are autocorrelograms and peak at 0 delay. B, Difcors calculated by subtracting the correlograms to anticorrelated noise from the correlograms to correlated noise. The thin line is an estimate of the envelope of the difcor calculated with the Hilbert transform. C, D, Identical analysis for the high-CF fiber. Abscissa labels of bottom left panel apply to all panels. Flat difcors (D) indicate that correlograms to correlated and anticorrelated noise are virtually identical: for clarity we offset the latter by one vertical unit in C.
- Figure 4.
Correlograms for different “ILD” conditions (indicated above each panel) reveal subtle but systematic shifts across CF. The correlograms are normalized to their maximum, and are vertically stacked according to CF. A–C, Correlograms over a 10 ms range of delays, for broadband noise presented at equal (B) or unequal (A, C) SPL. There is a transition at CF ∼ 3.8 kHz from a regime of coding of fine-structure to a regime of coding of envelope. D–F, zoom-in on the central part of the correlograms. The primary peaks are marked by circles. In the autocorrelograms (E) all peaks occur at zero delay. Decrease of SPL (D) results in a lead (negative delay values) of the spikes to the reference SPL (70 dB) relative to the test SPL (50 dB); increase of SPL (F) results mostly in a lag (positive delay values) of the responses to the reference SPL (70 dB) relative to the test SPL (90 dB) but causes a lead in some fibers. The solid hyperbolic lines in D–F span one CF period.
- Figure 5.
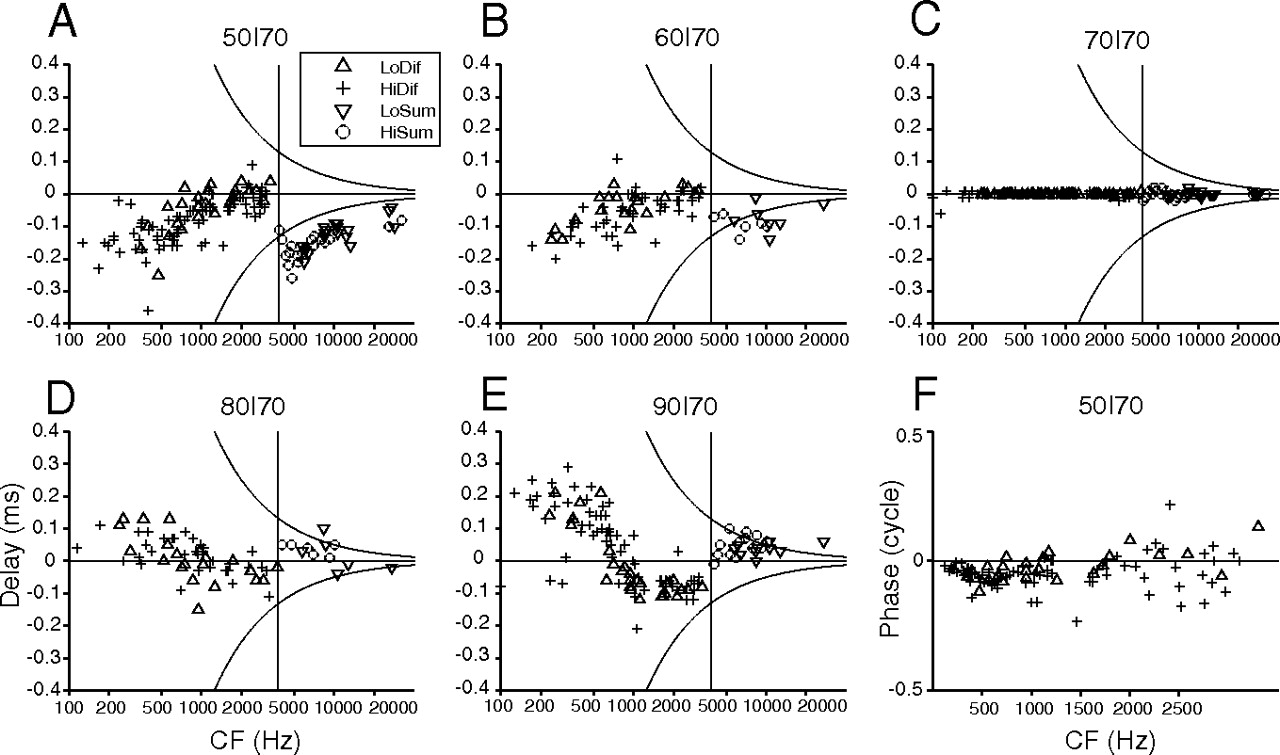
Shifts of correlogram peaks show two regimes in different CF regions. Primary peak shifts for 5 different “ILD” conditions (indicated above the panels), computed from difcors for low-CF fibers (<3.8 kHz, vertical line) and from sumcors for high-CF (>3.8 kHz) fibers. Different symbols are used to indicate the type of correlogram used (difcor vs sumcor) and to separate fibers with low and high SR: triangles and + at low CF, inverted triangles and circles at high CF. A, B, Stimulus levels below the 70 dB reference level result in a delay of the spikes in the test spike trains relative to the spikes in the reference spike trains. C, Autocorrelograms are centered near 0 delay. D, E, High test levels result in shifts of both difcors and sumcors toward positive delay values, except in the region between 0.8 and 3.8 kHz, where paradoxical shifts toward negative delays are observed. F, Difcor delays for low-CF fibers of A replotted on a phase ordinate. Average phase shift was −0.04 cycle. Legend in A and axis labels in D apply to A–E. Distance between hyperboles in A–E indicates CF−1.
- Figure 6.
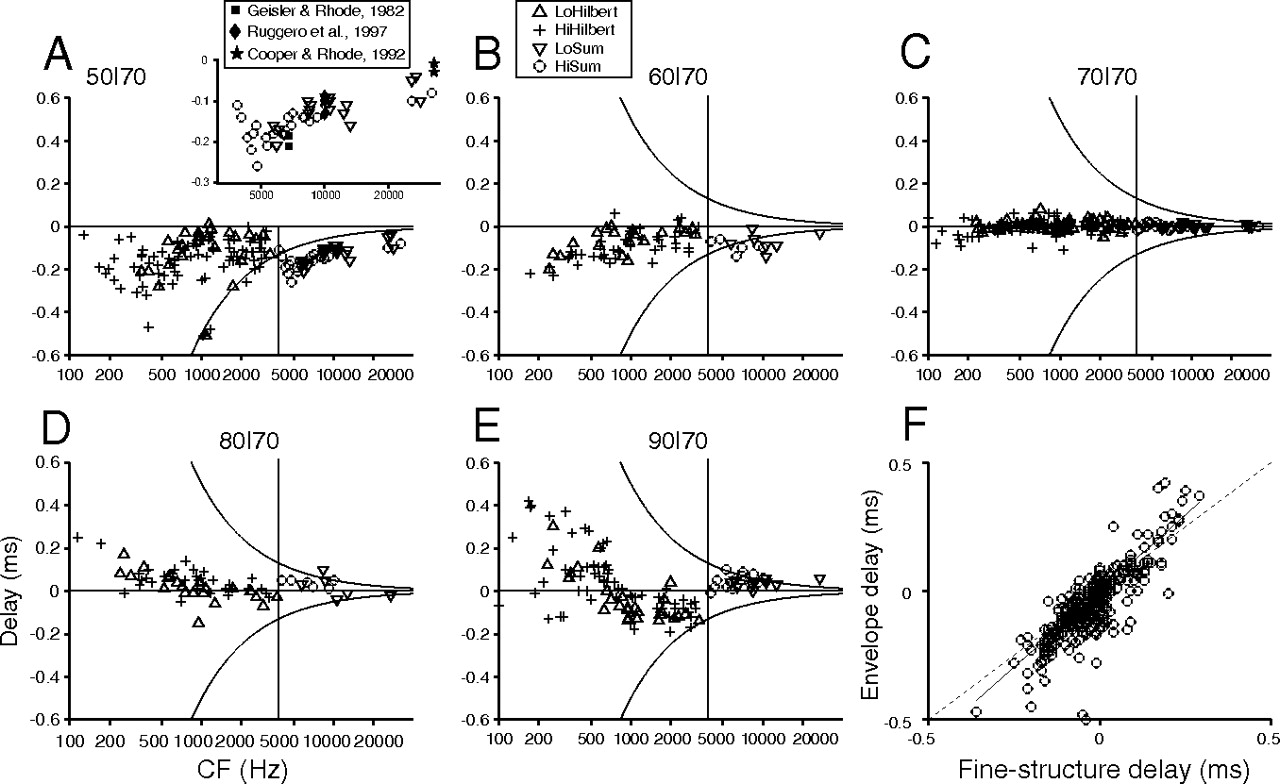
Shifts in the envelope of correlograms. A–E, The correlogram delays at low CF are measured on the correlogram envelope obtained with the Hilbert transform (in low and high SR fibers: LoHilbert and HiHilbert). The data at high CF are the same as in Figure 5 and are the correlogram delays measured directly on the peak of the sumcor. Symbol caption in B applies to A–E. The inset in A zooms in on the high CF data for a comparison with group delays taken from the literature (solid symbols). F, In low-CF fibers, delays in correlogram envelope and fine-structure are well correlated. All stimulus conditions except 70|70 are included.
- Figure 7.
Dependence of correlogram magnitude and delay on “ILD”. Abscissa: “ILD”, using 70 dB SPL as reference. Upper panels are for fibers with CF < 3.8 kHz. Lower panels are for fibers with CF > 3.8 kHz. A, B, Ordinate: correlation index (CI) i.e., the maximum of the correlogram normalized for the number of spikes. CI = 1 indicates the number of coincidences as expected from chance. Each line joins measurements on one fiber. While the CI tends to be maximum at 0 “ILD” in low-CF fibers, it decreases with increasing “ILD” in high-CF fibers. Note the difference in ordinate scale between A and B. C, D, Ordinate: delay of the primary peak of the correlogram. Negative values (i.e., lead of the reference level of 70 dB SPL) are plotted upward. At negative “ILD”, i.e., lower SPL than the reference SPL of 70 dB, the responses at 70 dB generally lead relative to the (lower) test SPL. At positive “ILD” the responses at 70 dB generally lag relative to the (higher) test SPL, but at low CFs (C) many “paradoxical” latency shifts are observed. The data highlighted with a thick gray line and white “x” symbols illustrate measurements for the two fibers of Figure 3. The data are calculated on splined difcors for the low CF data (A, C, N = 175 fibers) and on splined sumcors for the high CF data (B, D, N = 40 fibers).


