

Abstract
Abnormal accumulation of α-synuclein is centrally involved in the pathogenesis of many disorders with Parkinsonism and dementia. Previous in vitro studies suggest that α-synuclein dysregulates intracellular calcium. However, it is unclear whether these alterations occur in vivo. For this reason, we investigated calcium dynamics in transgenic mice expressing human WT α-synuclein using two-photon microscopy. We imaged spontaneous and stimulus-induced neuronal activity in the barrel cortex. Transgenic mice exhibited augmented, long-lasting calcium transients characterized by considerable deviation from the exponential decay. The most evident pathology was observed in response to a repetitive stimulation in which subsequent stimuli were presented before relaxation of calcium signal to the baseline. These alterations were detected in the absence of significant increase in neuronal spiking response compared with age-matched controls, supporting the possibility that α-synuclein promoted alterations in calcium dynamics via interference with intracellular buffering mechanisms. The characteristic shape of calcium decay and augmented response during repetitive stimulation can serve as in vivo imaging biomarkers in this model of neurodegeneration, to monitor progression of the disease and screen candidate treatment strategies.
Introduction
A number of studies have implicated abnormal accumulation of the presynaptic protein α-synuclein (α-syn) encoded by SNCA gene (Iwai et al., 1995) in the pathogenesis of Parkinson's Disease (PD) and dementia with Lewy bodies (DLB) (Polymeropoulos et al., 1997; Spillantini et al., 1997; Singleton et al., 2003). Although the mechanism through which α-syn promotes neuronal vulnerability is not completely clear, in vitro studies revealed the ability of α-syn oligomers to alter intracellular calcium levels (Quist et al., 2005; Danzer et al., 2007; Tsigelny et al., 2008). Given that there is no direct evidence demonstrating a dysregulation of calcium homeostasis in vivo by α-syn, the main objective of our study was to investigate calcium dynamics in an α-syn transgenic (tg) mouse model of synucleinopathy, overexpressing human α-syn under mThy-1 promoter (Masliah et al., 2000; Rockenstein et al., 2002), using two-photon microscopy. This α-syn tg model reproduces many features of sporadic PD, including reduction of dopaminergic input into striatum and deficits in motor and nonmotor functions (Magen and Chesselet, 2010). We found that cortical neurons in α-syn tg mice displayed alterations in calcium activity consistent with a decrease in the intracellular calcium buffering capacity.
Materials and Methods
Animal procedures.
All procedures were approved by the UCSD IACUC. α-syn tg female mice, their female littermates (controls), and female mice lacking expression of α-syn [α-syn knock-out (KO); Jackson Laboratories, #003692] were anesthetized with isoflurane: 3% initially, followed by 1–2% during surgical procedures (tracheotomy, cannulation of femoral artery, and cortical exposure). All surgical procedures and mapping of the center of the neuronal response were performed as described by Devor et al. (2007). During data acquisition, anesthesia was maintained with α-chloralose (50 mg*kg−1). Mice were ventilated with 30% O2 in air (∼100 bpm, SAR 830/P, CWE). Expired CO2 (CI240, Columbus instruments), heart rate, and blood O2 saturation (Mouse OX, STARR), blood pressure (BP1, WPI), and body temperature (Homeothermic blanket, Harvard Apparatus) were monitored continuously. Blood gas (Rapidlab 248, Siemens) was measured at the start of data acquisition to adjust the respiration parameters to achieve pCO2 35–45 mmHg, pO2 100–180 mmHg, and pH 7.35–7.45.
Two-photon imaging.
Calcium indicator Oregon Green 488 BAPTA-1 AM (OGB1, green) and glial marker sulforhodamine 101 (SR101, red) were loaded by microinjection (Stosiek et al., 2003). Images were obtained using an Ultima two-photon laser scanning microscopy system from Prairie Technologies, equipped with an Ultra II femtosecond laser (Coherent) tuned to 800 nm. Two stimulus types, a single electrical stimulus (100 μs, 1 mA) and a train of 3 stimuli at 3 Hz, were delivered to the contralateral whisker pad. Within each ∼50 × 100 μm field of view (FOV), 10–15 neuronal cell bodies were imaged in a frame scan mode with a target acquisition rate of 10 Hz. Fifteen stimulus trials with interstimulus intervals (ISI) of 15 s were presented for each FOV and for each of the 2 stimulus conditions. In addition, ∼100 s of spontaneous activity were collected to estimate the occurrence and duration of spontaneous events.
For extraction of time courses, masks corresponding to individual neuronal bodies were segmented from the images (Fig. 1a–c). For an individual neuron, calcium signal per frame was calculated as an average of all pixels within its cell body mask. This calculation was repeated for each frame in the time series to generate a single-neuron time course. The fluorescent signal was expressed as the percent change relative to the prestimulus baseline (ΔF/F). For calculation of averages across neurons, we grouped the single-neuron data according to 3 cortical depths: 100 μm (the upper boundary of layer II), 150 μm (layer II), and 250 μm (layer III).
Electrophysiology.
Extracellular recordings of multiunit activity (MUA) in response to a train of 3 stimuli at 3 Hz were performed as described by Devor et al. (2003) using a single metal electrode (FHC, 2.5 MΩ) at depths of 150–500 μm, stepping down 100 μm at a time. The MUA signals were filtered between 750 and 5000 Hz, rectified on the time axis, and trial-averaged. Twenty-five stimulus trials were averaged at each location; ∼100 stimulus trials were averaged per animal for the indicated depth range.
Data analysis.
Two-photon and electrophysiological data were analyzed in MATLAB. All statistical analyses were performed across subjects. Two-photon imaging and electrophysiology results were expressed as the mean ± standard error of the mean (SEM). For evaluation of statistical significance, independent datasets were compared using unpaired 2-tailed Student's t test. p values <0.05 were considered significant.
The Z test was used to evaluate whether α-syn tg neuronal calcium response to a single stimulus deviated from the exponential decay. The Null hypothesis assumed a single distribution and was estimated from the control population within the corresponding depth range (n = 294). The z-score was calculated as (x − av)/stdev, where x is the single stimulus-evoked response of each neuron, av is the averaged control single stimulus-evoked response, and stdev is the standard deviation in the population of the control neuronal single stimulus-evoked responses. The null hypothesis was rejected if the z-score was ≥1.96 or ≤1.96.
Immunohistochemistry.
At the end of the experiment, the animals were overanesthetized and the brains removed and fixed (Koob et al., 2010). OGB1 injection site was marked with black carbon powder (Sigma), and the fixed brain was serially horizontally sectioned (50 μm). Sections were labeled with antibody against human α-syn (Millipore Bioscience Research Reagents), or with antibody against neuron-specific nuclear protein “Neuronal Nuclei” (NeuN; Millipore) and against glutamic acid decarboxylase (GAD) 65–67 (Millipore Bioscience Research Reagents). NeuN and GAD 65–67-positive neurons were counted manually using a random grid, applied directly to the RGB-merged images of the sections (4 sections per mouse), and averaged among the grid cells and later among the sections. Three hundred to five hundred OGB1-positive cell bodies were analyzed in each section. Neuronal type counts were expressed as a percentage of OGB1-positive cells.
Results
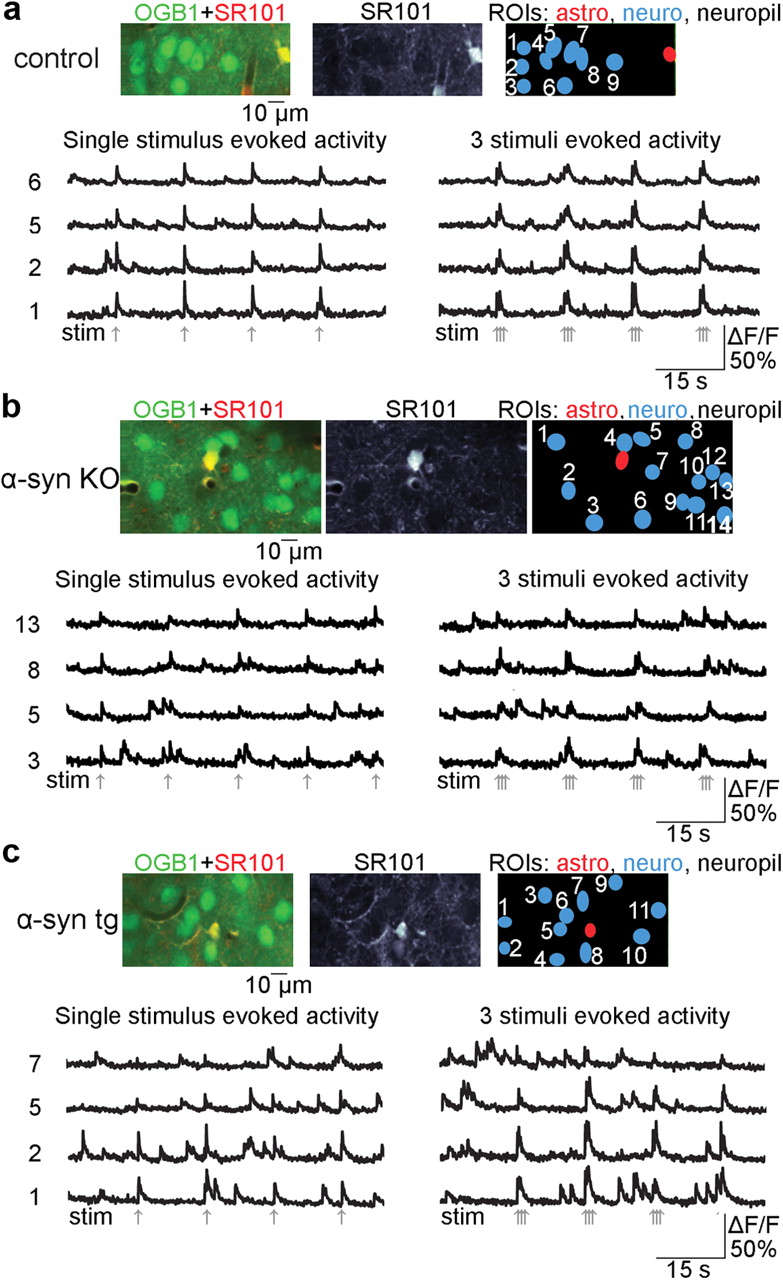
We imaged the barrel cortex of α-syn tg mice (12 months old, n = 7), age-matched controls (n = 7), and α-syn KO mice (n = 4). Neurons, labeled with calcium indicator OGB1, appeared in green. Astrocytes, labeled with both OGB1 and SR101, appeared in yellow (Fig. 1a–c, see color panels).

Abnormal calcium activity of cortical neurons from tg α-syn mice. a, A FOV from a control mouse including a composite two-photon image of calcium indicator OGB1 and astrocyte-specific marker SR101 at the baseline. Calcium signal time courses illustrate stimulus-evoked calcium responses following a single stimulus and a train of three stimuli. The time courses are extracted from neuronal ROIs, shown in blue. The signal is expressed as ΔF/F. b, c, As in a, for an example FOV from α-syn KO and α-syn tg mice, respectively. Gray arrows indicate stimulus onset.
Spontaneous calcium activity in α-syn tg mice is augmented
With respect to control (Fig. 1a) and α-syn KO mice (Fig. 1b), spontaneous calcium transients in α-syn tg mice were more frequent and exhibited larger amplitudes and longer durations (Fig. 1c). To quantify the spontaneous activity, we defined the threshold as a 5% signal change from the baseline (ΔF/F) and measured: (1) the area under the curve (AUC) above the threshold within 100 s of the spontaneous activity; (2) the percentage of time spent above the threshold; and (3) the frequency and duration of individual spontaneous events (Fig. 2a). Only events above the threshold were counted. The duration of a spontaneous event was defined as the period from when the signal rose above the threshold to when it crossed the threshold again as it dropped toward the baseline (Fig. 2a). Compared with control and α-syn KO mice, α-syn tg mice consistently scored higher in all of the above measures (Fig. 2b). Specifically, in α-syn tg neurons AUC, percentage of time spent above the 5% ΔF/F threshold, and the frequency of appearance of spontaneous transients were 2- to 3.5-fold higher than in controls at all 3 imaged depths. The α-syn KO mouse group, examined as a negative control, was imaged at the 250 μm depth only. All of the parameters mentioned above were 1.2- to 1.5-fold higher in α-syn tg neurons than in α-syn KO neurons. However, the differences between α-syn tg and α-syn KO values were not statistically significant.

Quantification of calcium dysfunction. a, Spontaneous events (gray arrows) were defined when the signal rose above a 5% ΔF/F increase from the baseline. The 5% threshold is illustrated by a horizontal gray line, using an example of an α-syn tg time course. The area under the curve, calculated as an integral over time periods above the threshold, is colored in gray. b, AUC, percentage of time above the threshold, frequency, and duration of spontaneous events for each depth; n, the number of neurons across animals. The error bars represent SEM. c, Averaged stimulus-induced calcium responses for each stimulus condition and depth. Dashed lines indicate confidence intervals. The number of neurons for each stimulus condition and depth are shown. Black arrows point to deviation from exponential decay in α-syn tg averaged responses. The portion of the trace where deviation from exponential decay is statistically significant is marked by stars. Gray arrows indicate stimulus onset. d, The parameters for quantification of stimulus-evoked events illustrated for an example response from an individual neuronal ROI, responding to both stimulus conditions: AUC is colored in gray; peak width is defined as full width at 30% of the normalized peak amplitude; and peak ratio is defined as the ratio of the third to the first peak. The examples of peak ratio estimation for control (peak ratio <1) and α-syn tg (peak ratio >1) neurons. e, AUC, peak width, and peak ratio of evoked events for each depth. *p < 0.01; **p < 0.05.
Stimulus-evoked calcium activity in α-syn tg mice is characterized by deviation from exponential decay and increase in response to repetitive stimulation
Consistent with the spontaneous behavior, stimulus-induced calcium increases in α-syn tg mice were larger and exhibited a prolonged, nonexponential decay (Fig. 2c, see group-averaged data). To quantify calcium entry for each imaged neuron following a single stimulus, we averaged the response over stimulus trials (see Materials and Methods) and calculated AUC (Fig. 2d,e). To compare the amplitude-independent width of the response, we normalized the peak amplitude and measured the width at 30% of the peak amplitude (Fig. 2d,e). The AUC and the width of the response to the train stimulus were significantly larger in the α-syn tg population for all 3 imaged depths (1.3- to 2-fold larger than the controls). The same trend (1.3- to 1.5-fold larger than the controls) was visible for the single stimulus condition, and reached statistical significance in 2 of the 3 depth categories (100 and 250 μm).
Next, we compared the decay profiles of calcium transients evoked by a single stimulus. As illustrated in Figure 2c, the decay in α-syn tg mice deviated significantly from the known exponential shape (Yaksi and Friedrich, 2006; Vogelstein et al., 2010) (Fig. 2c, arrows). The most significant deviation was observed during the later decay phase, >300 ms after the stimulus onset. The overall shape of the α-syn tg decay resembled that observed in a neuronal cell culture in response to a massive increase in intracellular calcium, and, in this preparation, has been attributed to a delayed mitochondrial calcium release (Friel and Tsien, 1994).
The difference in calcium response between control and α-syn tg mice was even more evident under the train stimulation at 3 Hz. For the majority of neurons imaged in control mice, the amplitude of the neuronal response decreased within the train (Fig. 2c, gray trace). In the α-syn tg population, in contrast, most of the neurons exhibited an increase in the response amplitude to each consecutive stimulus (Fig. 2c, black trace). We defined the peak ratio as the ratio of the last to the first peak (Fig. 2d). Ratios >1 were observed in ∼60% of the α-syn tg neurons (55.77% at 100 μm, 56.49% at 150 μm, and 64.66% at 250 μm) but only in ∼10% of the control neurons (6.21% at 100 μm, 12.03% at 150 μm, and 11.95% at 250 μm; Fig. 2e). The exacerbated response to the train of 3 stimuli in α-syn tg mice was preserved when the concentration of OGB1 in the loading solution was reduced by 4 times, arguing against the possibility of an increase in OGB1 uptake explaining this phenomenon (data not shown).
To confirm that neuronal calcium alterations were specific to α-syn, calcium activity was examined in α-syn KO mice. Compared with α-syn tg mice, neuronal calcium-evoked responses in α-syn KO animals were less frequent and demonstrated lower amplitudes and shorter durations (Fig. 1b). AUC and peak width in α-syn tg mice were 1.2- to 1.6-fold higher than in the α-syn KO group for both stimuli conditions. In addition, the single stimulus-evoked calcium response in α-syn KO neurons exhibited a clear exponential decay, and the response amplitude following the train of 3 stimuli decreased within the train (Fig. 2c, blue traces). Quantification of peak ratio for α-syn KO mice showed that <20% of all imaged neurons exhibited ratios >1, compared with 65% of α-syn tg neurons for the same depth.
Imaged α-syn tg neurons express the transgene
To explore the possibility that calcium abnormalities in α-syn tg mice are related to α-syn accumulation, we examined α-syn expression patterns in the barrel cortex of α-syn tg mice, where major calcium alterations were detected. Consistent with previous reports describing our and other α-syn tg mouse models (Rockenstein et al., 2002; Unni et al., 2010) an abundant α-syn fluorescent immunolabeling was evident in this area of the brain (Fig. 3a). Colocalization of OGB1 calcium marker and α-syn confirmed expression of the latter in the imaged tg cortical neurons (Fig. 3a). Next, we performed neuronal cell type classification using NeuN antibody for all postmitotic neurons (Fig. 3b, blue), and GAD 65–67 for GABAergic inhibitory neurons (Fig. 3b, red). A comparative estimation (see Materials and Methods) of the percentage of NeuN-expressing neurons and GABAergic inhibitory neurons at OGB1 injection site, 250 ± 100 μm under the brain surface, was performed. The choice of depth was motivated by the observation that, among the 3 depths imaged, neurons with cell bodies located at the 250 μm depth displayed more profound alterations in calcium activity. The estimation has revealed that neuronal populations expressing NeuN and GAD 65–67 in this brain area were indistinguishable in control (n = 2, 97.52 ± 6.35% and 13.99 ± 4.32, respectively) and α-syn tg (n = 2, 98.28 ± 3.19% and 14.91 ± 5.19%, respectively) mice (Fig. 3c). Thus, the significant discrepancy in calcium activity between control and α-syn tg mice may not be attributable to the differences in the ratio of inhibitory to excitatory neurons. In addition, our results were in the range of the previously reported neuronal type counts, performed in the barrel cortex of rodents (Meyer et al., 2010). Next, we estimated the fraction of neurons exhibiting calcium alterations imaged 250 ± 100 μm under the brain surface in control, α-syn KO, and α-syn tg mice. For this purpose, we defined a criterion for calcium alterations as a significant deviation from the exponential decay of single stimulus-evoked neuronal response (see Materials and Methods) and/or amplification of the response amplitude during repetitive stimulation. Using this criterion, we estimated that the control and α-syn KO groups comprised low percentages of neurons with calcium abnormalities (14.29.57 ± 3.07% and 23.1 ± 7.31%, respectively), possibly due to a decrease in mitochondrial buffering capacity with aging, whereas 64.66 ± 9.31% of α-syn neurons demonstrated calcium response alterations (Fig. 3d), supporting the idea that these alterations are related to the expression of α-syn.

Calcium alterations in α-syn tg mice are related to the neuronal accumulation of α-syn. a, Example images of a typical horizontal section from an α-syn tg mouse brain stained with α-syn antibody (red) and OGB1 (green). The OGB1 injection site is indicated by a white rectangle. High-resolution images inside the injection site show α-syn OGB1 staining colocalization within the injection site, as indicated by the white arrows in the merged image. b, An example of NeuN (blue) and GAD 65–67 (red) staining within the OGB1 injection site 250 ± 100 μm under the brain surface. Blood vessels are stained with fluorescein-conjugated dextran (green). Individual labels within the area marked by the white rectangle on the merged image are shown on the right. Sites of NeuN and GAD 65–67 colocalization are indicated by white arrows. c, Percentage of NeuN and GAD 65–67-immunoreactive cells in the OGB1 injection site, based on b. d, Percentage of neurons imaged 250 ± 100 μm under the brain surface in control, α-syn tg, and α-syn KO mice exhibiting calcium alterations. The error bars in c and d represent SEM. *p < 0.01.
Exacerbated stimulus-induced calcium transients in α-syn tg mice are not accompanied by an increase in spiking response
Amplification of the response amplitude during repetitive stimulation in α-syn tg neurons could indicate an increase in neuronal excitability (lack of adaptation) in the α-syn tg mice. To test this possibility, we used extracellular electrophysiological recordings of MUA (Devor et al., 2003) using the 3 Hz stimulus condition in 4 control, 4 α-syn tg, and 4 α-syn KO mice. Measurements were obtained at depths of 150–500 μm below the cortical surface, to assess changes in the neuronal population spiking response in cortical layer II/III. To quantify the spiking response, we averaged the MUA signals over stimulus trials and depth locations for each subject. Then we normalized the MUA response curves to the amplitude of the first peak and averaged the curves between subjects for the control, α-syn tg, and α-syn KO populations (Fig. 4a). The amplitude of the spiking response to subsequent stimuli decreased in all 3 groups of mice. The overall spiking response, estimated as an integral of the AUC of the group-averaged MUA curves 10–100 ms following the stimulus onset, also did not differ significantly between the groups (Fig. 4b).Together, these results demonstrate that there was no significant alteration in stimulus-induced spiking in α-syn tg mice.
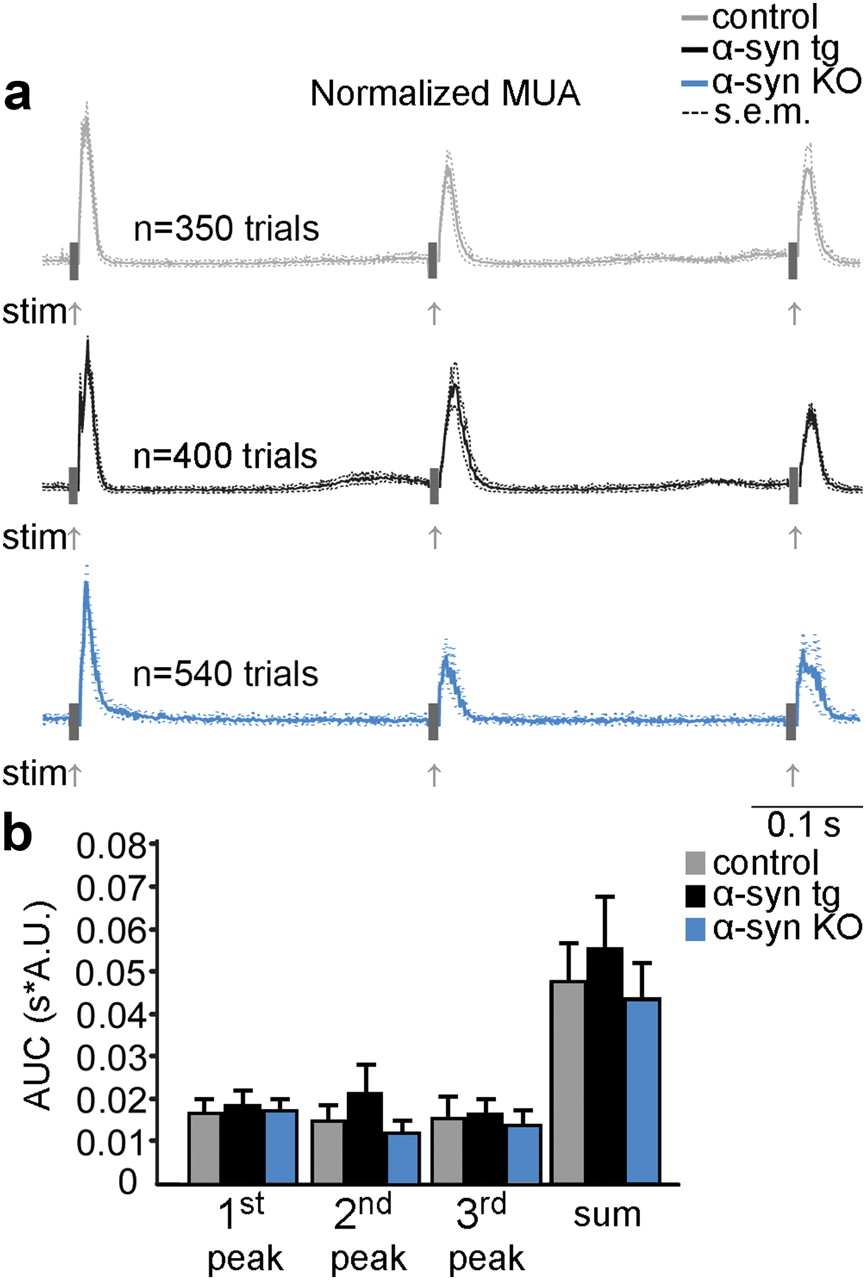
Conserved spiking response in α-syn tg mice. a, Averaged and normalized MUA for control, α-syn tg, and α-syn KO mice under the 3 Hz stimulus condition. Dashed lines indicate confidence intervals. The response to the first of the three stimuli in a train was used to normalize the amplitude between subjects. The overall number of stimulus trials across animals is indicated above the plots. The electrical stimulus artifact is covered by gray rectangles. Gray arrows indicate stimulus onset. b, The stimulus-induced increase in population spiking activity was estimated as the area under the MUA curve. The error bars represent SEM.
Discussion
The present study showed that neuronal accumulation of α-syn is accompanied by a dysregulation of spontaneous and stimulus-evoked neuronal calcium activity in vivo. Multiple mechanisms may account for calcium abnormalities in α-syn tg mice, including an increase in neuronal excitability (an increase in spiking), elevated calcium entry per spike, failure in the buffering capacity of intracellular calcium stores, and disruption of calcium extrusion from cytosol into the extracellular space. Based on the MUA measurements (Fig. 4), we rule out the increase in neuronal spiking. Further, since there was no significant difference between the α-syn tg and control mice in the peak amplitude of the averaged calcium response to a single stimulus, alteration in the amount of calcium ions entering a neuron per spike is also unlikely. This latter finding argues against a potential α-syn-induced enhancement of ryanodine receptor (RyR) and/or 1,4,5-inositol triphosphate receptor (IP3R) calcium sensitivity upon stimulation, as has been suggested for amyloid β (Aβ) peptide in Alzheimer's disease (AD) (Stutzmann et al., 2006). Likewise, although alteration in the conductivity and kinetics of transmembrane calcium channels cannot be excluded based on the present data, an increase in entry via plasmalemmal calcium channels is unlikely as it would be expected to produce an increase in the peak amplitude.
On the other hand, α-syn tg subjects differed significantly in the time course of the decay and exhibited augmented responses to repeated stimulation in the regime where consecutive stimuli were delivered before relaxation of calcium concentration to the baseline, suggesting malfunction of processes involved in clearance and buffering of cytosolic calcium. In fact, the most significant deviation of calcium responses from exponential decay in α-syn tg mice occurred during the later decay phase after the stimulus onset (Fig. 2), which could reflect the calcium buffering capacity of mitochondria (Friel and Tsien, 1994; Nicholls, 2009). This possibility is supported by findings of mitochondrial membrane potential (ΔΨm) impairment and reduction in mitochondrial ATP production in other PD-like models expressing α-syn (Marongiu et al., 2009; Esteves et al., 2011; Zhu et al., 2011). Further, the buffering capacity of endoplasmic reticulum (ER), another major calcium storage organelle, relies heavily on the ATPase activity of the sarco/endoplasmic reticulum calcium ATPase (SERCA) pump, as well as calcium extracellular clearance depends on ATPase activity of plasma membrane calcium ATPase (PMCA) (Berridge et al., 2003). Future studies will be needed to evaluate more closely the relationship between calcium, mitochondria, ER, and α-syn accumulation in vivo.
In this study, α-syn KO mice were used to provide additional evidence that neuronal calcium alterations were specific to α-syn. Although no significant differences between control and α-syn KO mice were found for evoked calcium activity and evoked spiking activity, α-syn KO mice exhibited a nonsignificant trend toward increases in the frequency and amplitude of spontaneous activity and in the fraction of imaged neurons exhibiting calcium alterations. Previous studies in α-syn KO mice reported only a mild synaptic deficit with subtle alterations in dopaminergic transmitter release (Abeliovich et al., 2000; Prasad et al., 2011). However, α-syn plays a role in the normal synaptic assembly. Therefore, its deletion might result in subtle alterations in calcium homeostasis. While in the present study we cannot dissociate the potential effects of the overexpression per se (e.g., an extra load on the intracellular transport system), calcium abnormalities in our model do not reproduce those reported in APP23xPS45 mice, which overexpress β-amyloid precursor protein (APPSwe) and mutant presenilin 1 under the control of Thy-1 promoter (Busche et al., 2008). These distinctive pathologies argue in favor of the specificity of our results.
Alterations in calcium homeostasis associated with accumulation of α-syn might render neurons vulnerable to insults, and can contribute to neurodegeneration of the excitatory cells in the neocortex and limbic system (Braak et al., 2003) underlying the nonmotor symptoms of PD and DLB patients. While specific mechanisms of synucleinopathy require further investigation, the augmented neuronal calcium activity in α-syn tg mice identified in the present study can serve as an in vivo functional imaging biomarker to track the progression of disease and evaluate therapeutic outcome of potential treatment strategies in this mouse model.
Footnotes
We gratefully acknowledge support from NIA (AG-18440 and AG-02270 to E.M.), NINDS (NS-051188 and NS-057198 to A.D. and NS-0507096 to E.M.), National Institute of Biomedical Imaging and Bioengineering (EB-009118 to A.D. and EB000790 to A.M.D.), and a Don and Marilyn Short Stein Institute for Research on Aging Foundation fellowship to L.R.
- Correspondence should be addressed to Lidia Reznichenko, Department of Neurosciences, University of California, San Diego, 9500 Gilman Drive, MTF 335, La Jolla, CA 92093-0624. lydia.reznichenko{at}gmail.com


