

Article Figures & Data
Figures
- Figure 1.
Bic/4AP application on neurons induces ERK1/2 activation. A, Neuronal p-ERKs (red) and MAP-2 (green) immunostaining performed after 30 min of Bic/4AP (Syn) incubation to drive synaptic activation (N = 3). B, Top, Immunoblot of p-ERK1/2 and ERK1/2 extracted from neuronal cultures exposed to Bic/4AP during the indicated times. Bottom, Mean (±SEM, N = 6) levels of p-ERK1/2 over time quantified from the blots as above and normalized to control (C). C, Top, Immunoblot of p-ERK1/2 on murine adult cortical slices submitted to Bic/4AP (30 min). Bottom, Mean (±SEM, N = 16) levels of p-ERK1/2 quantified from blots as above and normalized to control (C). *p < 0.05, significant difference compared with control. D, Immunoblot of PSD-95, p-MEK and p-ERK1/2 from extracts of postsynaptic fractions of cortical neurons exposed to 5 min of Bic/4AP with or without coapplication of MEK inhibitor U0126. E, Mean (±SEM, N = 3) levels of MEK and ERK1/2 phosphorylation quantified from blots as on the left and normalized (100%) to stimulated condition. Statistical analysis was performed by Kruskal–Wallis test followed by Dunn's post hoc test. *p < 0.05, significant difference compared with Bic/4AP condition.
- Figure 2.
Synaptically induced ERK1/2 phosphorylation involves synaptic GluN1/GluN2B-containing NMDARs. A, Top, Immunoblots of p-ERK1/2 and ERK1/2 from neurons in basal condition or exposed to Bic/4AP (Syn) for 15 min, in the presence or not of either TTX (0.5 μm), MK-801 (10 μm) or BAPTA-AM (20 μm). Bottom, Mean (±SEM, N = 4) levels of p-ERK1/2 and ERK1/2 quantified from blots as above under the indicated conditions and normalized to control (basal conditions, left) or Bic/4AP (synaptic, right). B, Left, [Ca2+]i was monitored by Fura-2 imaging on neuronal cultures exposed to 30 s of Bic/4AP, with or without coapplication of NMDAR antagonists (100 μm d-APV; 50 nm NVP-AAM077; 10 μm ifenprodil). Right, Mean (±SEM) Ca2+ responses quantified as the area under curve and normalized to synaptic response or d-APV (open bar)-sensitive response (N = 3; n = 103). The GluN2A- and GluN2B-sensitive responses were normalized to d-APV-sensitive response. C, Top, Immunoblots of p-ERKs and ERKs extracted from cultures submitted to 15 min of Bic/4AP (Syn) with or without NVP (50 nm) or ifenprodil (10 μm), APV (100 μm) or NVP+Ifen. Bottom, Mean (±SEM, N = 3–4) levels of p-ERK from blots as above, normalized to Bic/4AP without inhibitors. *,#p < 0.05, significant difference compared with Bic/4AP or control, respectively, after Kruskal–Wallis test followed by Dunn's post hoc test.
- Figure 3.
CaMKII is involved in synaptic NMDAR-dependent ERK1/2 activation. A, Top, Immunoblots of p-ERK1/2 and ERK1/2 from extract of neurons exposed to 30 min of Bic/4AP (Syn), with or without STO-609 (5 μm, N = 7), KN-93 (5 μm, N = 5) and CN21a (5 μm, N = 4). Bottom, Mean (±SEM, N = 4–6) levels of p-ERK quantified from blots as above and normalized to control (open bars). Statistical analysis was performed by ANOVA followed by Bonferroni-Dunn's test. *,#p < 0.05, significant difference compared with Bic/4AP and with control condition, respectively. B, Top, Developmental changes of GluN2A, GluN2B and α/βCaMKII, as measured by immunoblots from extracts of cortical neurons (DIV 7, 14, or 18) performed with an anti-α/βCaMKII, anti-GluN2B and anti-GluN2A. Bottom left, Mean (±SEM, N = 3) levels of α and βCaMKII expression quantified from blots as above.*p < 0.05, significant difference compared with 7 DIV. Bottom right, Mean (±SEM, N = 3) p-ERK1/2 levels quantified from immunoblots from neuronal cultures of the indicated DIV exposed to 30 min Bic/4AP and normalized to control (dotted line). *p < 0.05, significant difference compared with Bic/4AP at 7 DIV. Statistical analysis was performed by ANOVA followed by Bonferroni-Dunn's test. C, Left, Representative images of neurons transfected with GFP ± αCaMKII shRNA, βCaMKII shRNA, or with αCaMKII shRNA + rescue mGFP-αCaMKII, and immunostained for p-ERKs (red), after 30 min of Bic/4AP incubation (N = 3; n = 32–45). Middle, Mean (±SEM) levels of p-ERK quantified from images as in left and normalized to control. Statistical analysis was performed by ANOVA followed by Bonferroni-Dunn's test. *p < 0.05, significant difference from the fluorescence intensity of GFP-transfected cells after synaptic activation. Right, Representative immunoblot of CaMKII, p-ERK1/2, and ERK1/2 from extracts of cortical cultures infected with a lentiviral αCaMKII shRNA and exposed or not to 30 min of Bic/4AP (Syn).
- Figure 4.
αCaMKII is enriched and locked in dendritic spines after synaptic NMDAR activation. A, Representative images of a dendrite segment from a neuron cotransfected with mCherry-αCaMKII and GCaMP2 before, during, and after 5 min of Bic/4AP stimulation (black bar on top diagram). αCaMKII translocates to synaptic sites of higher Ca2+ concentrations (see arrows). B, Mean (±SEM, N = 4, n = 25–40) ΔF/F0 of mCherry-αCaMKII (fold increase relative to control before stimulation) quantified from images as in left under the indicated conditions. *p < 0.05. Statistical analysis was performed by repeated-measures ANOVA followed by Bonferroni-Dunn's test. C, Left, Sequence of images of a spine containing mGFP-CaMKII, photobleached and showing recovery of fluorescence after. Right, Diagram illustrating how to interpret FRAP plots. D, Representative FRAP curves from ROIs drawn on a spine (as in C), normalized to the intensity before photobleaching in the spine of mGFP-αCaMKII-transfected neurons, in control, after 5 min of Bic/4AP (Syn), or 30 min after Bic/4AP washout. E, Mean (±SEM, n = 7) percentage of stable (white), dynamic (gray), or unbleached fluorescence (black) fraction for mGFP-αCaMKII. Statistical analysis was performed by ANOVA followed by Bonferroni-Dunn's test. *,#p < 0.05, significant difference compared with the percentage of stable or dynamic fraction, respectively, in control condition.
- Figure 5.
αCaMKII binds GluN2B subunit in PSD fraction after synaptic NMDAR activation. A, Left, Immunoblots of PSD fractions harvested from cortical neurons exposed to 5 min Bic/4AP (Syn) or control (C). Right, Mean (±SEM) levels of αCaMKII in the indicated fractions from control (open bars) or Bic/4AP-treated cultures (5 min, gray bars). αCaMKII is significantly more recruited at the PSD after synaptic activation compared with control (*p < 0.05, two-tailed Mann–Whitney test). B, Immunoprecipitation of GluN2B, extracted from cortical neurons treated or not (C) with Bic/4AP (Syn) during 5 min, with an anti-GluN2B antibody (nAb indicates IP without GluN2B antibody). Precipitated materials were separated by SDS-PAGE and incubated with α/βCaMKII antibody. The blot is representative of three independent experiments and shows an increase of αCaMKII/GluN2B interaction after synaptic activation.
- Figure 6.
αCaMKII and GluN2B interaction is necessary for synaptically induced ERK1/2 activation. A, Left, p-ERK1/2 immunostaining (red) on cortical neurons transfected with cDNA encoding for mGFP-αCaMKII or mGFP-CaMKII I205K and treated for 30 min with Bic/4AP (N = 3–5). Right, The histogram represents the mean (±SEM) p-ERK1/2 fluorescence intensity quantified from images as shown for the indicated conditions and normalized to the untransfected condition, control (n = 15; N = 4) or I205K mutant (n = 39; N = 5). *p < 0.05, significant difference compared with untransfected neurons. B, Left, Immunoblots of p-ERK1/2 and ERK1/2 from extracts of cortical neurons exposed to 5 min synaptic activation and harvested at the indicated times of washing. Right, Mean (±SEM, N = 6) levels of p-ERK quantified from blots as in left and normalized (100%) to the value immediately after stimulation. **p < 0.01, ***p < 0.001, significant difference compared with the value obtained immediately after stimulation. Statistical analysis was performed by ANOVA followed by Bonferroni-Dunn's test.
- Figure 7.
CaMKII/GluN2B complex and ERK regulate synaptic NMDAR-dependent structural plasticity. A, Images of spines from cortical neurons transfected with cDNA encoding for mCherry-αCaMKII or mCherry-αCaMKII I205K, together with mGFP and exposed to 5 min Bic/4AP (Syn) in the presence or not of GluN2 antagonists (NVP, Ifen) or ERK inhibitor (U0126). Spine volume changes were followed before, during, and after synaptic activation. B, Mean (±SEM; N = 5–9, n = 35–72 spines) fold increase in spine volume normalized to before the stimulation (dotted lines). Statistical analyses were performed using the Wilcoxon rank sum test in MatLab (The MathWorks Inc.). #p < 0.05 compared with the spine volume before stimulation; *p < 0.05, significant difference compared with the spine volume after stimulation in control condition. Statistical analysis was performed by repeated-measures ANOVA followed by Bonferroni-Dunn's test.
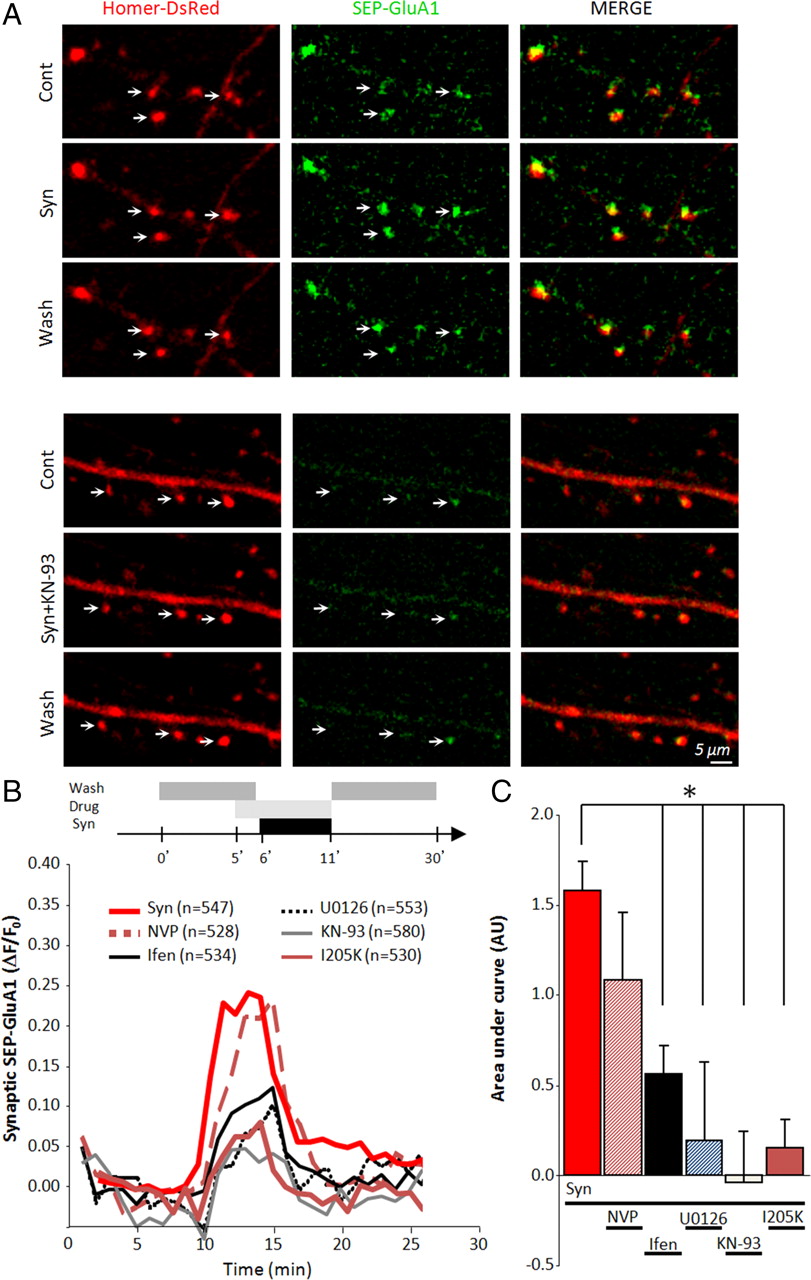
- Figure 8.
CaMKII/GluN2B complex and ERK regulate synaptic NMDAR-dependent recruitment of AMPARs. A, Time lapse images of cortical neurons transfected with Homer-DsRed and SEP-GluA1, before (Cont), after 5 min Bic/4AP (Syn ± KN93), and after 20 min of wash. B, Mean ΔF/F0 synaptic SEP-GluA1 over time measured at all Homer-DsRed-positive synapses from images as in A (N = 6; n = 530–550 synapses). The fluorescence was normalized to the mean of 16 reference images acquired before stimulation. *p < 0.05, significant difference compared with Bic/AP-treated neurons without inhibitors. C, Mean (±SEM) levels of increase in synaptic SEP-GluA1 determined by the area under each curve, between 8 and 21 min, on the graph in B. Significance between conditions was assessed by two-way ANOVA followed by a protected least significant difference Fisher test (p < 0.05).


