

Article Figures & Data
Figures
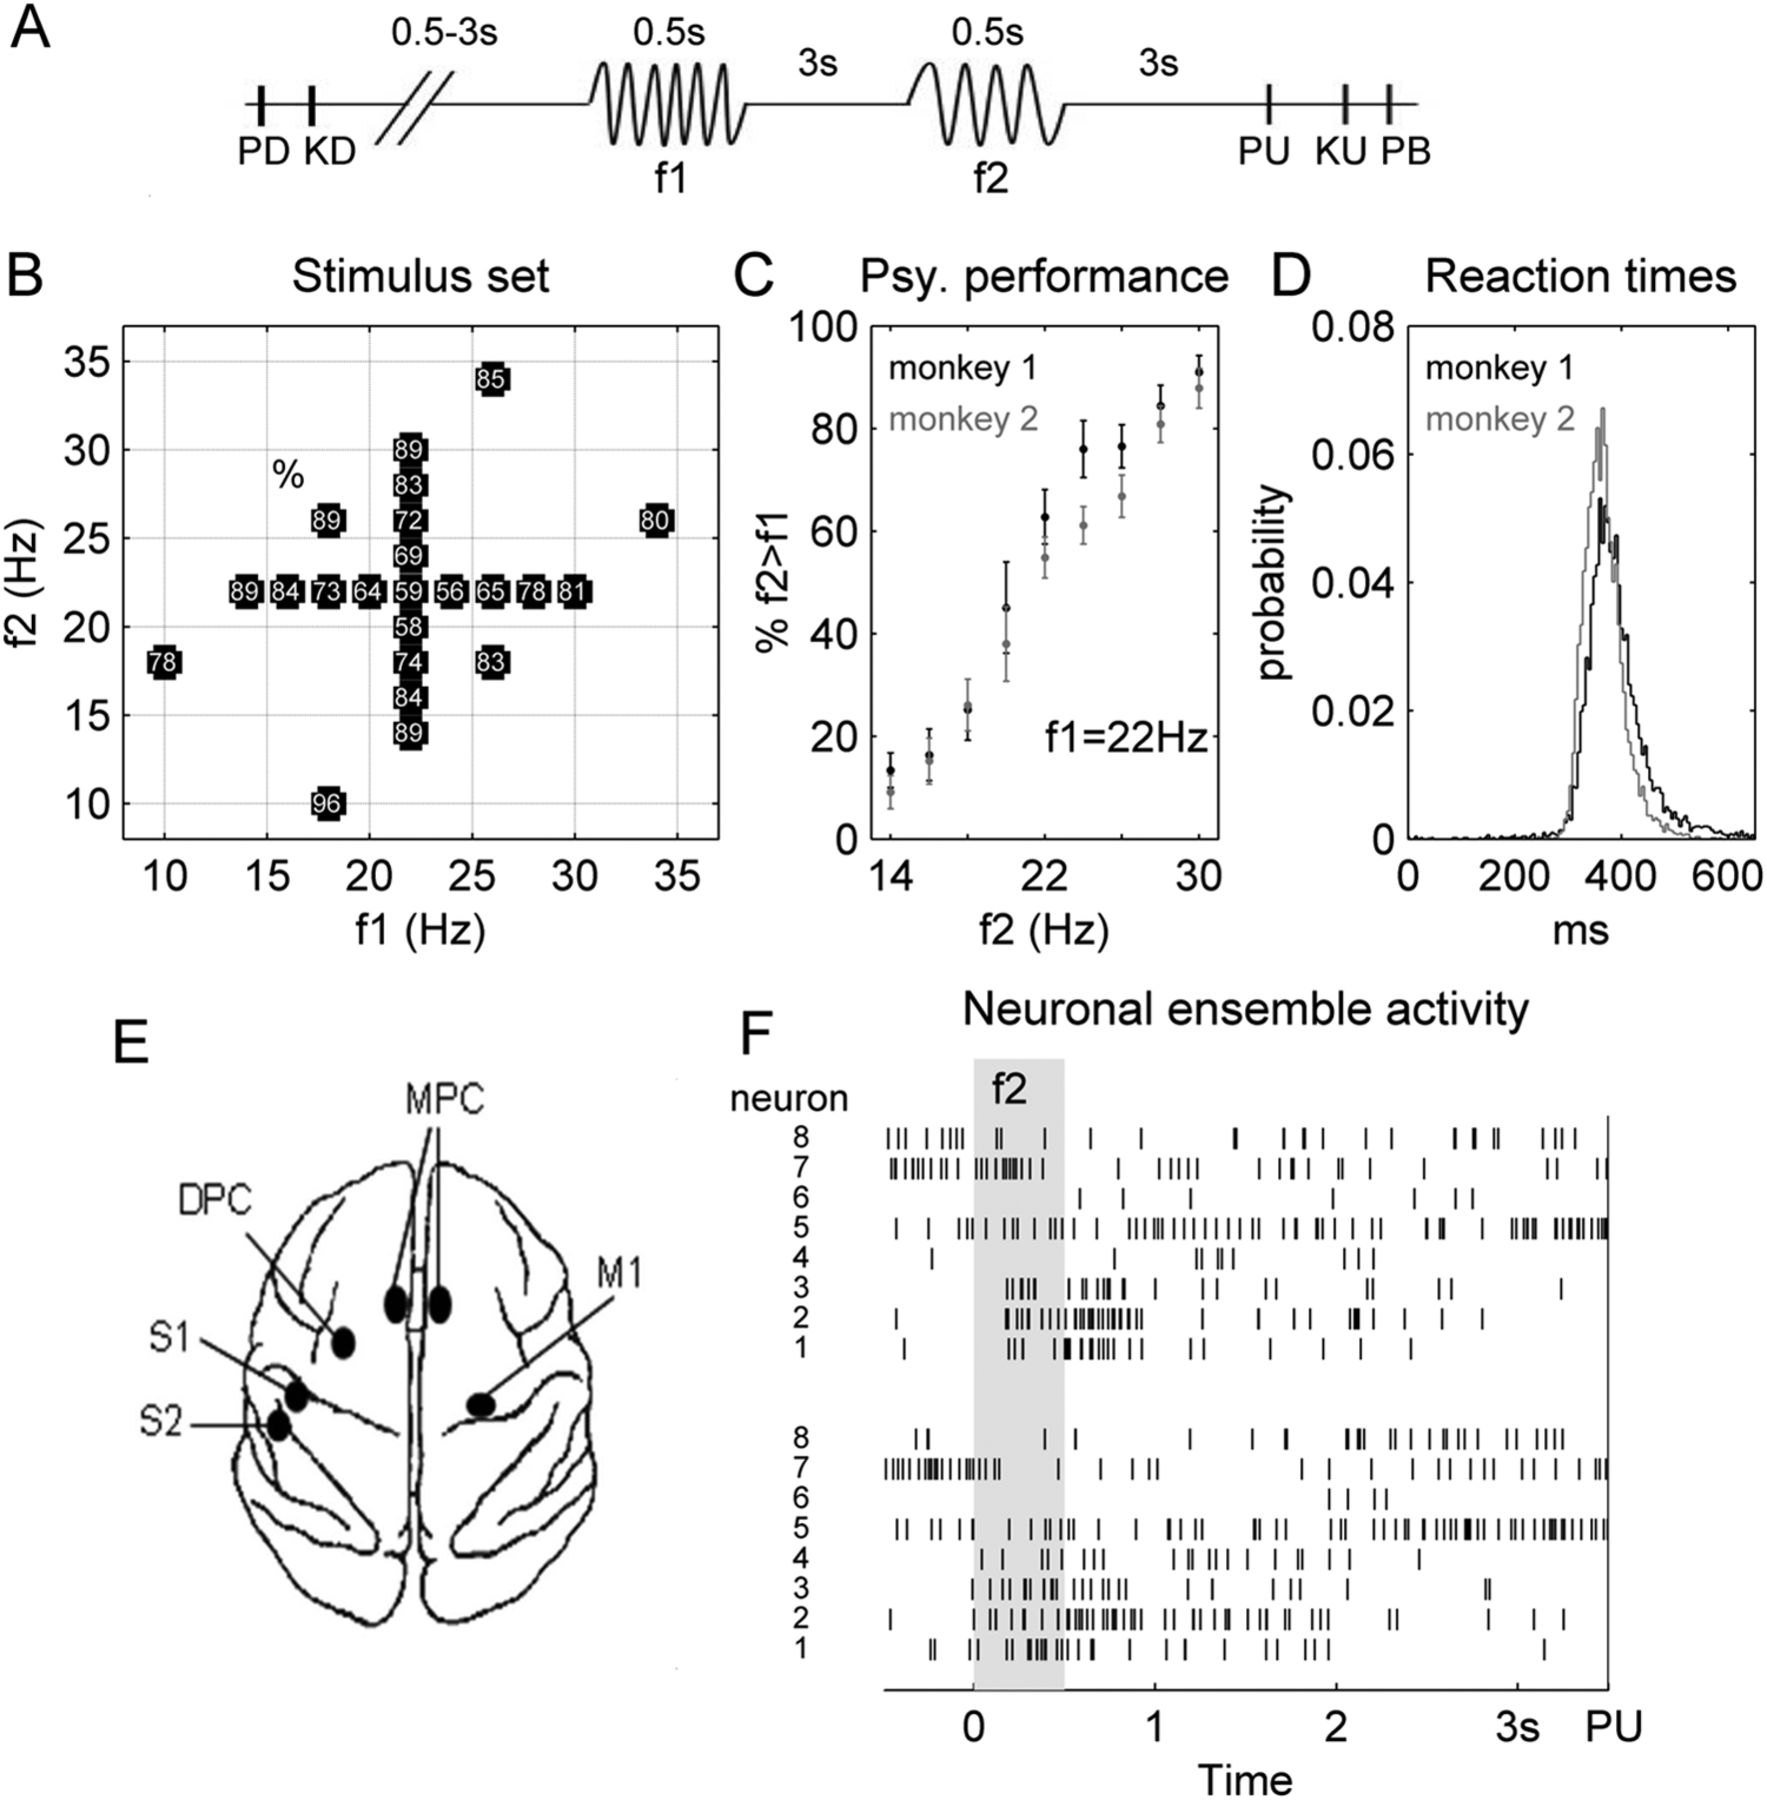
- Figure 1.
Discrimination task and neuronal ensemble activity. A, Timeline of the discrimination task. The mechanical probe is lowered, indenting the glabrous skin of one digit (PD); the monkey places its free hand on an immovable key (KD). The probe oscillates vertically, at the base frequency (f1); after a fixed delay (3 s), a second mechanical vibration is delivered at the comparison frequency (f2); after another fixed delay (3 s) between the end of f2 and probe up (PU), the monkey releases the key (KU) and presses either the lateral or medial push button (PB) to indicate whether the comparison frequency was higher or lower than the base, respectively. B, Stimulus set during recordings. Each trial type is defined by a base/comparison frequency stimulus pair. The number inside the box indicates overall percentage of correct trials for each trial type, except for the ambiguous trial type, where f1 = f2 = 22 Hz, for which we plotted the percentage of trials the animal pressed the lateral push button. C, Psychophysical performance when f1 was maintained fixed at 22 Hz and f2 was variable. The black/gray points indicate the percentage of trials in which monkey 1/2 estimated f2 higher than f1. Error bars indicate SE. D, Reaction time distributions for monkey 1/2 (black/gray traces). E, Recorded cortical areas: S1, Primary somatosensory cortex; S2, secondary somatosensory cortex; DPC, dorsal premotor cortex; MPC, medial premotor cortex; M1, primary motor cortex (notations used in all following figures). F, The series of black ticks represent the spike trains of 8 M1 neurons recorded simultaneously. The NE activity, during the period between t(f2) − 0.5 s and PU is plotted for two trials of the same trial type (f1 = 18 Hz and f2 = 26 Hz). The gray area corresponds to the presentation of f2.
- Figure 2.
State sequences of sensory NEs. For each NE, two HMMs were estimated using 15 trials from condition f1 < f2 and f1 > f2, respectively. One example NE activity of S1 (A) and S2 (B) are shown. For each condition, the ensemble spiking activity (black ticks) is shown together with the most likely sequence of states (each color represents a state visitation) for five trials. The histograms below the state sequences represent the three firing rate states of each of the two models. Each state is defined as a vector of N firing rates, one for each neuron of the ensemble (in these examples: N = 7 for both S1 and S2 NEs). Notice that, in A and B, light blue and yellow states appeared very transiently.
- Figure 3.
State sequences of frontal lobe NEs. For each NE, two HMMs were estimated using 15 trials from condition f1 < f2 and f1 > f2, respectively. In A–C, one example NE activity of each frontal lobe cortical area is shown. For each condition, the ensemble spiking activity (black ticks) is shown together with the most likely sequence of states (each color represents a state visitation) for five trials. The histograms below the state sequences represent the three firing rate states of each of the two models. Each state is defined as a vector of N firing rates, one for each neuron of the ensemble (in these examples: N = 6, 11, 8 for DPC, MPC, M1, respectively).
- Figure 4.
Response decoding. A, The response decoding performances, using HMMs with three states, were calculated for all analyzed NEs from each cortical area in the discrimination task (blue distribution) and the control task (gray distribution). Red vertical line, Chance level (50%). The percentage of significant performances is indicated for both the discrimination (blue) and the control task (gray). Values in parentheses indicate the percentage of significant performances obtained using a reduced testing subset of discrimination trials (see text for details). B, Same as A, but using HMMs with four states. C, The different panels compare the decoding performance in error trials with the one obtained in correct trials (see text for details). Only S2 and frontal lobe NEs that had significant decoding performance in correct trials and were recorded in sessions with ≥10 error trials were used. Gray points, Significant decoding in error trials. The percentages of significant decoding on error trials are indicated.
- Figure 5.
Dynamics of differential activity. A, ROC indices were calculated in sliding windows of 500 ms, which were shifted in steps of 50 ms. The percentages of neurons with significant ROC indices are plotted for the frontal lobe cortices, in the discrimination task (black) and the control task (gray). B, For each area, we selected those neurons that had at least one significant ROC index between f2 onset (red vertical line) and PU, and sorted them by the time at which the first significant ROC index appeared after f2 onset. C, D, ROC indices of seven simultaneously recorded M1 neurons (C) and nine simultaneously recorded MPC neurons (D) (colored lines). The circles represent significant values. Time windows during which the mean firing rate of the neuron was <5 Hz were left aside.
- Figure 6.
Ensemble activity as a Markov chain. A, The number of HMM states was estimated using the BIC procedure, which penalizes the likelihood of the model (black) by a measure of its complexity. The estimated number of states is the one for which the BIC score (gray) is maximal. Shown are data from an example ensemble of M1 neurons. B, The spiking activity of the example ensemble of M1 neurons is presented together with the likelihood of each state (colored lines) for four trials. Inset, The periods during which none of the states had likelihood larger than 0.8 were defined as transition periods (gray area). The inset corresponds to the epoch framed in B. C, The bars indicate the averaged duration of transition periods and averaged state duration for all analyzed NEs of a given cortical area and for each monkey. Error bars indicate SE. D, The Viterbi state sequences were determined for each trial with f1 = 26 Hz and f2 = 34 Hz, and the percentage of neurons with significantly different mean firing rates in different states (p < 0.01, ANOVA) was calculated (similar results were obtained using other trial types). E, For each cortical area, the probability of finding a transition was calculated using a sliding window of 100 ms (data from both monkeys). The shaded area represents the application of f2.
- Figure 7.
Coherent transitions. A, The spiking activity (black ticks), together with the probabilities of each state (blue and green traces) and the Viterbi sequence of states (top) are shown for one example NE from each cortical area, for three trials of the same trial type. The shaded gray region indicates the presentation of f2. B, C, The raster displays (top) represent the spiking activity of two neurons from the same MPC NE (consisting of 4 neurons recorded simultaneously), for seven correct trials. Each black tick corresponds to a spike, and the red ticks correspond to the time of the first transitions after f2 onset (vertical gray line). Trials were rearranged according to increasing transition times. The PSTHs of the neurons are plotted in the bottom panels.
- Figure 8.
Transition duration for the empirical, ideal, and shuffled datasets. For each value of Δf, the averaged transition period between states was calculated for the empirical dataset and the two pseudodatasets, for sensory (A) and frontal lobe NEs (B). The three averaged transition periods were compared, for each Δf (ANOVA). The red stars indicate significant differences between empirical and ideal averaged transition periods (p < 0.01, Tukey's test). The white stars indicate significant differences between empirical and shuffled averaged transition periods (p < 0.01, Tukey's test). The color plot indicates the expected transition durations for artificial ramps with different periods of ramping τ. Artificial ramps were constructed using nonhomogeneous Poisson processes that linearly changed from a constant firing rate state 1 to a constant firing rate state 2. The two rate configurations were the ones given by the HMM states that were estimated with the experimental spike trains, for each NE and for each trial type.
- Figure 9.
Transition statistics and task difficulty. The averaged transition latency (A) and transition variability (B) were calculated for the NEs of each cortical area and for each value of Δf. Error bars indicate SE. C, The transition latencies for an example NE from MPC were grouped according to the evidence (Δf, color code) of the trials in which they occurred. Each filled point represents a trial; the squares indicate the mean latency for each value of Δf. Note the decrease of both latency and variability for increasing values of Δf. The shaded area represents the application of f2.


Tables
- Table 1.
Frequencies of selecting a number of hidden states using the BIC criterion for correct trials with f1 = 26 Hz and f2 = 34 Hz in the observation window between t(f2) − 0.5 s and PU
No. of states No. of neurons (median) 1 (%) 2 (%) 3 (%) 4 (%) 5 (%) 6 (%) S1 (n = 64) 0 40.6 31.3 17.2 4.7 6.2 5 S2 (n = 58) 0 24.1 37.9 20.7 13.8 3.5 6 DPC (n = 35) 14.3 28.6 45.7 11.4 0 0 5 MPC (n = 49) 6.1 18.4 57.1 14.3 2.0 2.0 5 M1 (n = 58) 5.1 13.8 53.5 13.8 10.3 3.5 5 All (n = 264) 4.2 25.4 44.3 15.9 6.8 3.4 5 Maximal frequencies are indicated in bold. The last column indicates the median number of neurons in the NEs of each cortical area. n, Number of NEs.
- Table 2.
Frequencies of selecting a number of hidden states using the BIC criterion in the observation window between t(f2) − 0.2 s and t(f2) + 1 s
No. of states Evidence 1 (%) 2 (%) 3 (%) 4 (%) Δf (Hz) S1 (n = 64) 3.5 69.5 22.7 4.3 2 2.3 62.9 26.9 7.8 4 2.0 57.8 32.0 8.2 6 0.8 55.8 31.4 12.0 8 S2 (n = 58) 10.8 60.3 26.3 2.6 2 5.6 62.5 23.7 8.2 4 4.3 53.0 30.6 12.0 6 3.6 53.8 35.0 7.6 8 DPC (n = 18) 33.3 56.9 9.7 0 2 19.4 68.1 12.5 0 4 6.9 75.0 16.7 1.3 6 16.7 67.2 15.0 1.1 8 MPC (n = 20) 37.5 53.8 7.5 1.3 2 26.3 65.0 8.8 0 4 18.8 70.0 11.2 0 6 18.0 68.5 10.5 3.0 8 M1 (n = 40) 33.8 56.9 6.9 2.5 2 30.0 56.9 10.0 3.1 4 20.6 63.8 10.62 5.0 6 19.8 63.0 14.3 3.0 8 Models were estimated using all correct trials from each trial type, for one to four states. The frequencies of selecting a number of states were calculated among trials of same evidence (Δf = |f2 − f1|). Maxima are indicated in bold. n, Number of NEs.
- Table 3.
Number of significant (p < 0.05) pairwise correlations between transition latencies in simultaneously recorded NEs from different cortical areas
S2 DPC MPC M1 S1 4 of 55 1 of 15 1 of 17 0 of 24 S2 2 of 16 1 of 17 4 of 25 DPC 0 of 5 2 of 5 MPC 0 of 11


