

Article Figures & Data
Figures
- Figure 1.
Setup for experiment 1. A, The participant's right hand was placed on a tilted table in front of them, on either the left or the right of a central fixation point (black cross). A three-dimensional object was presented to either the left or the right of the fixation point. The resulting 2 × 2 factorial design allowed direct testing for the selective encoding of the object within the peri-hand space (yellow halo around the hand). B, In each trial, the object appeared in one of the two locations for 6 s, with a jittered intertrial interval (7 ± 4 s) with no stimulation.
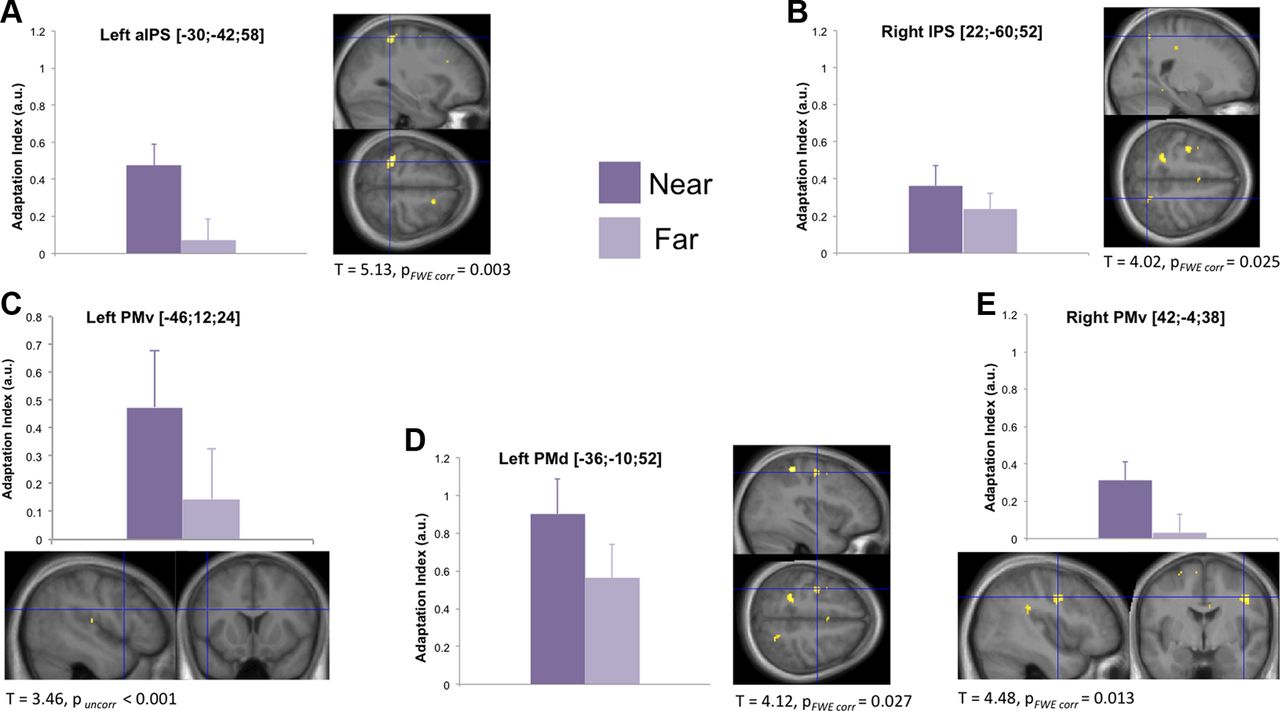
- Figure 2.
Selective BOLD adaptation in response to an object presented near the hand for different hand positions. The IPS bilaterally (A, B), left PMd (D), and bilateral PMv (C, E) showed significantly stronger adaptation to the object presented near rather than far from the hand (p < 0.05 corrected; contrast: {[(ORfirst vs ORsecond)HR + (OLfirst vs OLsecond)HL] vs [(ORfirst vs ORsecond)HL + (OLfirst vs OLsecond)HR]; see Materials and Methods). The bar graphs report the average adaptation index, calculated as the difference in contrast estimates between the first and the second presentation of the object, for near and far conditions (dark and light color, respectively; error bars represent SEM). The activation maps thresholded at p < 0.001 uncorrected for display purposes and superimposed onto the average anatomical high-resolution T1-weighted MRI image of the participants' brains. The detailed statistics after correction for multiple comparisons are reported for each key area. aIPS, Anterior IPS; FWE, familywise error.
- Figure 3.
Effect size of BOLD adaptation for individual conditions. The bar graphs report the adaptation index, calculated as the difference in contrast estimates between the first and the second presentation of the object, for each of the four conditions used to define the interaction contrast in the factorial design (blue bars refer to the conditions with the hand to the left and red bars to the conditions with the hand to the right; error bars represent SEM; the corresponding activation map is shown in Fig. 2). aIPS, Anterior IPS.
- Figure 4.
Descriptive mapping of contrast estimates for the spatial encoding of visual stimuli. The figure displays areas showing BOLD adaptation to the visual stimulus using a gradient indexing the degree of hand-centered encoding (0 represents absence of hand-centered responses, whereas larger values represent stronger hand-centered encoding). Although early visual areas adapted to the object independently of its position relative to the hand, the posterior parietal and premotor cortices showed a high degree of hand-centered encoding. The anatomical labels correspond to the regions in which the hand-centered responses were statistically significant (interaction contrast; shown in Fig. 2). The map was derived as follows. We computed the difference between the contrast estimates for the interaction and each of the main effects of visual stimulation on the left or right side (see Materials and Methods). We then selected the minimum value of the two differences and assigned that to the corresponding voxel. The values were then rescaled into a color map starting from zero and overlaid onto the inflated cortical surfaces of the standard brain. We restricted this analysis to voxels showing a basic response to the presentation of the visual stimuli (by using the inclusive mask from the contrast “all visual stimuli vs baseline,” thresholded at p < 0.001 uncorrected). SMG, Supramarginal gyrus.
- Figure 5.
Setup for experiment 2. A, The participant's right hand was placed on the same tilted support as used in experiment 1. A rubber hand was placed to the left of the fixation point, in a position equivalent to the left position of the real right hand in experiment 1. A light-emitting diode served as the fixation point (black cross). Two paintbrushes were used to deliver synchronous or asynchronous visuotactile stimulation (top and bottom part, respectively). The spherical object (identical to that in experiment 1) was presented close to the rubber hand. B, A mixed block- and event-related design was used (see Materials and Methods) V-T, Visuotactile.
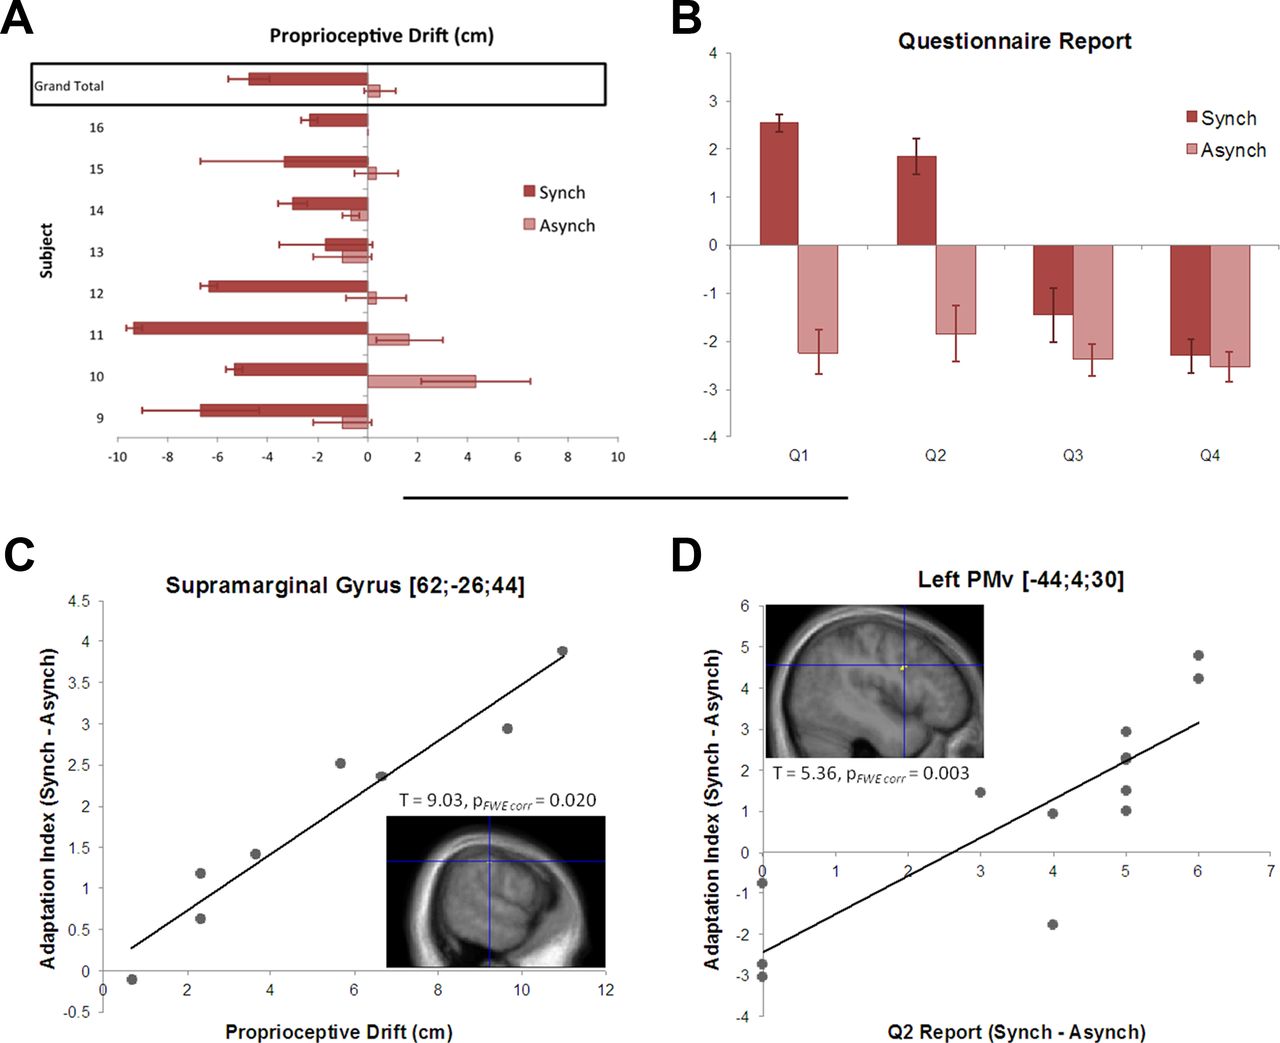
- Figure 6.
Correlations between behavioral percepts of the illusion and neural hand-centered remapping. A, Individual proprioceptive drift and group average. The bars represent the difference between post- and pre-measurements (negative values more to the left, positive values more to the right), in the synchronous and the asynchronous condition (average of 3 trials; error bars represent SEM). The drift was significantly larger in the synchronous than in the asynchronous condition (drift in the synchronous condition: −4.75 ± 2.6 cm, 2-tailed t test against 0, t = 4.53, p = 0.001; drift in the asynchronous condition: 0.5 ± 1.78, 2-tailed t test against 0, t = 0.12, p = 0.45). B, Participants were asked to rate four statements on a scale from −3 (“completely disagree”) to +3 (“agree completely”) after 1 min of synchronous or asynchronous stimulation. They reported stronger illusory referral of touch to the rubber hand after the synchronous condition compared with the asynchronous one (Q1, Wilcoxon's signed-rank test, n = 13, Z = 3.18, p = 0.002). They also experienced a significantly stronger sense of ownership over the prosthetic hand after the synchronous than the asynchronous condition (Q2, Wilcoxon's signed-rank test, n = 13, Z = 2.80, p = 0.005). C, A whole-brain second-level regression model revealed a significant linear relationship (p < 0.05 corrected) between the proprioceptive drift toward the rubber hand and the effect size of the BOLD-adaptation response indexing hand-centered remapping to the rubber hand across individuals (contrast described in Fig. 7 and Materials and Methods). D, Significant linear regression (p < 0.05 corrected) between the subjectively rated strength of ownership (questionnaire data) and the BOLD-adaptation response indexing hand-centered remapping to the rubber hand across individuals. FWE, Familywise error.
- Figure 7.
Differential BOLD adaptation to an object presented near the prosthetic hand after the synchronous and asynchronous induction periods. The right IPS (A), PMv bilaterally (B, C), and the putamen bilaterally (D, E) exhibited significantly stronger BOLD adaptation to the repeated presentation of the ball near the prosthetic hand after the synchronous compared with the asynchronous condition. The bar graphs plot the effect size of the adaptation, for the synchronous and asynchronous conditions, separately (dark and light color, respectively; error bars represent SEM). aIPS, Anterior IPS; FWE, familywise error.


Tables
Anatomical location MNI coordinates Peak x y z t value p value L. anterior part of IPS −30 −42 58 5.13 0.003 R. IPS 22 −60 52 4.02 0.025 L. precentral gyrus (PMd) −36 −10 52 4.12 0.027 R. precentral gyrus (PMv) 42 −4 38 4.48 0.013 L. precentral sulcus (PMv) −46 12 24 3.46 <0.001* R. lateral parietal operculum 44 −34 24 4.49 <0.001* R. putamen 20 2 14 3.31 0.001* ↵*Uncorrected for multiple comparisons. Interaction contrast: {[(ORfirst vs ORsecond)HR + (OLfirst vs OLsecond)HL] vs [(ORfirst versus ORsecond)HL + (OLfirst versus OLsecond)HR]}.
Anatomical location MNI coordinates Peak x y z t value p value R. anterior IPS/postcentral junction 56 −30 50 5.47 0.005 L. precentral gyrus (PMv) −50 4 36 5.48 0.007 R. precentral gyrus (PMv) 50 −4 38 3.90 0.042 L. putamen −20 6 0 5.34 0.009 R. putamen 20 12 −8 5.09 0.037 R. lateral parietal operculum 48 −10 24 5.40 <0.001* L. IPS −28 −74 50 3.90 <0.001* L. supramarginal gyrus −60 −28 34 3.73 0.001* ↵*Uncorrected for multiple comparisons. [(Synchfirst vs Synchsecond) vs (Asynchfirst vs Asynchsecond)].


