
Abstract
Depressed cortical energy supply and impaired synaptic function are predominant associations of Alzheimer's disease (AD). To test the hypothesis that presynaptic bioenergetic deficits are associated with the progression of AD pathogenesis, we compared bioenergetic variables of cortical and hippocampal presynaptic nerve terminals (synaptosomes) from commonly used mouse models with AD-like phenotypes (J20 age 6 months, Tg2576 age 16 months, and APP/PS age 9 and 14 months) to age-matched controls. No consistent bioenergetic deficiencies were detected in synaptosomes from the three models; only APP/PS cortical synaptosomes from 14-month-old mice showed an increase in respiration associated with proton leak. J20 mice were chosen for a highly stringent investigation of mitochondrial function and content. There were no significant differences in the quality of the synaptosomal preparations or the mitochondrial volume fraction. Furthermore, respiratory variables, calcium handling, and membrane potentials of synaptosomes from symptomatic J20 mice under calcium-imposed stress were not consistently impaired. The recovery of marker proteins during synaptosome preparation was the same, ruling out the possibility that the lack of functional bioenergetic defects in synaptosomes from J20 mice was due to the selective loss of damaged synaptosomes during sample preparation. Our results support the conclusion that the intrinsic bioenergetic capacities of presynaptic nerve terminals are maintained in these symptomatic AD mouse models.
Introduction
Alzheimer's disease (AD) is characterized by memory loss, dementia and a pathology consisting of extracellular plaques containing β-amyloid (Aβ) peptide and intracellular neurofibrillary tangles containing phosphorylated tau protein. Early bioenergetic effects, preceding neuropsychological or anatomical changes, have been monitored in vivo using positron emission tomography and functional magnetic resonance imaging, and these reveal a decrease in cerebral blood flow and glucose uptake consistent with a decreased metabolic demand (Chandrasekaran et al., 1996), although in the early stages brain metabolism can be activated almost normally by a recognition task. AD is accompanied by a progressive loss of synaptic contacts, detected by the loss of synaptophysin (Chandrasekaran et al., 1996), and it is clearly important to establish whether this is a cause or an effect of the decreased energy demand.
Isolated nerve terminals (synaptosomes) can be prepared from specific brain regions of animals of any age, and therefore possess advantages over neonatal primary cultures for the study of age-related disorders. The preparation can be criticized for its heterogeneity, but advances in our group allowing respiratory variables of microgram quantities of synaptosomes to be analyzed (Choi et al., 2009) in parallel with single synaptosomal functional imaging (Choi et al., 2011), combined with exhaustive quality control, have greatly improved the precision with which bioenergetic functionality can be compared between populations.
Current mouse models have been developed by reproducing mutations responsible for rare inherited forms of the human disease, and mutations in amyloid precursor protein (APP), presenilin (PS) and tau genes have been explored separately and in combination. In this study we examined J20, Tg2576 and APP/PS mouse strains, which recapitulate a range of histopathological and behavioral symptoms of human AD (Galvan et al., 2006, 2008; van Groen et al., 2006; Hermann et al., 2009) to determine whether synaptosomes from mice bearing a range of AD-like phenotypes have impaired bioenergetics and, if so, how observed bioenergetic defects are related to AD pathogenesis. Using in situ respirometry and single-synaptosome fluorescence microscopy, we find that synaptosomes from symptomatic J20, Tg2576 and APP/PS mice exhibit normal respiratory variables, membrane potentials, mitochondrial volume fraction and tolerance to calcium stress, indistinguishable from wild-type mice. An exception to this was an increased respiration associated with proton leak observed only in APP/PS mice cortical synaptosomes. The validity of our results was reinforced by assessing the purity and the viability of synaptosome preparations and by verifying no preferential loss or accumulation of damaged synaptosomes.
This somewhat unexpected result obtained after a uniquely comprehensive series of controls must be reconciled with a literature reporting a deterioration of mitochondrial functions in transgenic mouse models of AD. Recently, impaired respiration of brain mitochondria isolated from mice with AD phenotypes was reported (Gillardon et al., 2007; Hauptmann et al., 2009; Yao et al., 2009; Du et al., 2010). However, there is no compelling evidence for or against mitochondrial bioenergetic decline in synaptosomes, which are expected to resemble the mitochondrial phenotype in vivo more closely than isolated mitochondria.
Materials and Methods
Reagents.
Tetramethylrhodamine methyl ester (TMRM), MitoTrackers, calcein-AM, and fura-4F AM were from Invitrogen. Other reagents were from Sigma-Aldrich, unless otherwise stated.
Animals.
J20 (PDAPP APPSwe/Ind J20, 6 months old), Tg2576 (Tg(APPSWE)2576Kha, 16 months old), and APP/PS double mutant (B6.Cg-Tg(APPswe, PSEN1dE9) 85Dbo/J, 9 or 14 months old) were used. Except Tg2576, for which only females were used due to their gender-dependent pathogenic progression (Callahan et al., 2001), mixed gender (approximately half male and half female) was used. Results from all animals were compared with those from appropriate age-matched wild-type (WT) controls. The animal protocol was approved by the Buck Institute Animal Care and Use Committee, in accordance with Institutional Animal Care and Use Committee standards.
Synaptosome preparation, respirometry, mitochondrial volume fraction in synaptosomes, and quantification of respiration-competent synaptosomes.
Cortical or hippocampal synaptosome preparation, respiration measurement, and quantification of mitochondrial volume fraction and respiration-competent synaptosomes in synaptosome preparations were as previously described (Choi et al., 2009, 2011).
Measurement of intracellular calcium concentration ([Ca]i) in individual synaptosomes.
Cortical or hippocampal synaptosomes attached to coverglass-bottomed microplates (0.25 μg protein/well) were incubated with 25 nm MitoTracker Red (MTR) and 2 μm fura-4F AM in M buffer (containing, in mm: 3.5 KCl, 120 NaCl, 0.4 KH2PO4, 1.2 Na2SO4, 15 d-glucose, 10 pyruvate, 10 TES, pH 7.4) for 30 min at 37°C. Excess fluorescent probes were removed by aspiration, fresh M buffer with 1.3 mm CaCl2 and 0.4% (w/v) fatty acid-free bovine serum albumin was added, and wide-field images were acquired in a Nikon Eclipse Ti-PFS inverted epifluorescence microscope with the filters (excitation − dichroic mirror − emission in nm/bandwidth) for MTR (582/15 − 593–610LP, 100 ms exposure time) and fura-4F [340/26 (500 ms) and 387/11 (250 ms) − 409 − 510/84]. Eight time points were acquired at 5 min intervals, and the calcium stressor [high extracellular calcium (voca) or high extracellular potassium and calcium (kca)] was applied after acquisition of the second time point. The fura-4F fluorescence images were gated to show only objects with MTR fluorescence, segmented to obtain the values from individual synaptosomes, and then the final fura ratio (340/387 nm) was calculated for each synaptosome. Images were analyzed as previously published (Choi et al., 2011) using Image Analyst MKII.
The fura ratio (R) was converted to concentration using the equation [Ca2+] = Kd · [(R − Rmin)/(Rmax − R)] · Ffree387/Fsat387 (Grynkiewicz et al., 1985) as follows. Cortical synaptosomes from wild-type adult mouse were attached to coverglass-bottomed microplates as described above. Medium was switched to mixtures of media containing 0 or 10 mm CaCl2, 10 mm EGTA, 123 mm KCl, 12.4 mm NaCl, 20 mm PIPES, pH 7.2 adjusted using KOH, supplemented with 20 μm 4Br-A23187 (AG Scientific), 10 μm nigericin, 10 μm monensin, and 1 μm antimycin A to establish complete equilibration of [Ca2+] and pH (Gerencser and Adam-Vizi, 2005). Free [Ca2+] of appropriate mixtures of the media (1:10 to 10:1) were calculated using WEBMAXC v2.10 (Stanford University, Stanford, CA). Using synaptosomes in separate wells, the fura ratio was measured at zero (Rmin), saturating (Rmax), and the above set [Ca2+]ex (R). Then linear regression was used to calculate the value of Kd · Ffree387/Fsat387. The resulting standard curve was used to calibrate [Ca2+]i in all other wells.
Measurement of synaptosomes with [Ca]i dysregulation.
Cortical or hippocampal synaptosomes attached to coverglass-bottomed microplates (0.25 μg protein/well) were incubated with 25 nm MTR and 2 μm fura-4F AM in M buffer and the fura ratio from synaptosomes was obtained as described above. Then, the number of synaptosomes with a fura ratio >3 ([Ca]i >10 μm) per image view was counted, divided by the total number of synaptosomes per view, and multiplied by 100 to generate the percentage value. This was performed by automatic segmentation of MTR images in Image Analyst MKII.
Wide-field imaging of membrane potential.
Cortical or hippocampal synaptosomes attached to coverglass-bottomed microplates (0.25 μg protein/well) were incubated in the continuous presence of 5 nm TMRM and 1 μm tetraphenylboron (TPB−) in M buffer with 1.3 mm CaCl2 and 0.4% (w/v) fatty acid-free bovine serum albumin at 37°C. After 40 min preincubation, six time points were acquired at 5 min intervals, cyclically visiting ∼24 wells at each time point, as detailed above for MTR. Each of two “calcium stressors” [1 μm veratridine/100 μm ouabain, 10 mm CaCl2 (voca) or 30 mm KCl/10 mm CaCl2 (kca)] was applied after acquisition of the first time point. The change in TMRM fluorescence intensity reflects changes in both plasma membrane and mitochondrial membrane potentials and was converted to millivolts relative to the baseline using the formula 26.7 mV × ln(F/F0), where F is TMRM fluorescence and F0 is its baseline (Gerencser and Nicholls, 2008).
Measurement of 12C- and 13C-labeled synaptosomal proteins by mass spectrometry.
WT mice were fed a commercial pellet diet containing 13C6-lysine (97%) and J20 mice were fed an identical diet containing 12C6-lysine (products 230924630 and 230004600, Silantes GmbH) for 10 d. Cortex tissue and cortical synaptosomes were prepared and total proteins were isolated for mass spectrometry (MS) analysis using a protocol adapted from Addona et al. (Addona et al., 2009). Samples were lysed in 8 m urea with 30 mm dithiothreitol, followed by reduction/denaturation for 30 min at 37°C, cooled to room temperature, and alkylated with 55 mm iodoacetamide in the dark for 30 min. Protein preparations were diluted tenfold with 100 mm Tris, pH 8.0, digested with Trypsin Gold (Promega) at a 1:25 trypsin-to-protein weight ratio for 18 h at 37°C and desalted using a C18 ZipTip (Millipore). The resulting peptide samples were analyzed by electrospray HPLC-MS/MS (tandem MS) using the Triple TOF 5600, a hybrid quadrupole time-of-flight mass spectrometer (AB SCIEX) that was connected to an Ultra nanoLC-2D plus HPLC and autosampler (Eksigent). Peptide mixtures were injected directly onto the analytical C18-nanocapillary HPLC column (C18 Acclaim PepMap100, 75 μm inner diameter × 15 cm, 3 μm particle size, 100 Å pore size; Dionex) and eluted at a flow rate of 300 nl/min using the following gradient: 3% (v/v) solvent B with solvent A making up the difference (from 0 to 13 min), 3–7% solvent B (from 13 to 16 min), 7–25% solvent B (from 16 to 48 min), 25–40% solvent B (from 48 to 65 min), 40–90% solvent B (from 75 to 85 min), and at 90% solvent B (from 85 to 95 min), with a total runtime of 130 min (including mobile phase equilibration). Solvent A consisted of 0.1% (v/v) formic acid in 98% H2O, 2% acetonitrile; solvent B consisted of 0.1% formic acid in 98% acetonitrile, 2% H2O. Mass spectra and tandem mass spectra were recorded in positive-ion and “high-sensitivity” mode with a resolution of ∼35,000 full-width half-maximum. Nanospray needle voltage was 2400 V in HPLC-MS mode; the mass window for precursor ion selection was ±1 m/z. Data-dependent MS/MS acquisition was performed for the 15 most abundant precursor ions following each MS scan. Spectral data were analyzed with Protein Pilot 4.0 (AB SCIEX), with the following parameters: sample type SILAC (Lys+6), quantitation mode, urea denaturation, and species Mus musculus. Spectra were searched against SwissProt 2011 database using 95% confidence and a false discovery rate of <0.05. Tryptic peptides from the following presynaptic nerve terminal-specific marker proteins (Igarashi and Ohko, 2009) were identified and quantified in homogenates of both whole cortex and synaptosomes: synapsin-1 (three peptides: QGPPQKPPGPAGPTR, EMLSSTTYPVVVK, VLLVIDEPHTDWAK), synapsin-2 (two peptides: QLITDLVISK, EMLTLPTFPVVVK), synaptophysin (one peptide: LHQVYFDAPSCVK), SNAP-25 (three peptides: IEEGMDQINK, MLQLVEESK, MLQLVEESKDAGIR), synaptotagmin-1 (four peptides: TLNPVFNEQFTFK, MDVGGLSDPYVK, VQVVVTVLDYDK, LTVVILEAK), and syntaxin binding protein-1 (two peptides: LAEQIATLCATLK, NGITEENLNK).
Statistics.
Data are means ± SE for n biological replicates each comprising 2–10 technical replicates. Effects of genotype on particular bioenergetic variables were tested by unpaired two-tailed Welch t test. The statistical power of significant differences was typically >0.8 for α = 0.05 (two-tailed). To indicate the sensitivity of the measurements for nonsignificant differences, one-tailed confidence intervals (CIs) were calculated to express the percentage decline that could be detected with 95% probability (see table legends and subscripts after SE in the text). To find consistent effects of the AD transgene in multiple ages or treatments, two-way ANOVA was performed, independently for each respiratory variable (as they were not independent). To do this, one category was genotype (control or transgenic), and the other was age (see below, Table 1) or pretreatments (see below, Table 2).
Respiration of intrasynaptosomal mitochondria in transgenic mouse models with AD-like phenotypes
Change in spare respiratory capacity by increased intracellular calcium influx
Results
Mitochondrial respiration in synaptosomes isolated from transgenic mice with AD-like phenotypes compared with wild type
First, we investigated whether there were changes in the respiration of mitochondria in different states in situ in presynaptic nerve terminals isolated from mice with AD-like pathology. We used cortical and hippocampal synaptosomes prepared from three of the most widely used transgenic mouse models of AD, with well characterized symptoms. J20 mice age 6 months, Tg2576 mice age 16 months and APP/PS double mutant mice age 9 or 14 months were all selected as “fully symptomatic,” based on the literature (Jankowsky et al., 2004; Galvan et al., 2006, 2008; Lee et al., 2009; Yao et al., 2009). For example, at 6–7 months J20 mice have high levels of non-plaque-associated Aβ 1–40 and 1–42, develop their first Aβ plaques, and have memory defects, electrophysiological abnormalities, and dentate gyral atrophy.
Figure 1 describes eight different respiratory variables that test an extensive range of mitochondrial respiratory functions in situ (Brand and Nicholls, 2011), determined by automated multiwell plate format respirometry in a Seahorse XF Extracellular Flux Analyzer (Seahorse Bioscience). Surprisingly, contrary to existing literature on respiratory defects in isolated mitochondria (Gillardon et al., 2007; Hauptmann et al., 2009, Yao et al., 2009; Du et al., 2010), we observed no consistent defects in any of the synaptosomal respiratory variables (Table 1). Basal respiration, non-mitochondrial respiration, respiration driving ATP synthesis, respiration driving proton leak, maximum respiration, cell respiratory control (defined here as the ratio between the maximal and leak respiration), coupling efficiency, and spare respiratory capacity (defined here as the ratio between maximal and basal respiration) were compared between transgenic mice and appropriate age-matched controls (Table 1, parts A–C). Cortical synaptosomes from 14-month-old APP/PS mice showed increased basal respiration and proton leak, and decreased coupling efficiency and cell respiratory control (Table 1, part C), but this was not replicated in hippocampus, 9-month-old APP/PS mice, or the other two AD models. Two-way ANOVA revealed that APP/PS mice and their age-matched controls had an age-dependent decline of maximum respiration (and therefore of spare respiratory capacity and cell respiratory control), with an interaction of age and APP/PS on cell respiratory control. Importantly, in contrast to age, the APP/PS transgene did not cause a decline in maximal respiration. For both J20 and APP/PS, our assays were sensitive enough to have detected >10% decline in maximal respiration (see Table 1 legend). All observed changes in APP/PS cortical synaptosomes were because of increased proton leak, and the combination of leak and age-related respiratory defect in 14-month-old APP/PS is reflected by the marked decline of cell respiratory control.

Respiratory variables determined in this study. The oxygen consumption rate of mitochondria within synaptosomes (10 μg protein/well) was determined in pmol O2/min/10 μg protein using a microplate-based respirometer (XF24, Seahorse Bioscience). Representative data using cortical synaptosomes from wild-type J20 age 6 months are shown. Data are means ± SE (n = 5 biological replicates each the average of 3 technical replicates). Synaptosomes from each transgenic mouse type were first titrated with 0.5–4 μm carbonylcyanide p-trifluoromethoxyphenylhydrazone (FCCP) (an uncoupler of oxidative phosphorylation; data not shown). In each case 4 μm FCCP gave the maximum rate without respiratory inhibition, so this concentration was used for all experiments. Non-mitochondrial respiration was defined as the average of three time points after addition of 2 μm rotenone plus 2 μm myxothiazol (respiratory chain inhibitors), and this value for each well was subtracted from all other values for that well before calculation of the following respiratory variables: basal respiration (average value of 6–7 measurements before any treatment, excluding the first time point); maximum respiration (average value of the second and third measurements after addition of 4 μm FCCP); respiration driving proton leak (average value of three time points after addition of 4 μg/ml oligomycin, an inhibitor of ATP synthase); respiration driving ATP synthesis (basal respiration minus respiration driving proton leak); coupling efficiency (100 × respiration driving ATP synthesis/basal respiration); spare respiratory capacity (100 × maximum respiration/basal respiration); cell respiratory control (100 × maximum respiration/respiration driving proton leak).
Synaptosomal quality and mitochondrial volume fraction in synaptosomes from J20 and WT mice
Cortical and hippocampal synaptosomes from symptomatic J20 mice were chosen as the model system for more detailed experiments to investigate the bioenergetics. As an index of the quality of our synaptosomal preparations, we measured the percentage that was respiration-competent, defined as synaptosomes that contained polarized mitochondria (% of total objects). The quality did not differ between synaptosomes from WT and J20 mice: 65 ± 23WT vs 70 ± 11J20 in cortex; 78 ± 1WT vs 78 ± 8J20 in hippocampus (Fig. 2A).
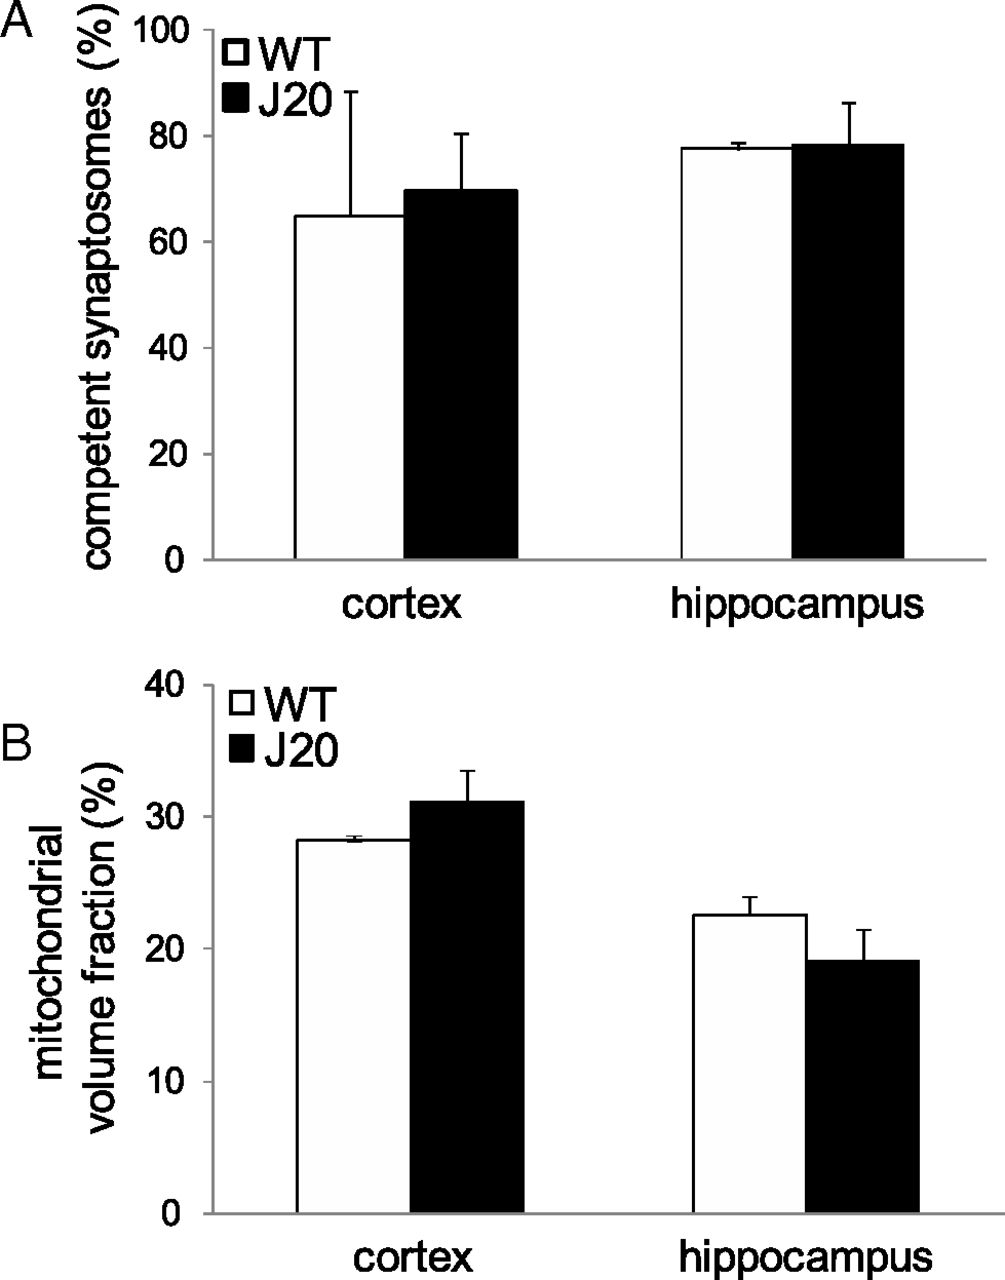
Properties of synaptosomes from WT and J20 mice. The percentage of the total number of objects per view-field that were competent synaptosomes, defined as the synaptosomes that had (or once had) mitochondria with high membrane potential (A), and the mitochondrial volume fraction, defined as the percentage of the three-second power of the ratio given by dividing the number of pixels occupied by synaptosomal mitochondria by the number of pixels occupied by cytosol + mitochondria (B) were measured as described in Materials and Methods. White bars, WT; black bars, J20. Data are means ± SE (n = 3 biological replicates each the average of 3 technical replicates).
Mitochondrial morphology has been reported to differ in AD (Trimmer et al., 2000; Eckert et al., 2001; Trushina et al., 2012). We therefore examined the mitochondrial content of presynaptic nerve terminals. The volume fraction of mitochondria (%) did not differ between synaptosomes from WT and J20 mice: 28.2 ± 0.1WT vs 31.1 ± 2.4J20(not >10% decrease) in cortex; 22.6 ± 1.4WT vs 19.1 ± 2.3J20 in hippocampus (Fig. 2B).
Induction of calcium stress
Mitochondria sequester excess calcium from the cytosol as part of normal homeostasis of intracellular calcium ([Ca]i); very high intracellular calcium will lead to excessive mitochondrial calcium uptake and mitochondrial damage. Any bioenergetic dysfunction is most likely to become apparent when the mitochondria within synaptosomes are exposed to high calcium stress and operating near their limits of performance. To test the impact of calcium overload on synaptosomal respiration, we generated calcium stress as described by Åkerman and Nicholls (1981); Fig. 3A) by administration of veratridine (inhibits Na+ channel closure) and ouabain (inhibits Na+/K+ ATPase) plus high extracellular calcium (voca), or administration of high extracellular potassium and calcium (“kca”). As reported (Akerman and Nicholls, 1981), voca treatment increased [Ca]i slowly (maximum [Ca]i was not achieved within 25 min) but to a high level, and kca treatment increased [Ca]i rapidly (maximum [Ca]i was achieved within 5 min), but to a lower level.

Intracellular calcium rise induced by calcium stressors. A, Simplified diagram showing how each treatment raises intracellular calcium ([Ca]i), following the method of Akerman and Nicholls (1981). Left, Veratridine/ouabain/[Ca]ex (voca) is a mixture of 1 μm veratridine, 100 μm ouabain, and 10 mm CaCl2. Veratridine is a use-dependent Na+ channel opener. Na+ influx depolarizes the plasma membrane activating voltage-activated Ca2+ channels. Further Ca2+ entry occurs via reversal of the plasma membrane Ca2+/Na+ exchanger. The high cytosolic Na+ activates the mitochondrial Ca2+/Na+ exchanger, enhancing dissipative mitochondrial Ca2+ cycling (Nicholls and Scott, 1980). Right, [K]ex/[Ca]ex (kca) is a mixture of 30 mm KCl and 10 mm CaCl2. High external K+ depolarizes the plasma membrane activating voltage-activated Ca2+ channels. Note that Na+ channels immediately inactivate. The plasma membrane Na+/Ca2+ exchanger reverses due to the high external Ca2+ and the collapse of the plasma membrane potential. Cytosolic Na+ remains low, limiting mitochondrial Ca2+ cycling but resulting in extensive matrix Ca2+ loading (Akerman and Nicholls, 1981). B, The treatment-induced synaptosomal free [Ca]i increase was monitored for 25 min using fura 4F-AM as calcium indicator. White diamonds, Cortical synaptosomes from WT mice; black diamonds, cortical synaptosomes from J20 mice; white circles, hippocampal synaptosomes from WT mice; black circles, hippocampal synaptosomes from J20 mice. Data are means ± SE (n = 5 biological replicates each the average of 3 technical replicates).
The maximum [Ca]i 25 min after the addition of each stimulus was not significantly different between synaptosomes from WT and J20 mice: voca treatment (in μm): 3.17 ± 0.33WT vs 2.65 ± 0.12J20 in cortex; 3.72 ± 0.33WT vs 2.91 ± 0.27J20 in hippocampus; kca treatment (in μm): 1.15 ± 0.06WT vs 1.15 ± 0.04J20 in cortex; 0.83 ± 0.04WT vs 0.74 ± 0.05J20 in hippocampus (Fig. 3B). These data indicate that any bioenergetic effect that voca and kca may have (see below) cannot be explained by an increased Ca2+ load (at CI < 10%).
Mitochondrial respiration under calcium stress
Increased [Ca]i by each stimulus damaged mitochondria and decreased spare respiratory capacity in synaptosomes from both WT and J20 mice. The decrease in spare respiratory capacity was similar in synaptosomes from WT and J20 mice (83–91% decrease (voca) and 50–67% decrease (kca) compared with no treatment control (p < 0.001; Table 2). This result shows that mitochondria within synaptosomes prepared from symptomatic J20 mice do not have a consistently greater sensitivity of spare respiratory capacity to strong calcium stress than WT; however, kca in hippocampal synaptosomes significantly decreased spare respiratory capacity.
Changes in the sum of mitochondrial and plasma membrane potential under calcium stress
Increased [Ca]i by each stimulus caused damage and decreased the sum of mitochondrial and plasma membrane potentials in synaptosomes from both WT and J20 mice. The decrease in membrane potential monitored for 25 min after addition of calcium stressors was similar in synaptosomes from WT and J20 mice: voca treatment (in mV): −22.3 ± 1.1WT vs −19.7 ± 2.3J20(not >20% decrease) in cortex; −21.9 ± 1.2WT vs −20.7 ± 0.2J20(not >20% decrease) in hippocampus; kca treatment (in mV): −36.2 ± 0.2WT vs −33.7 ± 1.4J20(not >10% decrease) in cortex; −35.4 ± 1.7WT vs −38.0 ± 1.1J20(not >20% decrease) in hippocampus (Fig. 4). This result shows that synaptosomes prepared from symptomatic J20 mice do not have a greater sensitivity of membrane potential to strong calcium stress than WT.

Effect of calcium stressors on membrane potential. The composite plasma-membrane and mitochondrial membrane potential of synaptosomes isolated from either cortex or hippocampus was measured using TMRM and is shown converted to millivolts (negative means depolarization). The change induced by calcium stressors was monitored for 25 min. Ctrl, No treatment; voca, 1 μm veratridine, 100 μm ouabain, and 10 mm CaCl2 as stimulus; kca, 30 mm KCl and 10 mm CaCl2 as stimulus. White bar, Cortical synaptosomes from WT mice; light gray bar, cortical synaptosomes from J20 mice; dark gray bar, hippocampal synaptosomes from WT mice; black bar, hippocampal synaptosomes from J20 mice. Data are means ± SE (n = 3 biological replicates each the average of 3 technical replicates).
Synaptic mitochondrial calcium handling capacity in response to intracellular calcium influx
Mitochondrial calcium dysregulation is closely related to the initiation and progression of AD pathogenesis (Begley et al., 1999; Du et al., 2010). We therefore compared the number of synaptosomes undergoing calcium dysregulation between synaptosomes from WT and J20 mice, using a recently developed single synaptosome fluorescence imaging technique (Choi et al., 2011). In brief, synaptosomes were loaded with fura-4F, then the number of individual synaptosomes whose [Ca]i was >10 μm (fura ratio >3) per view were counted and divided by total number of synaptosomes per view. The summarized result is shown in Figure 5. With no treatment, fewer than 4% of synaptosomes underwent calcium dysregulation and no difference was found between WT and J20 (Fig. 5, no treatment), which is in agreement with the high viability of our synaptosome preparation (∼70%, Fig. 2A). Calcium overload for 25 min increased the number of synaptosomes with calcium dysregulation in synaptosomes from both WT and J20 mice, but the extent of the increase did not differ: voca treatment (percentage): 32 ± 2.2WT vs 27 ± 2.2J20(not >5% increase) in cortex; 33 ± 0.7WT vs 28 ± 1.9J20(not >5% increase) in hippocampus; kca treatment (percentage): 13.1 ± 0.7WT vs 13.6 ± 0.7J20(not >20% increase) in cortex; 9.8 ± 0.8WT vs 9.2 ± 0.6J20(not >20% increase) in hippocampus (Fig. 5). This result shows that synaptosomes prepared from symptomatic J20 mice do not have a greater extent of stochastic calcium deregulation under strong calcium stress than WT. These data exclude the possibility that the difference in number of synaptosomes undergoing calcium dysregulation in J20 compared with WT upon voca treatment is >5%.

Intracellular calcium dysregulation induced by calcium stressors. The percentage of synaptosomes undergoing calcium dysregulation, defined as the percentage of synaptosomes with very high intracellular calcium (10 μm or above) compared with the number of total synaptosomes, defined as the objects positive for both MitoTracker and fura-4F, was measured as described in Materials and Methods. White bar (control), WT; black bar, J20. Data are means ± SE (n = 3–5 biological replicates for no treatment and treatment groups, respectively, each the average of 3 technical replicates).
No selective loss of damaged synaptosomes during preparation
Any selective loss of dysfunctional presynaptic nerve terminals during preparation of synaptosomes from transgenic mice compared with wild-type mice could cause a bias in favor of good quality or less fragile synaptosomes in the final preparation and mask any in vivo difference in the proportion of poor-quality terminals. To test this possibility, WT mice were fed a diet containing 13C6-lysine and J20 mice were fed an identical diet containing 12C6-lysine for 10 d to partially label all newly synthesized proteins (including synaptic marker proteins) in the WT mice with the heavy stable isotope form of lysine (13C6-lysine) in proportion to its effective enrichment in the amino acid pool and the turnover rate of each individual protein. Peptides from six different nerve-terminal-specific marker proteins were identified in homogenates of whole cortex and in preparations of synaptosomes by mass spectroscopy. The %13C6-lysine for each peptide was quantified by comparing relative ion intensities of the molecular ions, and data from 1 to 4 different peptides for each protein were amalgamated.
Figure 6A shows that after 10 d of feeding 13C6-lysine to a single WT mouse, incorporation of 13C6-lysine into the six synaptosomal marker proteins was between 12% for synapsin-1 and 35% for SNAP-25. The differences in label incorporation between proteins presumably reflect different turnover rates in vivo. Figure 6A also shows the 13C6-lysine incorporation into these proteins after mixing the cortex homogenate from this WT mouse with the cortex homogenate from an age-matched J20 mouse fed identical chow but containing 12C6-lysine. As expected, the %13C6-lysine content was halved (mean 46.5 ± 3.6% of WT value, n = 6 proteins), showing that the WT and J20 cortices contributed equal amounts of total presynaptic material (whether in intact or damaged terminals) to the mixed sample.

Relative recovery of synaptosomes from WT and J20 mice monitored using stable isotope-labeled synaptosomal marker proteins. WT mice were fed a diet containing heavy labeled 13C6-lysine (97%) to partially label all proteins, and J20 AD mice were fed a matched control diet containing unlabeled 12C6-lysine (∼99%). A, %13C6-lysine incorporation into six synaptosomal marker proteins in a homogenate of cortex from a single WT mouse (white bars) and in a mixed homogenate of cortices from this WT mouse and a single paired 12C6-lysine-fed J20 mouse (black bars) (which should dilute the signal twofold if each cortex contributed equal material to the mix). AUC, Area under the curve. Values were calculated as 100 × 13C-AUC/(13C-AUC + 12C-AUC) averaged for 1–4 peptides from each of six proteins from n = 1 biological replicate. B, Percentage of 13C6-lysine in the six marker proteins in three mixed homogenates of cortices from a 13C6-lysine-fed WT mouse and a paired 12C6-lysine-fed J20 mouse (white bars), and in the synaptosomes prepared from these mixed homogenates (black bars). Values are the average of 1–4 peptides from each of the 6 proteins from n = 3 biological replicate pairs. C, Percentage contribution of synaptosomes from J20 mice to the mixed synaptosomal preparations reported by the six proteins individually (black bars, mean ± SE, n = 3 biological replicate pairs) and on average (white bar, mean ± SE, n = 6 proteins). The individual protein values were calculated as 100 − (50 × (%13C6-lysine in synaptosomes/%13C6-lysine in cortex homogenates)).
Cortices from each of two other pairs of WT and J20 mice were chopped, then mixed and homogenized. Figure 6B shows that the mean %13C6-lysine incorporation in the three whole cortex mixed samples was very similar (small SE, n = 3 mouse pairs). Synaptosomes were prepared in parallel from the three homogenates and the 13C6-lysine incorporation was remeasured. Any selective loss of 12C6-labeled synaptosomal material from J20 mice during synaptosome preparation would have increased the %13C6-lysine, resulting in a higher %13C6-lysine in the synaptosomes than in the original homogenates. Figure 6B shows that the %13C6-lysine in each presynaptic nerve terminal marker protein was not higher after synaptosome preparation. The mean ratio of synaptosome/cortex %13C6-lysine content was 0.94 ± 0.06 (n = 6 proteins).
These data were used to calculate the percentage of synaptosomal material in the final preparation that originated from the J20 mice (assuming 50% contribution to the original cortex homogenate, Fig. 6A). Figure 6C shows that the results using each marker protein were similar, ranging from 42 to 61%. The average contribution of synaptosomes from J20 mice was 52.2 ± 2.9%, n = 6 proteins).
We conclude that there was no selective loss of synaptosomal material from J20 mice during synaptosomal preparation. Since the respiratory properties (Table 1, part A), quality (Fig. 2A) and stress resistance (Figs. 4, 5) of the final synaptosomal preparations from WT and J20 mice were not different, we also conclude that the bioenergetic properties of synaptosomes in the original homogenates (and by extension, of presynaptic nerve terminals in vivo) were not altered in the J20 model of Alzheimer's disease.
Discussion
An important goal of our work was to develop appropriate techniques to properly assess the bioenergetic status of mitochondria in synaptosomes. While the synaptosome preparation has been used for almost 50 years and in >12,000 publications, the inherent heterogeneity of the preparation has never been fully addressed. In this study we included stable isotope mass spectrometry to test the possibility of false conclusions of mitochondrial defects by selective accumulation or loss of dysfunctional synaptosomes, together with the direct quantitation of respiration competent (viable) synaptosomes per microgram protein between groups by single synaptosome imaging (Choi et al., 2011).
A potential impact of synaptic mitochondrial dysfunction on the development of the Alzheimer's disease phenotype is an attractive hypothesis because synaptic terminals are very sensitive to bioenergetic defects due to their high energy demands, and synaptic loss is well accepted to cause cognitive impairment, a hallmark of AD pathogenesis. However, our results show no evidence for mitochondrial bioenergetic defects at presynaptic nerve terminals in three different transgenic mouse models that are widely used for studies on AD. In particular, synaptosomes from J20 mice maintained respiratory capacity, membrane potential and intracellular calcium handling capacity as well as WT under both resting and stressed conditions. It is commonly accepted that the genetic background of transgenic mouse models may selectively affect their phenotype. In our experiments, we used three different AD mouse models with different genetic backgrounds, none of which showed any bioenergetic defect in presynaptic nerve terminals, making it unlikely that our result was caused by the particular genetic background of the mice.
To relate the present findings to the apparent consensus in the literature that some form of presynaptic mitochondrial dysfunction can be detected in AD models, it is important to critically examine the evidence in the literature. In vitro, it is well established that Aβ oligomers are directly toxic to isolated mitochondria (Keller et al., 1997; Guo et al., 2000; Casley et al., 2002; Moreira et al., 2002). In contrast, data from transgenic mouse models are relatively scarce. Begley et al. (1999) reported mitochondrial membrane potential in AD-related synaptosomal models, but used rhodamine-123 in quench mode (Nicholls and Ward, 2000), conditions in which it cannot detect differences in mitochondrial membrane potential between two populations (Brand and Nicholls, 2011). Proteomic and enzyme activity assays performed on crude synaptosomes (Gillardon et al., 2007; Hauptmann et al., 2009; Rhein et al., 2009) indicated a molecular basis for a bioenergetic deficit. More recent data provide direct evidence for defective state III respiration or respiratory control in mitochondria isolated from 12 and 18 month 3xTg-AD mice (Yao et al., 2009; Cassano et al., 2012), 17 month Thy-1 APP (Hauptmann et al., 2009), and 6 month Tg2576 (Gillardon et al., 2007). While these studies found ∼20% decline of respiration in mitochondria isolated from whole brain, Du et al. (2010) found differences only in synaptic, but not whole brain mitochondria in younger, 4-month-old J20 mice. In contrast to isolated mitochondria, as far as we know respiratory properties of synaptosomes have been reported only from Tg2576 transgenic mice (Varghese et al., 2011). While respiration appeared to be depressed in these transgenic mice this was largely due to differences in rotenone-insensitive respiration, and this difference was then amplified by incorrect statistical analysis (using ANOVA on noncategorical, time-lapse data).
Our results do not support existing indirect evidence for impaired mitochondrial function in nerve termini as a cause or consequence of the initiation or progression of AD-like symptoms in mice (Begley et al., 1999; Yao et al., 2009; Du et al., 2010; Varghese et al., 2011). The reported mitochondrial respiration changes in AD are minor (∼20% decrease in state III respiration, see above), but large enough to have registered in our assays. Nevertheless, this reported decline is smaller than the observed age-related changes (Table 1, part C), casting doubt on its pathogenic significance. Our study focused on bioenergetic decline in early symptomatic mice, before plaque formation. In contrast, the observations of bioenergetic decline were mostly performed in older mice (see above). As a positive control, we have previously detected bioenergetic dysfunction in cortical synaptosomes of superoxide dismutase 2-null mice using the same techniques (Flynn et al., 2011). In this mouse model, spare respiratory capacity was significantly and substantially decreased compared with the wild-type control, showing that any substantial bioenergetic defects can readily be observed in our ex vivo experimental setting. Finally, it could be especially telling that differences were reported in isolated mitochondria, but not in synaptosomes. It is possible that mitochondria isolated from brains of AD model mice are exposed to oligomeric Aβ during preparation, and the detected effects are the result of acute Aβ toxicity (see above). Oligomeric Aβ is known to be present in endosomes and attached to membranes in the brain (Takahashi et al., 2004; Kokubo et al., 2005), and we expect to disturb these pools during brain homogenization. In contrast, synaptosomal mitochondria are protected from Aβ during preparation by the synaptosomal membrane, and better reflect in vivo Aβ exposure. In addition, free mitochondria in defined, artificial buffers with saturating levels of substrates will have different bioenergetic behavior than mitochondria in situ surrounded by cytosol and plasma membrane within synaptosomes (Gerencser et al., 2012). This difference may include redistribution of control over respiration, therefore the same deficit of a process (e.g., complex I activity) will result in a different overall decline in respiration (Brand and Nicholls, 2011).
Importantly, no previous study has reported synaptosomal quality. Since synaptosome preparation requires multiple steps, and synaptosomal enrichment varies (25–70%; Joyce et al., 2003; Choi et al., 2011), verification of quality and lack of preferential accumulation or loss of damaged synaptosomes is important. Joyce et al. (2003) used electron microscopy to quantify whole rat brain synaptosomes and found that ∼68% of the structures contained synaptic vesicles and of these, only 38% contained mitochondria. In our study using mouse brain regions and a different synaptosomal preparation method, ∼70% of objects were viable synaptosomes containing mitochondria. However, the preparation also contains broken membranes that are visible by electron microscopy but invisible to our entrapped fluorescence probe method. Therefore, >30% of protein in synaptosomes does not contribute to the measured functions. The significance of quality control of synaptosomes for accurate interpretations is exemplified in Choi et al. (2011) in which the lower respiration of dopaminergic synaptosomes was due to a lower number of respiration competent synaptosomes per microgram protein in the preparation. Importantly, in J20 mice we did not find such differences, therefore the comparison of respiration per microgram protein is valid.
There are several reasons why we may have failed to observe a mitochondrial dysfunction in our experiments even if mitochondrial dysfunction is important in AD. It may be that the mouse models we have used are not good models of the human disease. It could be that dysfunction is only apparent under stress—we measured respiratory rates at different rates (basal, oligomycin-inhibited, uncoupled) at rest and under calcium stress, but we may not have chosen the right stress to uncover a phenotype. It could be that a phenotype is too small or subtle to be detected by the methods we have used, or is only apparent under different incubation conditions that we did not test. Our stable isotope lysine labeling experiments showed that we were not preferentially losing potentially dysfunctional subpopulations of synaptosomes during the preparation, but perhaps only a tiny proportion of nerve terminals is affected in AD at any given time before dying and being lost in vivo, so no global dysfunction was apparent. Alternatively, it could be that the dysfunction is present only in a small subpopulation of nerve terminal types, or manifests only postsynaptically, or in cell body but not terminal mitochondria. In contrast to the synaptic mitochondria-specific bioenergetic decline shown by Du et al. (2010), Yao et al. (2009) reported lower mitochondrial respiration in whole brain mitochondria and primary hippocampal neurons from transgenic mice with AD-like phenotypes when compared with WT, which may imply weaker mitochondrial capacity in postsynaptic terminals of AD-mice rather than in the presynaptic synaptosomes investigated here. Our results also do not exclude the possibility of mitochondrial dysfunction in sporadic AD. Indeed, hypo-metabolism and/or mitochondrial abnormalities are a predominant symptom in sporadic Alzheimer's patients (de la Monte, 2012). It is possible that transgenic AD mouse models, which mimic familial AD, may not recapitulate the physiology of sporadic AD. Another possibility is that bioenergetic decline is present mostly in astrocytes (Rodríguez et al., 2009), which contribute to whole brain isolated mitochondria, or unpurified, crude synaptosomal preparations (as glyosomes). Nonetheless, our experiments show that there is no large global mitochondrial dysfunction in presynaptic nerve terminals in these mouse models of AD.
In summary, our results do not support the hypothesis that in widely used familial type AD mouse models, mitochondrial bioenergetic capacity in presynaptic nerve terminals is unusually susceptible to inhibition of electron transport by calcium overload, and underlies susceptibility to familial Alzheimer's disease.
Footnotes
- Received May 16, 2012.
- Revision received July 17, 2012.
- Accepted August 15, 2012.
This work was supported by National Institutes of Health Grants P01 AG025901, PL1 AG032118, and R01 AG034427, and the Joseph Drown Foundation. We thank Prof. Lennart Mucke for providing the J20 line of the PDAPP transgenic mouse model of Alzheimer's disease and AB SCIEX for the use of the Triple TOF 5600 mass spectrometer at the Buck Institute's Mass Spectrometry Core.
- Correspondence should be addressed to Sung W. Choi, Buck Institute Research on Aging, 8001 Redwood Boulevard, Novato, CA 94945. swchoi.phd{at}gmail.com
- Copyright © 2012 the authors 0270-6474/12/3216775-10$15.00/0