

Article Figures & Data
Figures
- Figure 1.
Electronic gating procedure for murine nuclear samples stained with PI and analyzed by flow cytometry. A, Fresh cell nuclei were isolated from the cerebral cortex of 2-month-old mice, stained with PI, and subjected to flow cytometric analysis. Nuclei were gated (polygonal box) on forward scattering area (FCS-A), a measure of particle size, and side scattering area (SSC-A), a measure of particle complexity (a). DNA content was then assessed from the gated nuclear population by plotting Propidium Iodide-H versus Propidium Iodide-A levels. Diploid and tetraploid nuclei were subsequently gated from these plots (polygonal box), while the doublets of diploid nuclei were discarded (b). DNA content was also assessed from the gated nuclear population in a by plotting Propidium Iodide-W versus Propidium Iodide-A levels. Tetraploid nuclei are surrounded by a solid line while doublets of diploid nuclei are surrounded by a dotted line (c). When DNA content is assessed from the gated nuclear population in b by plotting Propidium Iodide-W versus Propidium Iodide-A levels, doublets of diploid nuclei (dotted line) disappear (d), thus demonstrating that our gating procedure is an efficient method for analysis of diploid and tetraploid (solid line) nuclei. B, Scheme illustrating the method used for doublet discrimination based on the pulse-processing method. When a PI-labeled nucleus passes through the laser beam a fluorescent signal is converted into an electrical pulse defined by its width (W), its maximal intensity (H), and its integrated area (A). The signal recorded from a tetraploid nucleus (c) has a double H value compared with a diploid nucleus (a), whereas a doublet of diploid nuclei (b) results in a fluorescent signal with double W value compared with that of a diploid nucleus. Therefore, tetraploid nuclei can easily be discriminated from doublets of diploid nuclei due to the H/A and the W/A ratio of their PI signal. C, Cell nuclei isolated from the cerebral cortex of 2-month-old mice were either stained with PI and subjected to flow cytometric analysis (Unfixed) or fixed in ice-cold 70% ethanol overnight before staining with PI and flow cytometric analysis (EtOH-fixed). Bottom, Illustrates the aspect of the fresh and ethanol-fixed nuclei, counterstained with DAPI. Top, Illustrates representative DNA content histograms from either unfixed or ethanol-fixed nuclei. Flow cytometric analyses were performed in parallel. CV (C.V.) are shown. Note that the CV is lower when fresh nuclei are analyzed. D, Ethanol-fixed nuclei immunostained with an anti-NeuN antibody and counterstained with DAPI demonstrate a lot of staining background, which likely explains the increased CV. Scale bars: C, 10 μm; D, 20 μm.
- Figure 2.
Somatic tetraploid neurons in the mouse cerebral cortex and chick telencephalon. A, Cell nuclei isolated from the cerebral cortex of 2-month-old mice immunostained with an anti-NeuN-specific antibody and counterstained with DAPI. Arrow, An NeuN-positive nucleus. B, Cell nuclei immunostained with the anti-NeuN antibody (α-NeuN) or with the secondary antibody alone (Control) were PI stained and subjected to flow cytometric analysis. Right, Illustrates the threshold used for the discrimination of NeuN-positive nuclei. C, DNA content (Propidium Iodide-A) plotted against NeuN signal intensity (FITC-A) demonstrates that most nuclei with 4C content are positive for NeuN immunolabeling. D, DNA content histogram from NeuN-negative nuclei. E, DNA content histogram from NeuN-positive nuclei. See Table 1 for quantitative data. F, Cell nuclei isolated from the telencephalon of posthatch chicks immunostained with an anti-NeuN-specific antibody and counterstained with DAPI. Arrow, An NeuN-positive nucleus. G, Cell nuclei immunostained with the anti-NeuN antibody (α-NeuN) or with the secondary antibody alone (Control) were PI stained and subjected to flow cytometric analysis. Right, Illustrates the threshold used for the discrimination of NeuN-positive nuclei. H, DNA content (Propidium Iodide-A) plotted against NeuN signal intensity (FITC-A) demonstrates that most nuclei with 4C content are positive for NeuN immunolabeling. I, DNA content histogram from NeuN-negative nuclei. J, DNA content histogram from NeuN-positive nuclei. See Table 1 for quantitative data. Scale bar, 20 μm.
- Figure 3.
Absence of tetraploid neuron turnover in 1-month-old mice. A, TUNEL staining in cryosections (12 μm) from the cerebral cortex of 1-month-old mouse treated with DNase (+DNAse) or left untreated (−DNAse), immunostained with an anti-NeuN antibody, and counterstained with DAPI. B, Flow cytometric analysis of fresh cell nuclei from 1-month-old mouse cortex treated with DNase (+DNAse) (positive control), or left untreated (−DNAse), and subjected to TUNEL staining either in the presence (+TDT) or absence (−TDT) (negative control) of terminal deoxynucleotidyl transferase. Quality of cell nuclei was evaluated using DAPI counterstaining (top). C, Cryosections (12 μm) from the cerebral cortex of 1-month-old Fucci mouse immunostained with an anti-NeuN antibody and counterstained with DAPI. Nuclei labeled with geminin/mAG (Fucci), representing cells in S/G2, can be observed in the subventricular zone (arrow). Bottom, High magnifications of the dashed rectangle from the top. Cx, cortex; v, ventricle. Scale bars: A top, B, 40 μm; A bottom, C, 100 μm.
- Figure 4.
Analysis of Erg-1 expression in NeuN-positive cortical cell nuclei. A, Cell nuclei isolated from the cerebral cortex of 2-month-old mice coimmunostained with anti-Erg-1 (EGR1) and anti-NeuN (NeuN) antibodies, and counterstained with DAPI. Arrow, An NeuN/Erg-1-double positive nucleus. B, Egr-1 and NeuN intensity signals for control nuclei lacking primary antibodies. C–E, Egr-1 and NeuN intensity signals for nuclei labeled with anti-Egr-1 (C), anti-NeuN (D), or both (E) antibodies. Equal amounts of secondary antibodies were present in all situations illustrated in B–E. F, G, DNA content (Propidium Iodide-A) in cell nuclei immunostained either with anti-NeuN (F) or with anti-NeuN and anti-Egr-1 (G), plotted against Egr-1. Scale bar, 10 μm.
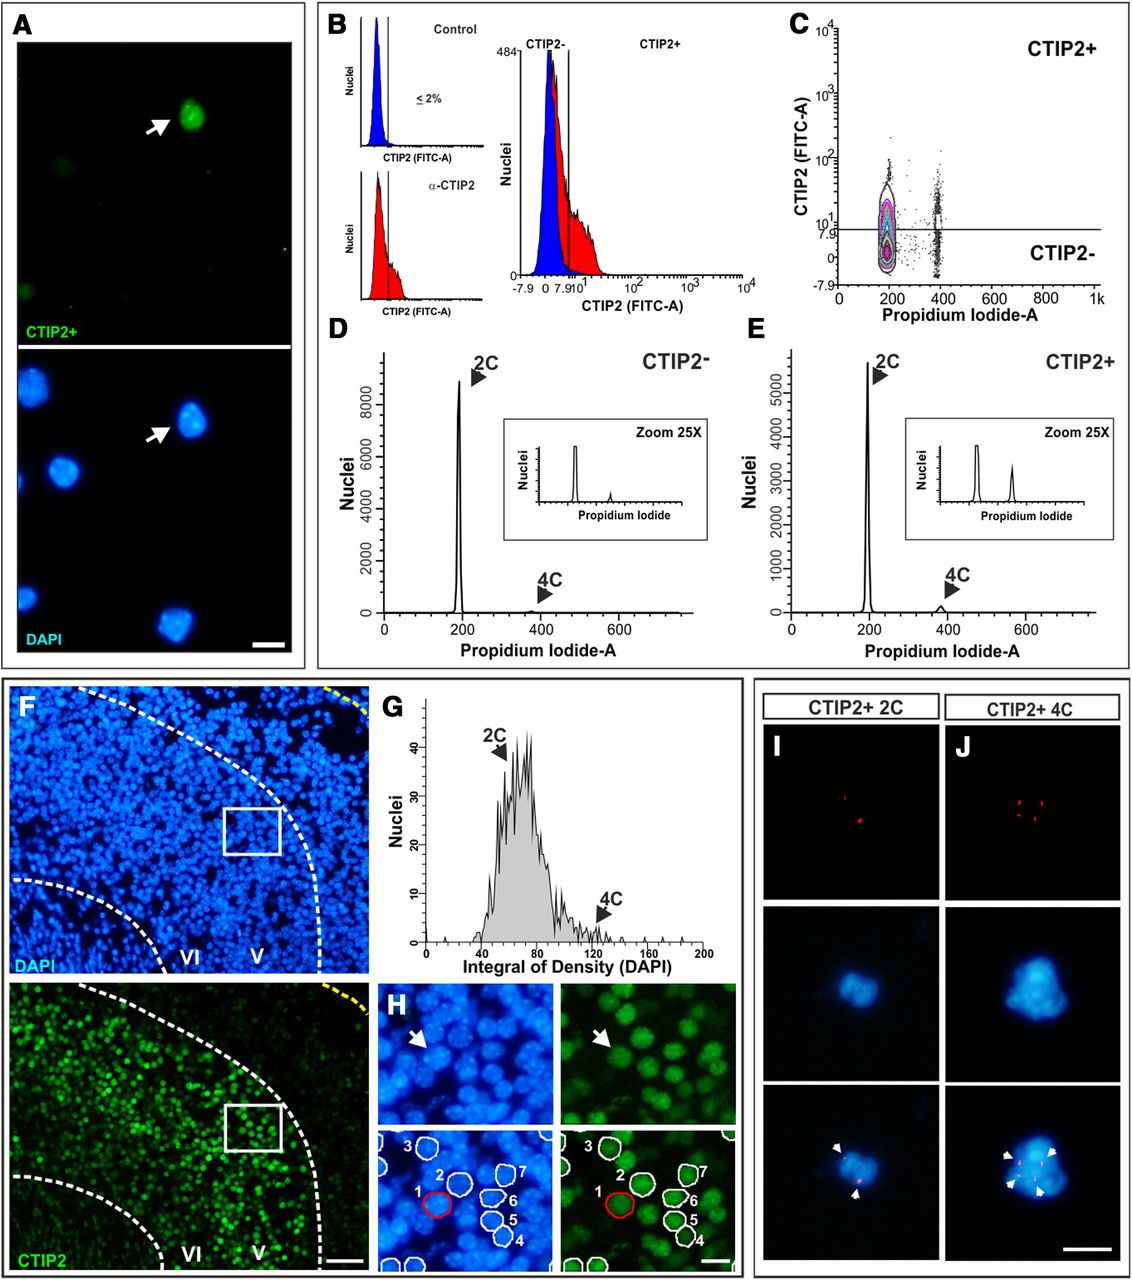
- Figure 5.
CTIP2-positive neurons with 4C DNA content in the mouse cerebral cortex. A, Cell nuclei isolated from the cerebral cortex of 2-month-old mice immunostained with an anti-CTIP2-specific antibody (green) and counterstained with DAPI (blue). Arrow, A CTIP2-positive nucleus. B, Cell nuclei immunostained with the anti-CTIP2 antibody (α-CTIP2) or with the secondary antibody alone (Control) were PI stained and subjected to flow cytometric analysis. Right, Illustrates the threshold used for the discrimination of CTIP2-positive nuclei. C, DNA content (Propidium Iodide-A) plotted against CTIP2 signal intensity (FITC-A) demonstrates that most nuclei with 4C content are positive for CTIP2 immunolabeling. D, DNA content histogram from CTIP2-negative nuclei. E, DNA content histogram from CTIP2-positive nuclei. See Table 2 for quantitative data. F, Coronal cryosections (15 μm) obtained from cerebral cortex of E17.5 mouse embryos were immunostained with and anti-CTIP2 antibody (green) and labeled with DAPI (blue) for DNA quantification. G, DNA content histogram in CTIP2-positive nuclei obtained by SBC. H, Top, A high magnification of box shown in F. Arrow, Nucleus with 4C DNA amount. Bottom, CTIP2-positive nuclei were used for DNA quantification only in those cases in which DAPI signal was clearly identified as a single nucleus (numbered nuclei). I, J, CTIP2-positive cell nuclei from the cerebral cortex of 2-month-old mice, isolated by FACS, subjected to FISH with a chromosome 11-specific probe (red), and counterstained with DAPI (blue). Arrows, Hybridization spots. Scale bars: A, H, I, J, 10 μm; F, 40 μm.
- Figure 6.
p75NTR and Rb expression in mouse cortical newborn neurons that incorporate BrdU. Coronal cryosections (12 μm) from the cerebral cortex of E12.5 mouse labeled with BrdU for 30 min were triple immunostained with anti-βIII-tubulin (βIII tub.) (white), anti-BrdU (green), and either anti-p75NTR (p75) (A), anti-Rb (B), or anti-phospho-Rb (P-Rb) (C) (red) antibodies, and counterstained with DAPI (blue). Arrows, Neuroepithelial cells with high levels of βIII-tubulin immunolabeling coexpressing either p75NTR (A), Rb (B), or phospho-Rb (C) and labeled with the anti-BrdU antibody. V, ventricle; VZ, ventricular zone. Scale bars: A, B, 20 μm; C, 15 μm.
- Figure 7.
Expression of p75NTR in CTIP2-positive neurons. Coronal cryosections (12 μm) from the cerebral cortex (A–D) or basal forebrain (E) of mouse at the indicated ages were immunostained with anti-p75NTR (red) and anti-CTIP2 (green) antibodies. Left, Rectangles represent the area illustrated in middle and right parts. Arrows, CTIP2-positive neurons expressing p75NTR; arrowheads, CTIP2-positive neurons lacking p75NTR expression. V, ventricle. Scale bar: A–C left, 30 μm; A middle and right, 50 μm; B, C middle and right, 20 μm; D left, 200 μm; D middle and right, 60 μm; E, 60 μm.
- Figure 8.
Analysis of tetraploidy in SPNs. Cell nuclei isolated from the cerebral cortex of P0 mice were coimmunostained with anti-Sox5 and anti-CTIP2 antibodies, and subjected to flow cytometric analysis after labeling with PI. DNA content (Propidium Iodide-A) plotted against CTIP2 signal intensity (CTIP2 FITC-A) was evaluated in the Sox5-positive population. The horizontal line represents the threshold for CTIP2-specific staining. The Sox5-positive/CTIP2-negative population (i.e., SPNs) mainly contains diploid neurons.
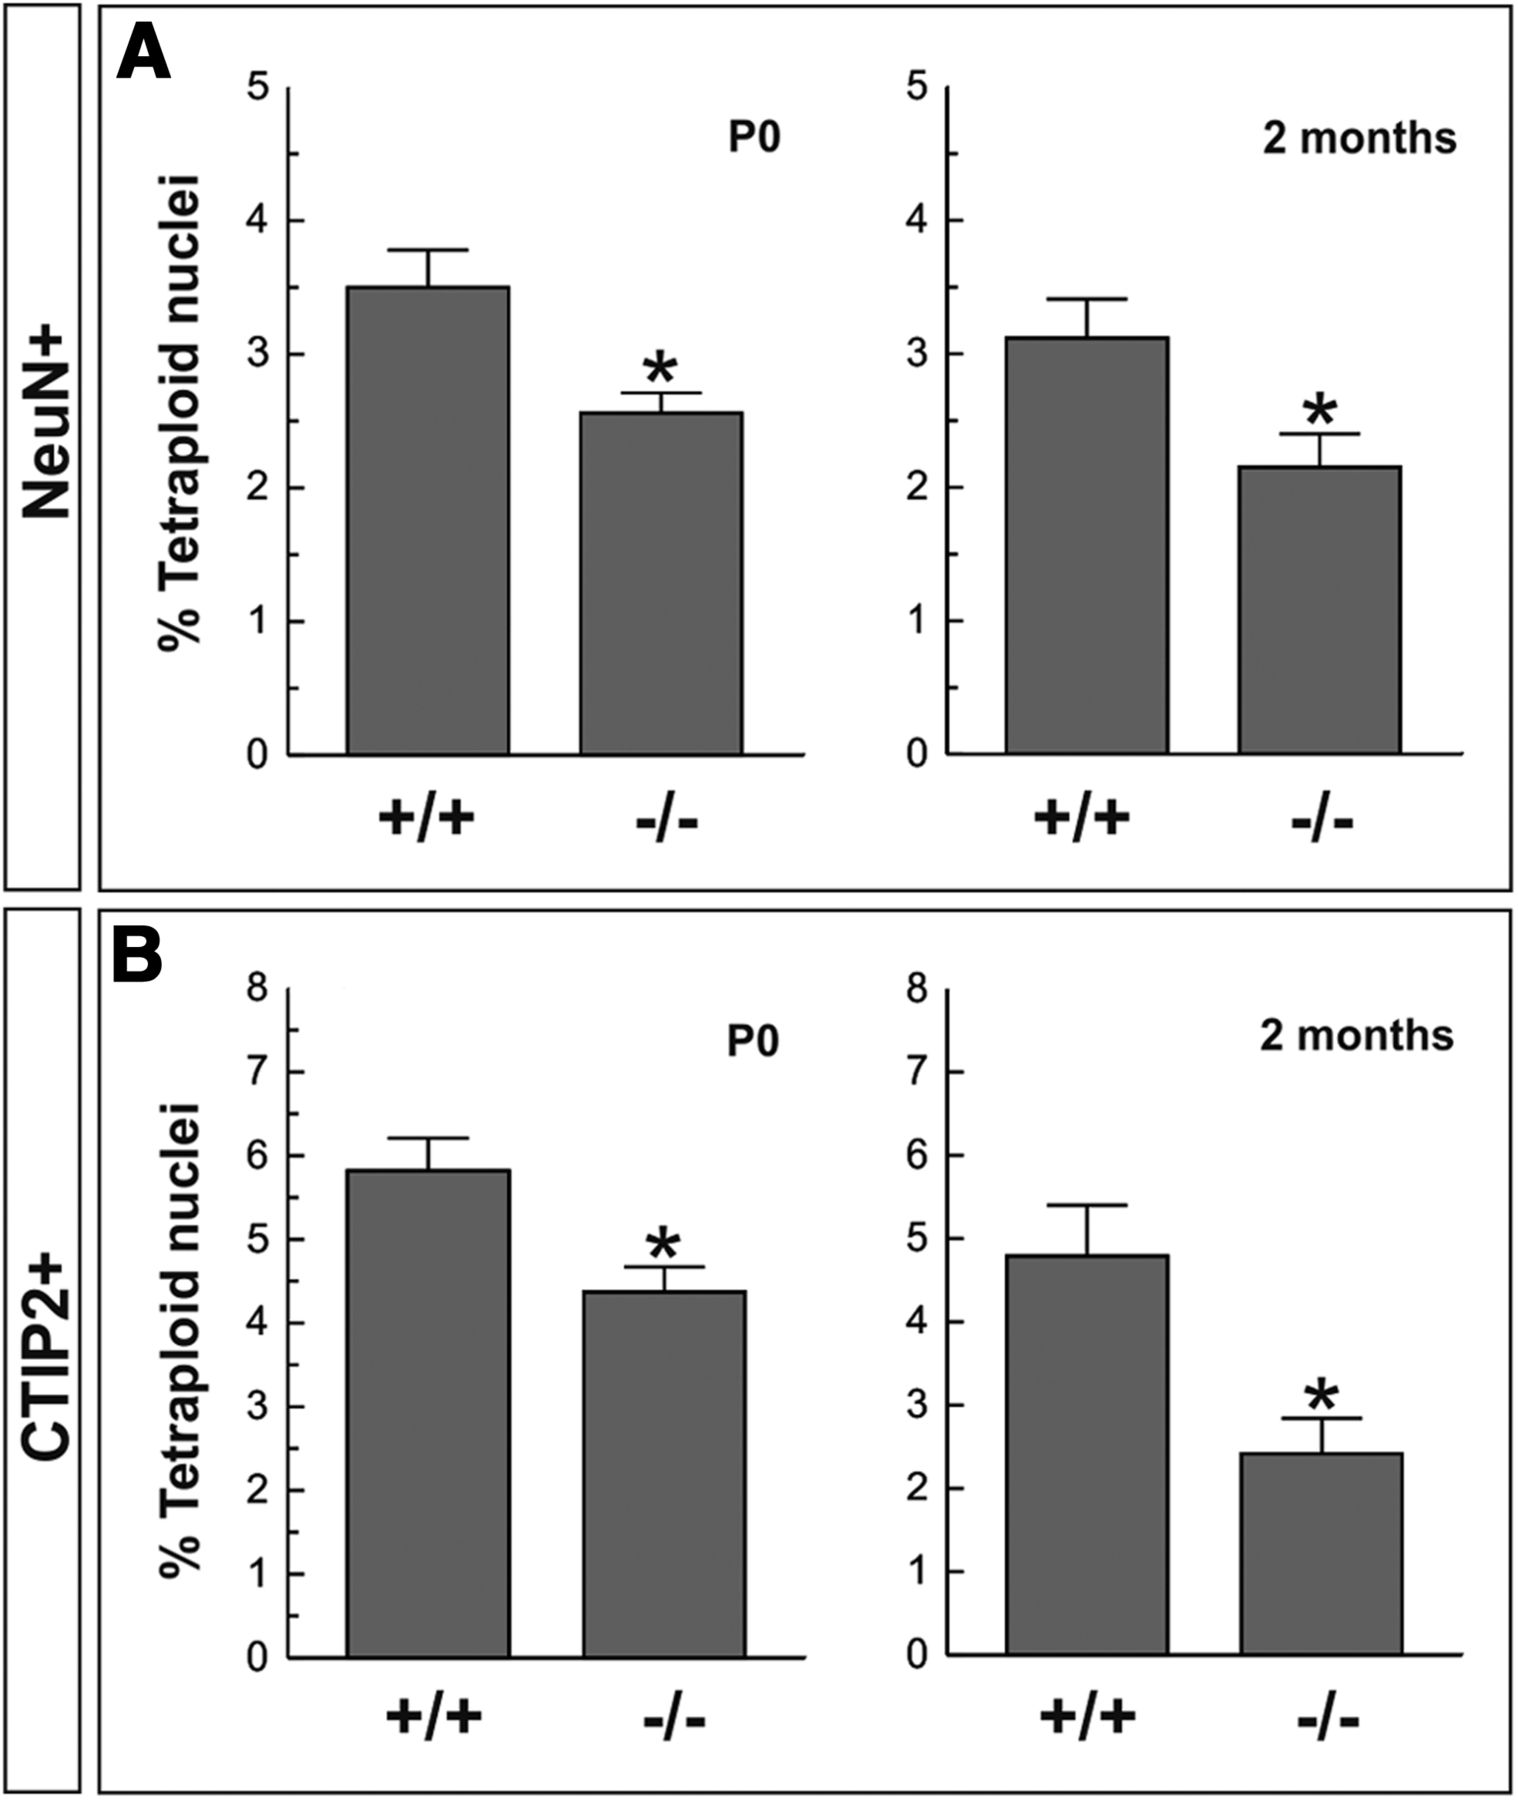
- Figure 9.
Percentage of tetraploid neurons in the cerebral cortex of wild-type and p75NTR−/− mice. A, Quantification of neuronal tetraploidy in the cerebral cortex of P0 and 2-month-old mice. The levels of tetraploidy in NeuN-positive nuclei were reduced in the cerebral cortex of p75NTR−/− mice. B, Quantification of neuronal tetraploidy in the cerebral cortex of P0 and 2-month-old mice. The levels of tetraploidy in CTIP2-positive nuclei were reduced in the cerebral cortex of p75NTR−/− mice. *p < 0.05 (Student's t test).
- Figure 10.
Enrichment of tetraploidy in calbindin-positive neurons in the mouse striatum. A, Cells isolated from the striatum of adult mice immunostained with an anti-calbindin-specific antibody and counterstained with DAPI. Arrow, A calbindin-positive neuron. B, Neurons immunostained with the anti-calbindin antibody, isolated from the cerebral cortex (Cortex) or striatum (Striatum) from P0 mice, were stained with PI and subjected to flow cytometry. The percentage of calbindin-positive neurons in the 4C population is shown for each tissue. ***p < 0.005 (Student's t test). Scale bar, 10 μm.


Tables
- Table 1.
Percentage of tetraploid nuclei with NeuN-specific immunolabeling and NeuN-positive nuclei with tetraploid content in mouse cerebral cortex and chick telencephalon
Tissue % NeuN + nuclei in the 4C population (mean ± SEM) % NeuN + nuclei with 4C DNA content (mean ± SEM) n Mouse neocortex (P0) 98.66 ± 0.61 3.17 ± 0.15 8 Mouse neocortex (2 month old) 95.21 ± 0.71 3.12 ± 0.29 13 Chick telencephalon (posthatch) 98.30 ± 0.40 2.98 ± 0.22 5 - Table 2.
Percentage of tetraploid nuclei with CTIP2-specific immunolabeling and CTIP2-positive nuclei with tetraploid content in mouse cerebral cortex and chick telencephalon
Tissue % CTIP2 + nuclei in the 4C population (mean ± SEM) % CTIP2 + nuclei with 4C DNA content (mean ± SEM) n Mouse neocortex (P0) 64.78 ± 3.14 5.18 ± 0.44 11 Mouse neocortex (2 month old) 63.19 ± 2.52 4.79 ± 0.61 13 Chick telencephalon (posthatch) 80.40 ± 2.60 4.17 ± 0.22 5


