

Abstract
The neurotransmitter glutamate is used by most neurons in the brain to activate a multitude of different types of glutamate receptors and transporters involved in fast and relatively slower signaling. Synaptic ribbons are large presynaptic structures found in neurons involved in vision, balance, and hearing, which use a large number of glutamate-filled synaptic vesicles to meet their signaling demands. To directly measure synaptic vesicle release events, the ribbon-type presynaptic terminals of goldfish retinal bipolar cells were coaxed to release a false transmitter that could be monitored with amperometry by placing the carbon fiber directly on the larger synaptic terminal. Spontaneous secretion events formed a unimodal charge distribution, but single spike properties were heterogeneous. Larger events rose exponentially without interruption (τ ∼ 30 μs), and smaller events exhibited a stammer in their rising phase that is interpreted as a brief pause in pore dilation, a characteristic commonly associated with large dense core granule fusion pores. These events were entirely Ca2+-dependent. Holding the cells at −60 mV halted spontaneous release; and when the voltage was stepped to >−40 mV, secretion ensued. When stepping the voltage to 0 mV, novel kinetic phases of vesicle recruitment were revealed. Approximately 14 vesicles were released per ribbon in two kinetic phases with time constants of 1.5 and 16 ms, which are proposed to represent different primed states within the population of docked vesicles.
Introduction
Serving as the principle cell type linking the outer and inner retina, bipolar cells (BPCs) must transmit all varieties of signals, and their presence is absolutely required for the retina to function (Burmeister et al., 1996). Most types of BPCs possess only a few terminals, and a single terminal communicates with dozens to hundreds of dendrites in the inner retina (Dacheux and Raviola, 1986; Marc and Liu, 2000) by triggering the fusion of synaptic vesicles that release packets of glutamate into the extracellular space.
BPCs build active zones referred to as “synaptic ribbons,” which are easily identified at the ultrastructural level as electron-dense masses that protrude into the cell and are decorated with a dense layer of synaptic vesicles. Ribbon synapses typically consist of a single synaptic ribbon that is juxtaposed to two or more dendrites. In the case of a rodent (rod On-BPC), a single ribbon creates a synapse with an AII amacrine dendrite on one side and an A17 amacrine dendrite at its other face (Raviola and Dacheux, 1987). This arrangement likely allows a ribbon to communicate with two targets either through the coordinated release from both faces of the ribbon or through cross-talk where release from one face of the ribbon diffuses to the other side. Transmitter spillover from a single release event onto different BPC dendrites has been reported to occur at the cone photoreceptor ribbon synapse by DeVries et al. (2006). Spillover from a ribbon synapses in the inner plexiform has not been explored as extensively, but Matsui et al. (1998) provided evidence that BPC ribbons signal to local non-NMDA receptors and to more distant targets that express NMDA receptors.
A classic BPC preparation suited for studying exocytosis are the isolated goldfish, Mb1 BPCs (for review, see Tachibana, 1999) that possess large, singular synaptic terminals with ∼50 ribbons dispersed across their surface (Marc and Liu, 2000). Mb1 cells secrete the excitatory neurotransmitter glutamate, which has been monitored from dissociated Mb1 cells using a glutamate “sniffer-cell” (Sakaba et al., 1997; von Gersdorff et al., 1998), yet single release event properties were not resolved. A more common method for monitoring synaptic activity is to make paired recordings from presynaptic and postsynaptic cells, but in principle variability in postsynaptic measurements of release may arise from differences in retinal circuitry, heterogeneity in glutamate receptors (for review, see Lisman et al., 2007), morphology of the synapse (Coggan et al., 2005), glutamate clearance from the synapse (Clements et al., 1992), and the electrotonic structure of the postsynaptic cell (Bekkers and Stevens, 1996), which together can mask features of exocytosis. To directly follow the time course of release with a continuous and sensitive assay, isolated BPCs were coaxed to accumulate norepinephrine (NE) so that release could be monitored with amperometry.
The results presented here demonstrate that amperometric detection of false transmitter release from BPCs can faithfully resolve features of ribbon mediated secretion that have not been captured with conventional methods.
Materials and Methods
Tissue culture.
Retina were taken from large comet goldfish (5–7 inches, of either sex) in accord with the animal protocol approved by Institutional Animal Care and Use Committee at Yale University as previously described (Coggins et al., 2007). Eye cups were prepared by removing the cornea and then digesting the vitrea for 20 min at room temperature in 20 units/ml hyaluronidase. Next, the neural retina was removed from the eyecup and digested for 35 min at room temperature in papain (9 mg/ml) that was preactivated for 10 min in cysteine (0.5 mg/ml). The digested material was rinsed several times and stored in a 12°C–14°C, oxygenated refrigerator. And before each recording, one-fourth of the retina was mechanically dispersed and plated. The following low Ca2+, HEPES-buffered goldfish saline was used in the digestion steps, tissue storage and plating (in mm) as follows: 0.5 Ca2+, 120 NaCl, 2.5 KCl, 1.0 MgCl2, 0.5 CaCl2, 10 glucose, and 10 HEPES, adjusted to a pH 7.4.
Electrophysiology.
All whole-cell recordings were made in goldfish saline containing 2.5 mm Ca2+ in addition to the following (in mm): 120 NaCl, 2.5 KCl, 1.0 MgCl2, 10 glucose, and 10 HEPES, adjusted to a pH 7.4. The intracellular solution contained the following ingredients (in mm): 120 cesium methanesulfonate, 4.0 MgCl2, 10 HEPES, 10 TEA-Cl, 0.5 EGTA, 0.5 Na2GTP, 4.0 Na2ATP, adjusted to pH 7.3 with CsOH. Glass recording electrodes were prepared from thick-walled pipettes that were pulled to a resistance of ∼8.5 MΩ, using a Narishige vertical puller, and the tips were wax coated to reduce noise. However, to determine the amount of release over a range of voltages (data in Fig. 3J), four recordings were made with a perforated, whole-cell configuration as these recordings tended to last longer. For these recordings, the perforated pipet solution contained the following (in mm): 60 CsMeSO4, 60 CsCl, 10 HEPES, 10 CsEGTA, pH 7.3, and 266 mOsmol. Nystatin stocks were made at 10 mg/ml in MeOH and diluted to ∼2% in the pipet solution, mixed vigorously before each recording to create a final Nystatin conc. of 250 μm.
All whole-cell recordings, including membrane capacitance (Cm) measurements, were performed with a EPC-10 amplifier and Pulse software (HEKA Instruments). The liquid junction potential was nulled with the electrode in the bath when minimal positive pressure was being applied just before contacting the cell. The electrode's capacitance was subtracted in cell-attached configuration after achieving a seal typically >10 GΩ. Once intracellular access was gained with suction, the cell was dialyzed for 2 min before stimulating. Series resistance was typically between 18 and 25 MΩ. Whole-cell capacitance transients were subtracted, and membrane leak currents were estimated in advance of each stimulation by applying voltage steps equal to 10% of the stimulus amplitude. The whole-cell currents were sampled at 50 kHz and digitally filtered online at 2.9 kHz corner frequency using a Bessel low-pass filter provided in the Pulse software. To assure better control of the terminal's voltage, the whole-cell electrode was placed on the terminal of the intact cell when measuring stimulated changes in Cm and rapid, evoked release of NE, as presented in Figures 3 and 6, whereas the recordings presented in Figure 2 accessed the cell's interior from the soma. The cell's Cm was measured by applying a 500 Hz sine wave at an amplitude of ±15 mV around Vhold, sampled at 50 points per cycle, and computed with the “sine + dc” routine in the EPC-10 Lockin software (Lindau and Neher, 1988). The average change in Cm resulting from a 30 ms step depolarization was made by subtracting the Cm baseline averaged 500 ms before stimulating from the period 100–500 ms after stimulation.
Electrochemistry.
The method used for fabricating carbon fiber electrodes is essentially the same as described by Grabner et al. (2005), with one exception. The carbon fibers used in this study were 5 μm in diameter and purchased from Goodfellow. The sides of the carbon fiber electrode (CFE) protruding from the glass pipet remained insulated with epoxy after cutting the electrodes by hand with a scalpel. Every electrode was visually inspected with a microforge, set to 900× magnification, and only electrodes with flat, disc-shaped endings and intact epoxy on the sides of the cylinder were used in experiments. The low-noise recordings, such as those in Figures 4 and 7, were made with CFEs that had fibers protruding only ∼10–20 μm from the glass because longer fibers that are coated with epoxy still gain excess capacitive noise that is proportional to the surface area of the coated fiber extending beyond the glass. Electrodes were used only once. Amperometric recordings were made with an EPC-7 amplifier. The CFE was held at +750 mV relative to the silver-chloride, ground electrode. The signal was initially filtered through a 4-pole Bessel in the EPC-7 amplifier at 10 kHz and then fed into an 8-pole analog/Bessel filter (Analog Devices) set to a corner frequency of 8.5 kHz, which was collected at 50 kHz via the A/D of an EPC-10 (HEKA Instruments). All recordings were made at an inverted Zeiss Axiovert200, equipped with a 100×, 1.3 numerical aperture, oil-immersion objective and a 2× magnifying lens before the 10× eyepieces. Such high magnification was necessary to clearly view the side of the synaptic terminal when contact was being made with the CFE, and without causing injury to the cell as judged by a lack of spontaneous release at Vhold −60 mV. The CFE was set to an angle of 45 degrees relative to the plane of the coverslip, which made it possible to rest the CFE's entire disc shaped surface that was 2–3 times smaller in diameter than the cell (10–15 μm in diameter). Therefore, the path from the cell to the active surface of the CFE can be described as two opposing planes, which minimizes the diffusional distances and dilution of NE from peripheral origins.
Electron microscopy.
All of the EM reagents were purchased from Electron Microscopy Sciences. Dissociated retinal cells were prepared and plated on glass coverslips as described above. Once the cells attached to the coverslip, ∼20 min after plating, the cells were carefully rinsed in 2.5 mm Ca2+ recording media (described below) and equilibrated for 10 min at room temperature. Fixation, embedding, and sectioning have been described in detail previously (Coggins et al., 2007). Sections were viewed on a Tecnai 12 Biotwin electron microscope (FEI) that is maintained by the Center for Cell and Molecular Imaging at the Yale School of Medicine. Vesicle diameter was estimated as described previously.
Evoked release with 60 mm KCl.
To assess whether naive BPCs, not loaded with NE, released oxidizable compounds, amperometric recordings were made from the terminals of intact BPCs that were incubated in a solution identical to the NE loading solution, but absent NE, and the cells were plated as described above. The coverslip with attached cells was continually perfused in standard extracellular media that contained 2.5 mm Ca2+, and a multibarrel puffer controlled by a piezo stepper (Warner Instruments) was positioned ∼0.5 mm away from the cell to allow rapid and complete solution exchange with a delay of ∼250 ms. The puffer switched between the standard 2.5 mm Ca2+ extracellular media and a stimulating media with 60 mmol of KCl that was made by substituting 60 mmol of NaCl to keep the solutions isotonic. Each cell was stimulated with the high potassium solution for 2.5 or 4.5 s and then rinsed for 20 s before being stimulated one or two additional times.
Loading cells with NE and cell plating.
NE was selected as the false transmitter over other compounds for many reasons. Unlike dopamine (DA) and serotonin, NE is not known to be bioactive in neuronal retinal cells. Additional advantages of NE include that it is more resistant to air oxidation than DA and less expensive than 5-HT. NE, like DA, has a secondary amine that is more likely to become protonated in the acidic lumen of a synaptic vesicle, and the positive charge renders the molecule less membrane permeate, trapping it in the vesicle (Kim et al., 2000; Pothos et al., 2000). To load the cells, the papain-digested tissue was incubated in a hypertonic, low Ca2+ media plus NE and additional HEPES (in mm: 120 NaCl, 2.5 KCl, 1.0 MgCl2, 0.5 CaCl2, 10 glucose, 20 NE, and 100 HEPES, pH 7.4). Incubation typically lasted for ∼2.5 h (range, 1.5–3 h) and always at a temperature between 12°C and 14°C. The NE-loaded tissue was triturated and plated on glass coverslips in the NE loading solution, similar to the plating procedure for unloaded tissue as described above. At this time, the CFE and patch pipette were positioned above the recoding chamber, and ∼20 min was given for the cells to adhere to the coverslip. The cells were then carefully rinsed for 2 min in low Ca2+ media that contained 100 mm HEPES without NE, and slowly returned to low Ca2+ media (∼2 min). The cells were next equilibrated in the standard extracellular goldfish media containing 2.5 mm Ca2+ (in mm: 120 NaCl, 2.5 KCl, 1.0 MgCl2, 2.5 CaCl2, 10 glucose, 10 HEPES, adjusted to a pH 7.4) just before lowering the recording electrodes into the bath. A few features were key to producing healthy cells and good secretion of NE. First, the tissue had to be kept cool (∼14°C) before and during the loading, which we find is also true for tissue not loaded with NE. Second, a high HEPES concentration was found to be essential to keep the cells stable when NE was being removed. Third, the dissociated cell had to adhere to the glass, which allowed the cells to be washed, and eliminated movement, drift of the cell during dual-electrode contact.
Data processing and analysis.
To determine single spike parameters, amperometric traces were analyzed with MiniAnalysis software (Synaptosoft). Throughout the manuscript, the spike detection threshold was set to 5 × rms noise using MiniAnalysis, and additional filtering of the amperometric traces used the low-pass Gaussian filter in the MiniAnalysis program. Overlapping events were excluded from the analysis of single-event parameters. MiniAnalysis's Analysis Window was used for averaging events within cell by aligning events to the point immediately before 50% maximal amplitude (abbreviated as RT-50). In Figure 7, an additional alignment of spikes was performed, which used a cubic spline function, available in Origin software, to smooth and interpolate the data to 2.4 μs intervals over the following 3 points: (1) RT-50, (2) 20 μs before RT-50, and (3) 20 μs after RT-50. Individual fits were realigned in time to their half-maximal amplitude of the fit, and the average was then made within the cell and spliced into the parent cell's average and linearly interpolated over areas preceding and following the realigned rise. The temporal shift between the original average and the fit realigned data was measured within cell and then averaged across cells (see Fig. 7).
Describing response time and corner frequency.
Full bandwidth frequency was calculated as the effective corner frequency (efc) using the following formula (f in kHz): 1/(fc2) = 1/(f8.52) + 1/(f102), which gives an fc of 6.47 kHz for all amperometric records that were filtered at fc settings of 10 and 8.5 kHz (see above). Corner frequency was calculated in a similar fashion when the amperometric traces were further filtered with the Gaussian filter. When the Gaussian filter was set to fc values >50% of the original, full bandwidth, the rms noise was not sufficiently removed as illustrated in Figure 4E, which is a known property of this filtering procedure (Sakmann and Neher, 1983, chapter by Sigworth and Colquhoun).
To examine the frequency range of the amperometric data, Power Spectral Density plots were made (see Fig. 4D) from five cells while the CFE was in contact with the cell, but the cells were not voltage-clamped. One second segments containing spontaneous amperometric spikes were compared with recordings from neighboring stretches without spikes (baseline traces) (see Fig. 4D). Fast Fourier Transform calculations were performed with Origin (Microcal Software), and the power (amplitude2/Hz, abbreviated as Irms2/Hz) is plotted in Figure 4D, Di. Spectra calculated from baseline traces increased in power from 100 Hz to the fc, but spectra from traces with spikes are relatively flat over this lower range of frequencies. The actual fc estimated from baseline Power Spectral Density plots were measured as the point where the linear, ascending power intersected the initial taper in power. The more conventional S(0)/2 measure of fc (see below) was not possible to make because baseline spectra were not flat in the lower frequency range. The square root of the integral of power over Hz, which gives Irms, was made for the amperometric traces from 5 cells in Figure 4Di and yielded an average Irms = 0.71 ± 0.1 (mean ± SE). This value is comparable to the average Irms ∼0.65 pA made from these and additional cells (see Figs. 4E and 7) that was calculated in MiniAnalysis as the SD of the amperometric current. Figure 4Dii presents “Normalized Power,” which was calculated by taking the spectra and dividing them by their power at 0 Hz, so that S(0 Hz) = 1. In Figure 4Dii, the flatness of the difference spectra and spectra made from the average amperometric spike (see Fig. 4I) made it possible to estimate fc as S(0)/2.
The response time (tr) for the Gaussian filter has the following relationship: tr ∼ 0.340 s/fc, which estimates the time needed for the signal to reach maximal value. Because spike rise time data presented in Figure 4 are given as 10–90% RT, the relevant measure of the filter's rise time can be calculated as 10–90% RT = 0.8 × tr.
Quantifying the amount of evoked NE release.
To estimate the number of quanta within the period of a 30 ms step depolarization (see Fig. 6) or longer steps (see Fig. 2D), the following procedures were used: (1) the prestimulation baseline was averaged 100 ms before depolarization and set to zero, (2) the transient current artifacts appearing in the amperometric traces that arose from the onset and offset of the voltage step applied to the whole-cell electrode were subtracted from the amperometric trace, (3) the amperometric current was integrated to give the amount of charge over time, and (4) the trace of charge over time was divided by the average quantal size determined within cell. Finally, all of the recordings used to estimate the kinetics and quantal content of a 30 ms depolarization used only the first stimulation (the naive condition) to assure that rundown was kept at a minimum. The cumulative number of events during long step depolarizations were made by plotting the cumulative quanta from the first 30 ms depolarization, and beyond 30 ms the spikes were counted, and when spikes were partially overlapping, each peak in the cluster was counted as an individual event. However, two cells used to estimate the relative amount of NE released over extended periods were simply integrated from 0 to 500 ms (related to Fig. 2).
Results
BPCs can concentrate and spontaneously secrete NE as a false transmitter
Because glutamate is not appreciably oxidized at the surface of a bare CFE, this type of electrode cannot monitor secretion of glutamate directly. If by chance goldfish Mb1 BPCs concentrate and secrete oxidizable materials that have yet to be characterized, then CFE amperometry may sense the release of such compounds. To test this possibility, amperometric recordings were made by gently pressing the CFE (5 μm diameter) against the large terminal (∼10 μm diameter) of an isolated, intact Mb1 cell. Inspection of amperometric traces measured from several cells (n = 18) bathed in standard extracellular media failed to show secretion events (Fig. 1A). When cells were intentionally ruptured with the CFE to release their cytosolic contents, there was no change in the amperometric current, demonstrating that these cells lack appreciable levels of oxidizable materials.

BPCs are able to concentrate and secrete NE in small packets. A, A recording made by gently pressing the entire active surface of the CFE onto the terminal of a dissociated Mb1 BPC that had not been loaded with NE lacks amperometric spikes. B, An amperometric trace measured from a cell that was first incubated in NE, and here multiple amperometric spikes are seen to rise above baseline without any deliberate stimulation of the cell. C, Example spikes from B are shown on an expanded time scale to highlight their transient nature. D, Strong, spontaneous bursts of release measured from a cell bathed in standard extracellular solution and without deliberate stimulation. The amperometric traces are consecutive sweeps taken from the same cell, and each contains a burst of release, creating a large leading spike, which is followed by ∼1 s of desynchronized release. E, Membrane current (Im) was measured from a BPC with the patch-clamp electrode in on-cell configuration, shortly before applying suction to create whole-cell access. The deflections in Im are associated with an increased frequency of amperometric spikes (Iamp). The three consecutive pairs of Im and Iamp shown in E were measured from a single cell, and the pair of traces in F were collected from the same cell immediately after gaining whole-cell access and held at Vm: −60 mV. F, The absence of release was almost always the situation after gaining control of the cell's membrane voltage. What conductances underlie the change in Im were not investigated, and the patch pipet was filled with standard intracellular solution used in whole-cell recordings. All recordings in Figure 1 were made in standard extracellular media that contained 2.5 mm KCl and 2.5 mm CaCl2.
Cells that typically secrete electrochemically inert compounds, like glutamate, can be coaxed to concentrate and exocytose oxidizable transmitters (Zhou and Misler, 1996; Kim et al., 2000; Zhang and Zhou, 2002). Such exogenously applied molecules are commonly referred to as “false transmitters,” and they have been used in a variety of electrochemical (Kim et al., 2000) and electrophysiological (Pan et al., 1993) studies. The false transmitter method was adapted here to study secretion from Mb1 cells. NE was chosen to serve as the false transmitter because it is readily oxidized at a CFE, less susceptible to air oxidation than dopamine (Kim et al., 2000), and importantly BPCs have not been reported to express noradrenergic receptors; yet, vasculature within the eye expresses adrenergic receptors (Ferrari-Dileo et al., 1990; Dal Monte et al., 2012). The recording in Figure 1B shows several spikes measured from the terminal of an intact BPC bathed in standard extracellular media and preloaded with NE. A closer look at single spikes highlights the near-instantaneous rise to peak, and then exponential decay back to baseline (Fig. 1C), which is the expected profile for vesicular discharge of transmitter from a nearby source (Chow et al., 1992; Schroeder et al., 1992; Haller et al., 1998; Bruns et al., 2000).
Some of the cells produced strong bouts of release without any overt attempt to stimulate the cells (Fig. 1D). Previous studies of Mb1 BPCs reported spontaneous, rhythmic elevations in intracellular Ca2+ that were dependent on VGCCs (Burrone and Lagnado, 1997; Zenisek and Matthews, 1998). To assess whether Ca2+ was mediating release, cells were contacted by a patch-clamp electrode and their secretory activity was examined before and after filling the cell with an intracellular solution that buffered Ca2+ with 0.5 mm EGTA. Almost all of the cells (10 of 11) showed spontaneous release before gaining whole-cell access; and of the active cells, 70% produced strong bursts of release (Fig. 1E). When the cells were monitored with the patch-clamp electrode in on-cell configuration and voltage-clamp mode (Vhold: −60 mV), deflections in membrane current preceded and persisted through bouts of secretion (Fig. 1E). However, after gaining entry and establishing whole-cell, voltage clamp (Vhold: −60 mV), the cell release activity was silenced, and only one of 11 cells produced an amperometric event during a 1 min period of monitoring before the first stimulation (Fig. 1F). When these same cells were depolarized, robust release began within milliseconds (described in the next sections; Fig. 2), which demonstrates that Ca2+-stimulated exocytosis remained intact, but spontaneous secretion was quelled when Ca2+ entry was restricted at a hyperpolarized membrane potential.

A, B, Evoking release from BPCs. Cells not loaded (A) and loaded with NE (B) were stimulated with 60 mm KCl. Each trace begins and ends with 5 s of perfusion in standard extracellular media; and in the intervening 4.5 s period, 60 mm KCl was applied to the cell. The positive and negative deflections in the trace mark the on- and off-set of solution exchange (the exchange time was ∼250 ms). No amperometric spikes are apparent in the current trace in A; and of the 15 cells not loaded, stimulation with high potassium failed to produce secretion events before, during, or after depolarization. In contrast, the cell in B loaded with NE shows strong evoked release during the period of KCl application. Ci, The Ca2+ current generated in response to a voltage ramp from −60 to +60 mV, which was measured from cells preloaded with NE (n = 3 cells). C, Consecutive amperometry traces from paired amperometric and voltage-clamp measurements taken during prestimulation (VH: −60 mV), stimulation (step to −10 mV for 4.5 s), and poststimulation (VH: −60 mV). The calcium current, ICa, is presented beneath the amperometric trace during the stimulation. D, The rapid amperometric response is shown on an expanded time scale. C, D, The synchronous (*) and rebound in release (†) are highlighted. E, Plots of the cumulative events over time for the cell in C; the lower trace is an example of another cell with very similar kinetic phases though less than half the total number of events.
Step depolarizations reveal different kinetic phases of release
Figure 2B shows an amperometric trace measured from a cell loaded with NE and stimulated for 4 s with 60 mm KCl. The depolarization triggered what appears to be the release of many vesicles at the onset of stimulation, and spikes continue throughout the remainder of the KCl application. The time course of NE exocytosis is reminiscent of the rapid and sustained kinetic phases described by Sakaba et al. (1997) and von Gersdorff et al. (1998). The large current offset in the baseline that accompanies KCl application (Fig. 2B) is likely to arise from the distant release of NE, which is delivered to the CFE via the perfusion system (convective mass transport; cells not loaded failed to exhibit such an offset; Fig. 2A). To eliminate convective transport of NE to the electrode and to more precisely control the moment of depolarization, paired amperometric and whole-cell voltage-clamp recordings were made from NE-loaded cells.
Mb1 cells express L-type VGCCs that allow maximal Ca2+ entry in the range of −10 to +10 mV (Mennerick and Matthews, 1998). NE-loaded, intact Mb1 cells depolarized with a voltage ramp produced a maximal Ca2+ current of −110 ± 8 pA at +3.6 ± 2.4 mV (n = 4 cells; Fig. 2Ci). As illustrated in Figure 2C, secretion is silent at a resting potential of −60 mV; but at the onset of Ca2+ entry, stimulated with a Vm of −10 mV, a large spike in the amperometric current is generated. After this burst are desynchronized events that decline in frequency and then rebound at an accelerated rate from 50 to ∼350 ms (Fig. 2C,D). A steady, linear sustained rate persisted for the remaining depolarization and even a couple hundred milliseconds after stepping back to −60 mV. The cumulative number of events is plotted in Figure 2E for two cells with different total numbers of release events but similar kinetic phases. On average, the first 30 ms of a prolonged depolarization to −10 mV amounted to 22 ± 2% of the total number of vesicles released by 500 ms (n = 3 cells).
Two kinetic components of release exist within the rapidly releasable phase
Numerous studies have investigated rates of exocytosis in response to brief depolarizations and concluded that hundreds of vesicles fuse within the period of a 30 ms step depolarization to ∼0 mV (Mennerick and Matthews, 1996; von Gersdorff et al., 1998; Burrone and Lagnado, 2000; Heidelberger et al., 2002; Coggins and Zenisek, 2009). To assess whether intact cells loaded with NE are able to incorporate vesicle membrane at a similar rate, cells were simultaneously monitored with amperometry and membrane capacitance techniques. Figure 3A shows an example of an evoked response stimulated with a 30 ms depolarization to 0 mV, which shows an abrupt, transient spike in the amperometric signal that occurs during a steady Ca2+ current (for the average response, see Fig. 3B), and Cm measured after stimulation rose by ∼40 fF (Fig. 3C). Of the cells examined, an increase in Cm was always accompanied by a burst of NE secretion, and the average change in Cm was 40 ± 2 fF (n = 4 cells; Fig. 3C), which is similar to previous measurements of capacitance increases from isolated Mb1 terminals with a similar intracellular Ca2+ buffering and stimulation protocol (Mennerick and Matthews, 1996; von Gersdorff et al., 1998).

Two kinetic phases constitute the primed pool of vesicles. Amperometric and membrane capacitance measurements were simultaneously made from intact cells to assess the rate of membrane incorporation and secretion of NE. A, The amperometric current (Iamp) and Ca2+ current (ICa) that resulted from a 30 ms voltage step to 0 mV. The voltage protocol is represented schematically, labeled Vh. Artifacts in Iamp and ICa arose from the voltage step to 0 mV and the sine wave stimulation used to monitor membrane capacitance. B, The averaged Iamp and ICa determined from cells stimulated as in A (Iamp: average peak amplitude = 6.6 pA at 2.2 ms, and the charge integral = 24.2 fC; ICa: −112 ± 30 pA; n = 4 cells). C, Membrane capacitance (Cm) and series conductance (Gs) estimates are plotted for the stimulation presented in A, which created a jump of ∼40 fF without a corresponding change in Gs. The average Cm and Gs measured before and after stimulation of the four cells used to construct B are presented in C (right) and amounted to 40 ± 2 fF and 4.8 ± 2.5 pS, respectively (red trapezoid indicates moment of stimulation). D, An amperometric current measured during a 30 ms step to 0 mV (the period of the step depolarization is indicated by the dashed line), and the desynchronized phase is presented at higher resolution in E. F, The current integral for the trace in D. G, Plot of the average normalized cumulative amperometric charge from 15 cells stimulated in identical fashion to E (see main text for absolute values). The normalized curve is fit with a biexponential equation (red line) that yielded τ values of 1.5 and 16.4 ms, and the onset of release had a delay time = 1.4 ms and estimated from the start of the depolarization to the point when the fitted curve intersected zero, baseline (green line). H, Alterations in synchronous release resulting from a series of steps to different membrane potentials. Hi, Plot of the cumulative amperometric charge. Circles indicate the point when charge reached ∼20% of the total attained at the end of a 30 ms depolarization. I, Plots of the same traces shown in H on an expanded scale to highlight the loss of synchrony. J, The amount of release measured as the cumulative amperometric charge after 30 ms steps to the voltages indicated on the x-axis. Release was normalized within cell to the maximal response in the series of depolarizations and then averaged across cells. Stimulations were given at 20 or 30 s intervals, 10 mV increments, and in ascending order (n = 6 cells) and additionally in descending order (n = 4 cells, which were made in perforated patch configuration). K, Transient stimulation of amperometric spikes was achieved with voltage steps to +40 mV for 0.5 ms, at 1 Hz. Ki, The three stimulations of a series of 20 cycles that generated successful release in K. Kii, The events from the same cell triggered late in a step to 0 mV for 30 ms (as in E). L, Plot of a series of steps to 0 mV for 0.5 ms, at 1 kHz, delivered to the same cell in K, but here the step to a lower voltage was insufficient to stimulate release.
Mennerick and Matthews (1996) demonstrated that a strong step depolarization stimulates the fusion of an “ultra-fast” pool of vesicles that empty with an estimated time constant of ∼1.6 ms (also see Heidelberger, 1994). The protocol used to measure membrane capacitance was achieved by applying stimulations of varying length to generate plots of dCm over time and the period needed to measure Cm increases the sampling time. Thus, these measurements are discontinuous and unable to distinguish between vesicle fusion during the stimulation from asynchronous events happening after the calcium channels have closed. Furthermore, changes in membrane capacitance are not always simultaneous or even correlated with secretion (Haller et al., 1998; Yamashita et al., 2005). To examine this initial kinetic phase of release with the continuous amperometric readout, NE-loaded cells were given a brief voltage step to 0 mV. Figure 3D shows an individual amperometric trace that exhibits synchronous release immediately after the onset of stimulation, and this was trailed by desynchronized events that are presented on an expanded time scale in Figure 3E, and the cumulative charge is plotted in Figure 3F. From the average response, release is shown to start after a delay of 1.4 ms after the onset of depolarization, peaked at 2.3 ms with a 10–90% rise time of 1.0 ms, reaching 5.1 pA, and forming a half-width of 2.0 ms (the average ICa was −97.7 ± 13.6 pA). The normalized cumulative charge can be nicely fit as a biexponential process with time constants of 1.5 and 16.4 ms (Fig. 3G). When accounting for the time needed to change the voltage of an intact Mb1 cell (∼0.7 ms) (Mennerick et al., 1997) and activate the calcium channels (∼0.2 ms) (Mennerick and Matthews, 1998), which on average required 0.94 ms to reach 50% ICa in this study when stepping to 0 mV, the delay between Ca2+ elevation and release onset is estimated to be <0.5 ms (also see Fig. 3K). Hence, the amperometric approach reveals that the first kinetic phase of release is synchronized to Ca2+ entry and a second novel trailing phase is an order of magnitude slower even though Ca2+ continued to enter at a steady rate. Both phases of release are likely arising from the membrane directly opposite the electrode because the fast up and down strokes in the amperometric current demonstrate the nearness of the source and the rapid oxidation of NE (Zhou et al., 1996).
The synchronous burst of release often has a split peak (Fig. 3A,D,H), and spikes or rounded transitions in the rising and falling phases are also common (Fig. 3H), which suggests the contribution of individual vesicles. To examine whether the burst could be decomposed into smaller components, the following two approaches were taken to minimize the synchrony of vesicle fusion: (1) the cells were given a series of 30 ms steps to different depolarizing potentials; and (2) release was stimulated with very transient 0.5 ms steps. In the first approach, the amount of release produced in response to a −20 mV depolarization for 30 ms reached 83% of the maximal amperometric charge resulting from 30 ms steps to more positive potentials between −10 to +20 mV (Fig. 3J). However, the time taken for steps to −20 mV to reach the same initial 20% of amperometric charge that was attained by steps to 0 mV was on average threefold greater (an additional 4.8 ± 1.3 ms; paired Student's t test: p = 0.04; n = 4 cells), which illustrates that the synchronous phase can be dispersed over the 30 ms period by lowering the stimulus intensity. The second approach used steps to +40 mV for 0.5 ms that generated small Ca2+ tail currents upon return to −60 mV, which were able to trigger amperometric spikes with delays of ∼0.5–1.5 ms (Fig. 3K). The tail-triggered spikes appear similar to individual spikes recorded during the desynchronized phase triggered during steps to 0 mV (Fig. 3Ki,Kii); furthermore, the largest amplitude of a tail-triggered spike was only a fraction of the peak amplitude of the synchronous response measured within the same cell (22 ± 5%; tail-triggered, 1.8 ± 0.6 pA; and synchronous bursts, 8.0 ± 2.4 pA; n = 3 cells), yet the time of release was tightly coupled to the start of the stimulation under both conditions, and no spontaneous amperometric events were measured over these periods. Together, these results argue that the burst of release is derived from the highly synchronized fusion of multiple vesicles.
Detection of unitary events
To estimate the number of vesicles fusing during the 30 ms stimulations, the amount of NE forming a single amperometric spike had to be determined. This first required developing a rational approach to separating the amperometric events from the noise. In Figure 4A–C, it is apparent that the removal of noise with low-pass Gaussian filtering unmasks smaller amplitude events (Hochstetler et al., 2000). Figure 4D describes the influence of low-pass filtering on the amperometric traces in the frequency domain (also see Materials and Methods).

The majority of events are captured only after low-pass filtering. A–C, An amperometric trace at 6.5 kHz fc (A), and then further low-pass filtered to 2.7 kHz fc (B) and 1 kHz fc (C). The dashed line above each trace indicates the spike detection threshold (set to 5 × rms noise), which amounted to amplitude thresholds of 2.78, 1.30, and 0.51 pA, and gave way to 14, 22, and 25 events, respectively, from A to C. D, Power Spectral Density plots for amperometric traces with amperometric spikes (filled circles) and without (open circles), and the difference spectrum (red symbols). The average “baseline” spectrum increases in a linear manner, but the average spectrum made from traces “with amperometic spikes” is relatively flat from 100 to ∼2000 Hz. Di, Plot of baseline spectra at full bandwidth and after filtering with the standard Gaussian routine to effective fc settings of 2.7 and 1 kHz. The actual fc for each spectrum is illustrated in the graph as the intersection between the ascending power (solid green line) and the start of taper (hyphenated green line) (see Materials and Methods). Dii, Comparison of the “difference spectrum” from D with the spectrum for the average single event analyzed at full bandwidth (I), and the spectra have similar fc ∼800 Hz values, which converts to a τ ∼ 200 μs that is similar to the decay constant of single events (Fig. 7). D–Dii, The power was binned over every 50 Hz (D, Di), and the data were subject to a 20 point smooth (Di). E, The rms noise plotted over fc follows a linear relationship (dashed line), except for the points at 4.0 and 4.4 kHz (*), which are too close to the original fc for the noise to be significantly attenuated (see Materials and Methods). F, Plot of the fraction of events detected over the linear range of filtering, which was calculated by normalizing within the cell, and then across cells to make the mean ± SE for each fc setting. The average number of events plotted in F at each fc was normalized to the number measured at 1 kHz fc. Event detection increased dramatically going from 30 to 73% of the total when the fc was lowered from 6.5 to 2.7 kHz (p < 0.00001; paired Student's t test), and smaller gains in event numbers resulted with further filtering to 1.8 kHz fc (93% of the total; p < 0.001). No significant change in event number occurred when transitioning from 1.8 to 1 kHz fc (a 6% increase; p = 0.13). G, Plot of the average (±SE) spike charge over fc, and the point at 2.7 kHz marks the only significant difference in spike charge between neighboring points (p < 0.001 for larger and smaller fc values). H, Frequency distributions plotted for spike parameters determined at the fc indicated in the plot. Arrowheads in the amplitude distributions indicate the detection thresholds, and the arrowheads in 10–90% rise time distributions show the Gaussian filter's response time. The 10–90% RT for fc (kHz) settings of 6.5, 2.7, and 1 are predicted to be limited to 42, 101, and 272 μs. I, The same average event at full bandwidth, and after refiltering to a 2.7 and 1 kHz fc to illustrate the decrease in spike amplitude, and slowing of the rising phase. J, K, Spike amplitude versus charge is presented for full bandwidth and 1 kHz datasets (J), and full bandwidth versus 2.7 kHz data (K). D–K, Data were determined from 10 cells. Traces analyzed at 1, 1.8, 2.7, and 6.5 kHz fc had the following charges: 0.84 ± 0.02, 0.87 ± 0.03, 0.98 ± 0.03, and 1.33 ± 0.05 fC.
Figure 4E plots the rms noise over fc, and the relationship between the number of events exceeding 5 times the rms noise for a given fc is presented in Figure 4F. The threshold crossings at 6.5 kHz fc were only 30% of the total measured at 1 kHz fc. Over the lower range of fc settings where noise reduction and fc are approximately linearly related (Fig. 4E), 80% of the events detected at 1.8 kHz were also captured at an fc of 2.7 kHz, but an insignificant difference of 6% was witnessed between 1.8 and 1 kHz (Fig. 4F). From these results, the advantage of noise removal is a gain in event detection frequency, but low-pass filtering also attenuates high-frequency currents arising from exocytosed NE (Fig. 4D–Dii), which can introduce sluggish response times that affect the spike's kinetics and amplitude. In contrast, a spike's charge is not distorted with the Gaussian filter routine used in this analysis (Fig. 4I) (for review, see Sakmann and Neher, 1983, chapter by Colquhoun and Sigworth) and spike charge is an additional, independent parameter for evaluating the types of events.
The relationship between spike charge and fc is positively correlated, with spikes measured from traces filtered to 2.7 kHz fc being significantly different from neighboring filter settings of 1.8 and 6.5 kHz (Fig. 4G); however, spike charge measurements made at 1 kHz fc were similar to those analyzed at 1.8 kHz fc (5% difference; p = 0.38). The plateau in event charge at lower fc settings suggests that the majority of events are detected at a bandwidth of 1 kHz, which is in accord with the finding that the change in event number is insignificant over this range of fc settings. Low-pass filtering in this context has unearthed the smallest spikes.
What useful spike kinetics can be derived from the low-pass filtered data? The average spike analyzed at 6.5 kHz fc has a 10–90% RT of ∼140 μs, which is slower than the filter's 10–90% response time of ∼42 μs (Fig. 4H); therefore, by this measure, the rising phase is not limited by the filter (this is examined further in Fig. 7), but these are only a minority of the total events that are detected at 1 kHz fc. As the fc is lowered to 1 kHz, the filter's response time is limited to 340 μs, which shifts the events detected at higher bandwidths to longer rise times and half-width values and suppresses their amplitudes (Fig. 4H). Thus, more low-pass filtering creates a false sense of linearity between amplitude and charge (Fig. 4J, 1 vs 6.5 kHz fc) and reduces the slope, but it remains possible that the smaller amplitude events are actually kinetically distinct as can be inferred from the analysis performed at the intermediate fc of 2.7 kHz that shows a clustering of smaller charge events <0.5 fC that are not linearly associated with larger amplitude events (Fig. 4K). Plots of amplitude versus charge when made from chromaffin granule release events are also not linearly related over all size ranges (Elhamdani et al., 2001; Grabner et al., 2005).
Single events are uniformly distributed in size
The spike charge distributions derived from events detected with progressively stronger filtering are presented in Figure 5A–C. Clearly, the distribution of event sizes broadens as the noise is removed, growing toward small quantal events, and leading to a increased coefficient of variation (fc: CV; 6.5 kHz: 0.36; 2.7 kHz: 0.46; 1 kHz: 0.51). Several lines of evidence argue that the high CV in spike charge measured at 1 kHz is not attributable to recording, or between cell, variability. First, the rms noise and likewise the amplitude threshold varies little across recordings, and this kept the amplitude detection threshold constant (Fig. 4E). Second, the ensemble averages for these cells are highly uniform (Fig. 5D). And finally, the spike charge distributions (Fig. 5A–C) and the average events (Fig. 5D) were created by incorporating a similar number of events from each cell to give them equal influence on the distribution. These findings support the interpretation that the spread in charge values measured in the 1 kHz dataset arises from variation in secretion events common to most cells.

Single events form uniform Q1/3 and vesicle size distributions. Charge distributions for traces analyzed at fc settings of 6.5, 2.7, and 1 kHz are presented in A–C, respectively. A, At full bandwidth, the distribution shows the least amount of spread (CV = 0.36), the smallest number of events (782), and is centered at the largest mean charge. B, C, The distributions show a dramatic growth in the number of events (N = 1751 and 2296 for fc settings of 2.7 and 1 kHz, respectively) and a shift to smaller sizes (0.84 and 0.78 fC, respectively), which broadens the distribution (CV: 2.7 kHz = 0.46; 1 kHz = 0.51). D, The ensemble averages constructed from traces low-pass filtered to 1 kHz fc show modest cell-to-cell variability, even though the CV for spike charge measured within each cell was ∼0.5. E–G, Plot of the cube-root of the spike charge (Q1/3) determined from traces analyzed at 6.5, 2.7, and 1 kHz fc settings. H, Plot of the 1 kHz data (columns) with three Gaussian curves from fits to the plots in E–G. The 2.7 and 1 kHz datasets are centered at the same value, and the right half of the distributions are similar, whereas the full bandwidth dataset only captures the largest events. The distributions were constructed by taking an equal number of events from each cell, whereas data in Figure 4 simply took all events. I, Electron micrograph showing a thin section (60 nm) through a BPC in intact tissue highlights the organization of vesicles around the ribbon as well as its orientation with the postsynaptic structures. Scale bar, 50 nm. J, The vesicle size distribution made from BPCs captured in tissue shows a prominent peak at ∼47 nm (558 vesicles/5 cells, total average: 46.7 ± 7.3; fit to the main peak: 45.3 ± 4.25). K, L, EM images of ribbons witnessed in dissociated BPCs that were loaded with NE before fixation. Scale bar, 50 nm. L, The section was not poststained with lead in an attempt to demonstrate the increased contrast generated by the electron-dense NE in the SVs. M, The vesicle size distribution made from four dissociated BPCs loaded with NE, which are tightly grouped at ∼43 nm (800 vesicles and 200 vesicles/cell; total average: 45.8 ± 9.3; fit to main peak: 42.7 ± 5.25).
Another approach often used to inspect the population of amperometric events is to plot the cube-root of the charge (Q1/3) (Wightman et al., 1991; Bruns et al., 2000). Figure 5E–G plots Q1/3 for the same events presented in Figures 5A–C, and this gives the 1 and 2.7 kHz datasets a more Gaussian profile that is centered at ∼0.92 fC1/3 (Fig. 5H). The far left side of each distribution appears to lack small events, and this is more pronounced in the 2.7 kHz dataset than the 1 kHz dataset. Assuming the geometry of the Q1/3 distribution is truly Gaussian, then the left half of the 1 kHz distribution, which appears to end prematurely at ∼0.6 fC1/3 (∼700 molecules), is taken to represent the system's limit of detection rather than the actual smallest event. If the smallest events were missed, the central mode of the Q1/3 distribution (0.92 fC1/3) will provide the most reliable estimate of the average charge, and from the plot in Figure 5G the average spike charge is 0.78 fC, which equates to 2429 molecules of NE released per event.
NE-loaded synaptic vesicles are uniformly distributed in size
In a previous study, we reported that the majority of synaptic vesicles in dissociated BPCs are closely grouped in size (Coggins et al., 2007), which has also been described by other groups (Holt et al., 2003; Paillart et al., 2003). The cytoplasm of cells loaded with NE show numerous small-sized SVs, and their ribbons display a rich halo of tethered vesicles (Fig. 5K). An examination of vesicle morphologies common to BPCs in intact tissue was also made (Fig. 5I). Plots of vesicle sizes measured from dissociated, NE-loaded cells, and intact, untreated retinal preparations (Fig. 5J,M) have abundances of vesicles between 40 and 45 nm (outer vesicle diameter). Dissociated cells show slightly more variation in vesicle size (CV = 0.20) than SVs in intact tissue (CV = 0.17), arising from the addition of more smaller- and larger-sized vesicles. Other studies have described a greater degree of variation in vesicle sizes in the dissociated condition (Holt et al., 2003; Paillart et al., 2003; Matthews and Sterling, 2008) than experienced in intact tissue (Lagnado et al., 1996; von Gersdorff et al., 1996). This is likely an outcome of higher spontaneous activity in dissociated cells (unclamped), which lack the inhibitory feedback that is present in situ (Matthews and Sterling, 2008).
Amperometry studies commonly compare the cube-root of charge distribution to vesicle diameter sizes to assess the influence of vesicle morphology on secretion (Finnegan et al., 1996; Pothos et al., 1998; Bruns et al., 2000; Grabner et al., 2005). These studies have proposed that the releasable transmitter content is proportional to the volume of the vesicle; therefore, the distribution of Q1/3 should be influenced by the distribution in vesicle diameters. Both the secretion and vesicle distributions reported here are Gaussian in shape, and events analyzed at 1 kHz fc (the most inclusive filter setting) have a CV equal to 0.17, which is similar to the CV estimated for all vesicle diameters. Given the amount of transmitter released per event (<2500), the concentration of NE for a 40 nm vesicle equates to 0.25 m, which is similar to previous estimates derived from cells that normally exocytose catecholamine and indolamine compounds (Wightman et al., 1991; Bruns et al., 2000; Grabner et al., 2005).
The quantal content of primed vesicles at a ribbon
The number of vesicles fusing during a depolarizing stimulus has been measured at specialized synapses, such as the calyx of Held, where it is possible to control Ca2+ entry while simultaneously monitoring the EPSC. A complication in this approach is the need for extensive algorithms to sort out the quantal size, which is a prerequisite for estimating the quantal content (e.g., Neher and Sakaba, 2001). Amperometry is well suited for measuring quantal size of dopaminergic (Pothos et al., 1998) and serotonergic (Bruns et al., 2000) SV release events, but these previous amperometry studies from neurons stimulated release through bath application of secretagogs or current-clamp techniques. Unique to this study is the ability to voltage-clamp the cell and tightly control calcium entry, making it possible to then estimate the quantal content of the rapid evoked response.
The integrated oxidative current measured over a brief stimulation was divided by the average single-event charge (determined within cell), which yielded on average 27 ± 3 quanta per recording site (active surface area of electrode, 19.6 μm2) at the end of the 30 ms depolarization (one recording site/cell; n = 11 cells). Plots of individual evoked responses are overlaid and presented as cumulative quantal content in Figure 6A. Inspection of the entire set of charge over time traces reveals that the number of quanta released in 5 ms (a period ∼3-fold > the fastest kinetic component of evoked release; see Fig. 3G) appears to predict the final outcome at 30 ms. The magnitude of the fast and slow phases are plotted separately (Fig. 6B,C), and the relative contribution from the first 5 ms and remaining 25 ms is 57% and 43%, respectively (Fig. 6D). Figure 6E shows that the quantal content of the fast and slow kinetic components are correlated with one another, which is taken as evidence that both release phases originate from the same type of structure. Assuming these events originate from vesicles docked at ribbons, and a previous study has reported that dissociated Mb1 BPCs express ∼1.9 ribbons per 20 μm2 of membrane surface area (Zenisek et al., 2004), an average output of 26 quanta/1.9 ribbons leads to an estimate of 14 vesicles/ribbon in 30 ms.
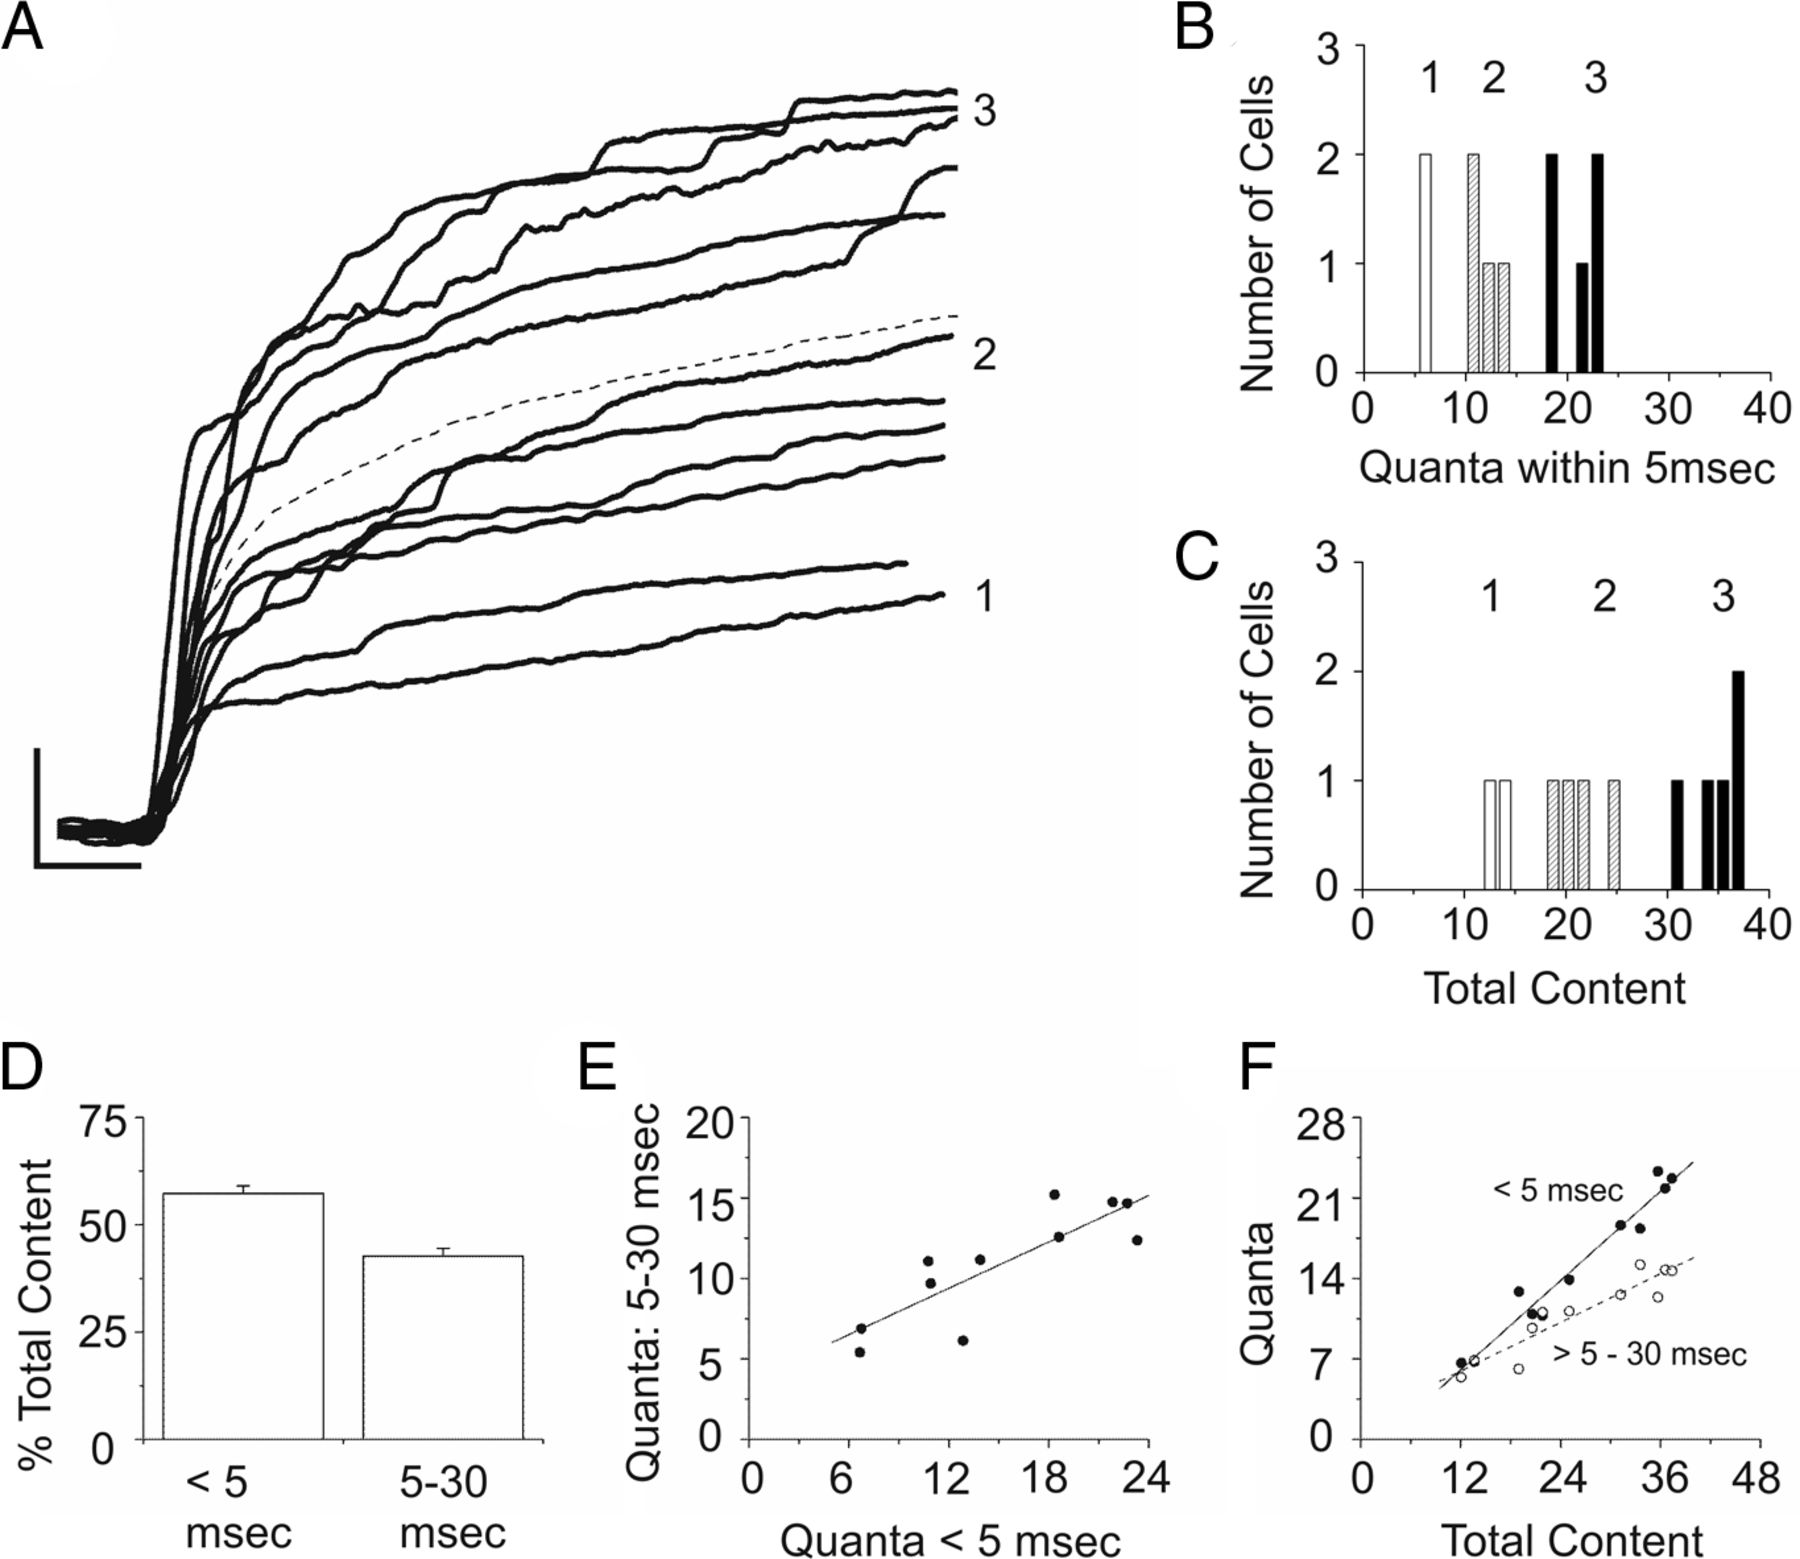
The quantal content of the rapid phases of release. A, Plots of the cumulative number of quanta released. The dashed line represents the average response, which equaled 15 quanta after 5 ms and 27 quanta for the entire 30 ms stimulation to 0 mV (y-axis = 7 quanta, and x-axis = 5 ms). B, The number of cells versus the quantal content within the first 5 ms of stimulation. C, The total content measured from the entire 30 ms stimulation. Labels 1, 2, and 3 are on the right side (A) and above the bins (B, C), and mark the same groups of cells; they are situated at 12, 24, and 36 quanta in A and C. B, The labels are positioned at 6, 12, and 24 quanta. D, The percentage of total release occurring within each window of time was significantly different: 57 ± 2% and 43 ± 2% (p = 0.002). E, Both periods of release are linearly related with one another. F, Plots of the quanta per phase on the y-axis versus the total content on the x-axis (closed symbols, <5 ms; open symbols, 5–30 ms). The quantal size was determined for each cell (n = 11 cells) and measured during spontaneous activity before establishing whole access (breakin).
Amperometric spikes are preceded by a brief foot signal
The profile of catecholamine released from individual neuroendocrine granules, and detected with amperometry, is well known to deviate from the profile of release expected for an instantaneous point source (Chow et al., 1992; Schroeder et al., 1992; Albillos et al., 1997). Individual granule exocytotic events often exhibit an elevation in amplitude that precedes the larger, main spike, and this prespike feature is considered to represent a transition from a low to high conducting pore. To look for such a feature in synaptic vesicle fusion events, amperometric spikes were inspected at full bandwidth (6.5 kHz fc) to avoid loss of transient features in the spike's rising phase. Because an event's intersection with the baseline is complicated by noise, it is difficult to evaluate this portion of the rising phase on an individual spike basis; therefore, single events were aligned to their rising phase at half-maximal amplitude (RT-50) and averaged. Figure 7A presents superimposed, aligned events for two separate recordings to highlight the event's rapid ascent and exponential decay back to baseline, and Figure 7B shows an ensemble of averages within cell; the grand average from these cells is shown in Figure 7C.

A stammer in the rising phase is apparent in events analyzed at full signal bandwidth. A, Sets of spikes from two cells, presented at full bandwidth, are superimposed to illustrate differences in their kinetic features (the average per cell is shown in red; 43 events above and 60 events below). B, An overlay of several average spike profiles that were aligned as in A, and at 6.5 kHz fc their average rms noise was 0.59 ± 0.03 pA (mean ± SE; n = 8 cells). C, The spike represents the average made from the cells in B, which is presented as mean with error bars (SD). The red arrow indicates the RT-50 point used to align the events (average spike properties, amplitude: 3.80 pA; charge: 1.18 fC; decay time: 0.20 ms; half-width: 0.28 ms; and the 10–90% RT was 120 μs). B, C, Plotted on the same scale. D, The average rising phase from C is shown on an expanded time scale, and a linear fit to the baseline is drawn as a hyphenated line, and the open arrow indicates the first point exceeding 2 × the baseline's SD. E, Individual events were sorted into small (<4.5 pA; black points) and large amplitude events (>4.5 pA; red points). To illustrate that the rising phase of large events more closely follow an exponential rise than small events, an exponential fit was made to the initial portion of the spikes' rise and then extrapolated (red line). E, For clarity, the error bars (SD) are displayed for the smaller sized events, but not for the larger events. To test the susceptibility of the full bandwidth spikes' rising phases to corruption from baseline noise, an ideal step waveform was inserted into the baseline of actual amperometric recordings to assess whether rising phase could gain a prespike foot feature. F, Comparison of the average spike from C to an ideal step filtered to an fc of 6.5 kHz, and the ideal step that was recovered from amperometric traces, “step + noise.” G, Comparison of the average small and large event to an ideal step that was filtered to an fc of 4 kHz, and the average step recovered from amperometric traces, “4kH Step + Noise.” F, G, Traces are aligned to their RT-50, and the amperometric sweeps were collected at 20 μs intervals and the idealized steps were sampled at the same rate. H, Small and large events were fit and interpolated with a cubic spline function around RT-50, then realigned along their rising phase (see Materials and Methods), and presented here with their amplitudes normalized. H, I, Red and black data points designate large and small events, respectively. I, The initial rise from baseline for average events shown in H is fit with an exponential function (time constant = 24 μs; r2: 0.99, for each; see Table 1 for more statistics). The duration of the spike “stammer” is schematically represented as black (small events) and red (large events) polygons, starting at the point the exponential fits rise above baseline to the point where the extrapolation of the linear portion of the rising phase intersects baseline (Zhou et al., 1996). H, I, The realignment of RT-50 analysis was made from 6 cells, 379 events. A–G, The data were derived from 8 cells, 747 events. C–I, The averages were first made within cell and then across multiple cells, and statistics are presented for individual cell averages.
The rising phase of the average spike elevates above a threshold of 2 × the rms noise at ∼120 μs before RT-50 and progresses at a relatively slower rate before rapidly jumping to peak amplitude (Fig. 7D). By grouping these events into two amplitude size ranges, it was possible to identify heterogeneity in the early portion of the rising phase, with the average small event (<4.5 pA) exhibiting a greater delay before the onset of the main spike (Fig. 7E). If the transmitter were diffusing from an instantaneous point source to the much larger surface of the CFE, the rising phase of the spike should have an exponential rise until it reaches an inflection point before stepping to peak amplitude (Chow et al., 1992; Schroeder et al., 1992). An exponential curve fit to the early portion of the small and large events, and then extrapolated further, shows that the small events pause momentarily at ∼40 μs before RT-50, whereas the larger events more closely conform to the exponential rise (Fig. 7E).
The events detected at full bandwidth are closer to the noise, putting them at a higher susceptibility to contamination from random signal fluctuations, which could produce an erroneous feature at the foot of the spike. To rule out this possibility, square-wave steps were repeatedly immersed into actual stretches of amperometric traces that lacked secretion events, and then the hybrid traces were analyzed at full bandwidth to test whether the noise could add a foot signal to the ideal step. Square-waves with similar amplitude and the same sampling rate as the actual average spike set to two different corner frequencies (6.5 and 4.0 kHz) failed to acquire a prespike foot from the noise (Fig. 7F,G). This demonstrates that the ensemble averaged, foot signal apparent in small events is neither diminished nor born from random noise.
As shown in Figure 7D–G, the spikes transit most rapidly through their rising phase, depositing only 1 point between 50 and 80% of the spike's upstroke. To improve on the kinetic description of the rising phase, the data points immediately before and after RT-50 were digitally smoothed and interpolated through RT-50 using a cubic spline function (see Materials and Methods). The interpolated data points were set to an interval of 2.4 μs, improved from the original sampling rate of 20 μs, and the new fits were realigned to their RT-50. This procedure shifted the rising phase leftward by 6 ± 1.4 μs from the original RT-50, and the original points before and after RT-50 were leftward shifted to a lesser extent (2.3 ± 2.7 μs and 4 ± 1.9 μs). By normalizing the amplitudes of the realigned small and large events, a high degree of overlap above RT-50, along the steepest, linear portion of the rising phase, is nicely illustrated in Figure 7H,I, and Table 1. Exponential fits to the small and large events initial rise give similar values (τ ∼ 30 μs; Table 1), but the small events deviate much earlier from the exponential fit compared with large events, pausing for an additional ∼50 μs before rejoining the fast upward accent. The resultant average response is reminiscent of a prespike foot that has been observed in release from dense core granules (Chow et al., 1992), suggesting a brief small opening of the fusion pore precedes its dilation.
Rising phase properties of average small and large events
Discussion
The false transmitter method extends our understanding of vesicle priming and single-event fusion properties
Several studies exploring exocytosis from Mb1 BPCs have described a very rapid evoked response (Heidelberger, 1994), and there is also ample evidence that prolonged depolarizations can stimulate late phases of release with time constants of a few hundred milliseconds (Mennerick and Matthews, 1996; Palmer, 2010). The data presented in this study recapitulate these well-established rapid and late phases of release; and by virtue of the amperometric signal's sensitivity and superior temporal readout, novel features of release were resolved at the level of single events and evoked responses.
Vesicles in different primed states coexist at the ribbon
Separate research groups studying exocytosis from Mb1 BPCs have proposed that 17–20 vesicles are physically tethered to the base of the ribbon where it joins the plasma membrane (von Gersdorff et al., 1996; Llobet et al., 2003), and these vesicles are thought to be the first to fuse with a τ ∼ 1.6 ms (Mennerick and Matthews, 1996), which was referred to as the “ultrafast” component of release. Here we directly measured the quantal content from a circumscribed area of membrane and found an additional rapid, kinetic stage of release. The first phase formed a multiquantal spike, synchronized to the onset of Ca2+ entry, and expired with a τ = 1.5 ms. The second component involved multiple fusion events that were distributed over a greater period of time, τ = 16 ms, and referred to as the desynchronized phase. The quantal content measured for each phase was correlated in size per recording site (Fig. 6), which is interpreted to reflect a common ribbon structure gives rise to both phases of release. As described in Results, a ribbon is estimated to release 14 vesicles within a 30 ms step to 0 mV. This estimate is 3–6 vesicles less than the number of docked vesicles at a Mb1 ribbon's base (von Gersdorff et al., 1996; Llobet et al., 2003), which could represent a population of “unprimed” vesicles. It is also possible that the morphological estimates of docked vesicles are overestimates, or alternatively a few of the fusing vesicles lack NE and are not captured with amperometry. In summation, our results demonstrate a temporal splitting of the “ultrafast” component of release that could not be resolved using other techniques, and we propose that two pools of primed vesicles are formed at the ribbon synapses.
Independently fusing vesicles are likely to form the two rapid kinetic phases of release
The synchronous phase is realized by stepping to 0 mV and is proposed to originate from the fusion of vesicles in less than perfect unison (Isaacson and Walmsley, 1995), as can be inferred from the small spikes decorating the burst phase as it rises, peaks, and then falls (Fig. 3A,D,H). The synchrony was disrupted by stepping to less depolarizing voltages for 30 ms (Fig. 3H–J); and at the other extreme, stepping to +40 mV for 0.5 ms elicited small amplitude, single events that were tightly synchronized to the brief tail currents (Fig. 3I,K). The desynchronized events and tail-triggered spikes were rapid to rise and fall (Fig. 3E,H,J), demonstrating their nearness to the electrode. The recording configuration was optimized to collect events in direct opposition to the CFE (see Materials and Methods).
Another possibility is that the two phases of release originate from a greatly oversized vesicle forming either before or after Ca2+ entry (Matthews and Sterling, 2008). If a large transmitter-filled vesicle were present before the onset of stimulation and then triggered by Ca2+ to empty through a flickering pore (Henkel et al., 2000; Staal et al., 2004), a rundown in spike amplitude would be expected as the vesicle's transmitter concentration fell. In this study, the first phase released the majority of NE as a large spike with jagged edges, and then an abrupt diminution in spike amplitude marked the desynchronized phase, but without any obvious trend toward a reduction in amplitude (Fig. 3D,E,H). Release frequency tapered off with time (Figs. 3G, 6A); but when the depolarization was extended beyond 30 ms, the spike frequency returned to desynchronized release events that were much smaller in amplitude than the original synchronous spike (Fig. 1C–E). But what directly addresses the challenging question at hand is the fact that the single events are kinetically much faster than the synchronous burst phase. Single events rose faster than they fell and required only ∼1 ms from start to finish (Figs. 3Ki, 7A). This same amount of time was consumed by the burst phase as it scaled its 10–90% RT. If two kinetic phases were arising from an oversized vesicle that was flickering over several milliseconds, then the flux of transmitter would have to follow the same kinetic profile even though the amplitude/concentration was progressively diminishing (Staal et al., 2004). This is not congruent with what we see; rather, jitter in spike timing broadens the synchronous phase and a distinct prime state leads to the desynchronized events.
Why is multivesicular release used at a BPC ribbon?
Coupling the release of multiple vesicles to an abrupt depolarization will improve the chances of the ribbon signaling to both proximal and distal receptors (Matsui et al., 1998; Midorikawa et al., 2007), which may be needed to engage certain features of the inner plexiform's network (Vigh and von Gersdorff, 2005; Vigh et al., 2011). When considering the nonuniform, anisotropic orientation of a ribbon-docked vesicle with the numerous postsynaptic targets (Marc and Liu, 2000; Sikora et al., 2005) and the variability inherent in unitary events (Fig. 5), single-event singling at this synapse would likely fail to activate a coordinated postsynaptic response.
The foot signal
It is a widely held view that synaptic vesicles open instantly to a high conducting state and give rise to the peak of transmitter in the synapse (Stiles et al., 1996). By contrast, our results suggest that some spikes are preceded by a prespike signal (Fig. 7). This observation is novel in that a SV fusion event has a prespike foot, a characteristic only previously described in larger, granule fusion events. However, other groups have argued that the SV's opening pore is subject to modulation in ways that alter transmitter efflux (Liu et al., 1999; Zhang et al., 2007), and there is evidence that SVs can maintain their pore throughout exocytosis (Pawlu et al., 2004; He et al., 2006), and even enter a “flickering” state that is characterized by the repetitive, opening and closing of the exocytotic pore within a millisecond (Staal et al., 2004).
When release is monitored via the postsynapse, the static, electrotonic structure of the cell and its active conductances can limit the temporal readout and contaminate the single events, respectively (Bekkers and Stevens, 1996; Franks et al., 2003). For instance, a cell with a capacitance of 10 pF and series resistance of 10 MΩ creates a time constant of 100 μs (cutoff frequency ∼ 1.6 kHz; fc = 1/2πτ), which is too slow to resolve the foot signal described here. On the other hand, measurements from the neuromuscular junction have provided the bulk of high temporal resolution single-event data (Del Castillo and Katz, 1954; Stiles et al., 1996).
Stiles et al. (1996) estimated that mEPC measured at the lizard's nmj have RT 20–80% values ∼100 μs, with the fastest events predicted to take only ∼30 μs (Stiles et al., 1996). The large events described in Figure 7 and Table 1 match their fastest miniature RT 20–80% perfectly, and the amperometric events with a foot signal described here have RT 20–80% of 100 μs. The small and large amperometric events have similar kinetic properties, except for the small events slow for just enough time to gain a foot. The amperometric foot is simply interpreted as a “stammer” in the fusion pore's dilation. Because evidence for postfusion modulation of the pore has been described to underlie single event properties measured at the fly nmj that uses glutamate as an NT (Pawlu et al., 2004), and complex fusion events have been described at the DA synapse (Staal et al., 2004), it is not unreasonable to suggest a distinction between the different preparations. In time, the SV fusion pores may be characterized as having stable subconducting states, referred to as stand-alone foot signals in the context of secretory granule fusion events (Albillos et al., 1997; Poberaj et al., 2002; Vardjan et al., 2007).
Assuming that the stammer in pore dilation can lead to trapping or premature closing of the vesicle, such a subconducting state could impact synaptic transmission in numerous ways. For instance, a stand-alone foot may stimulate the fastest activating AMPA or kainate receptors (Li et al., 2003) and render them desensitized before the next spike of transmitter enters the synapse (Trussell and Fischbach, 1989); or as reported previously, the smaller amplitude spikes may selectively activate the highest-affinity NMDA receptors and bypass AMPA/KA receptors (Liu et al., 1999; Choi et al., 2000).
Footnotes
This work was supported by National Eye Institute Grants EY014990 and NRSA EY07115-15. We thank Dr. Fred Sigworth and Victor Pantani for their helpful discussions on signal processing and low noise recordings and the following laboratories in the Department of Cellular and Molecular Physiology for use of their equipment: the late Dr. Steven Hebert's laboratory for loaning the EPC-7 amplifier and vertical electrode puller; Dr. Sigworth for use of the Narashige Microforge; and the late Dr. Marc Pypaert for use of excellent diamond knives.
The authors declare no competing financial interests.
- Correspondence should be addressed to Dr. Chad P. Grabner, Saarland University, Department of Anatomy and Cell Biology, 66421 Homburg, Germany. chadgrabner{at}gmail.com


