

Article Figures & Data
Figures
- Figure 1.
sCRACM reveals a lack of L2/3 inputs to PT-type neurons in the deeper half of L5B vibrissal motor cortex. A, Schematic depicting injection of retrograde tracer into pons to label PT-type neurons, in an animal previously treated with in utero electroporation of ChR2-mVenus into L2/3 pyramidal neurons. B, Schematic of experiment comparing upper and lower L5B neurons. Red dots represent retrogradely labeled PT-type neurons. Green triangles represent ChR2-expressing L2/3 pyramidal neurons. C, D, Fluorescence (C) and brightfield (D) images illustrating selection and patching of a retrogradely labeled PT-type neuron. E, Example sCRACM map superimposed on a brightfield image of a vM1 brain slice. Recordings were made in 1 μm TTX, 100 μm 4-AP, and 5 μm CPP. Responses were measured following an ∼1 mW, 1 ms blue (473 nm) laser flash, with the laser scanned in a grid pattern (50 μm spacing, 12×26). F, Averaged responses from three maps displayed on the grid corresponding to the blue light stimulus location (red triangle, location of the soma). G, Example sCRACM input maps for PT-type neurons in upper L5B (left) and lower L5B (right). H, Input maps for L5B PT-type neurons sorted by cortical depth. Each column represents a single neuron, with its map compressed to a vector by summing across map locations at the same laminar depth, using absolute magnitude of input. The thick white line represents laminar depths of the somata. The vertical white line, demarcating the approximate mid-point of L5B (0.65 mm from the pia), separates upper and lower L5B neurons. I, Scatter plots comparing input between upper and lower L5B neurons. Each point represents a pair of neurons in the same slice (solid circles along the axis represent neuron pairs in which one cell had no detectable input). Input represents the sum of the mean value of all suprathreshold pixels in pA. Dashed line represents equal input. Number of pairs, N = 14 and p value, p < 0.001 (Wilcoxon signed rank test).
- Figure 2.
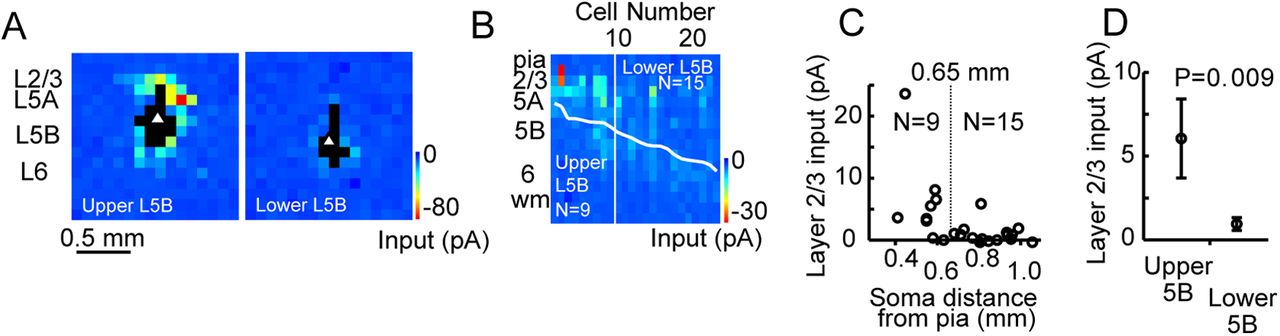
Laser-scanning photostimulation with glutamate uncaging confirms a lack of local-circuit inputs to deep layer PT-type neurons in vibrissal motor cortex. A, Example LSPS input maps for upper (left) and lower (right) L5B corticopontine (PT-type) neurons. Pixels indicate mean synaptic current; black pixels indicate direct responses. Triangles indicate somata. Pia is at the top; midline is to the right. Stimulus grid: 16 × 16; 100 μm spacing. B, Input maps for pyramidal neurons were averaged over rows and ordered according to depth. White line indicates soma depth. Laminar depth noted at left. C, L2/3 input summed for each neuron and presented as a function of cortical depth. L5B neurons were divided into upper (blue) and lower (red) categories based on distance from pia (0.40–0.65 mm upper and 0.65–1.1 mm lower). D, Comparison of average input for lower and upper L5B neurons (p = 0.009, rank sum test).
- Figure 3.
Anatomical identification of long-range projections to motor cortex. A, Schematic of experimental design. Fluorescent retrograde tracers were stereotactically injected into mouse vM1. Relative location of five major ipsilateral cortical and thalamic afferent inputs to vM1 are shown, with deep structures indicated by dashed lines. B–D, Fluorescence images (left) of retrograde bead labeling in 100 μm coronal sections (M2 and OC, B) and thalamus (C–D). Position along rostrocaudal axis is indicated relative to bregma. Dashed line indicates approximate position of white matter. Abbreviations and schematics after Paxinos and Franklin (2004). D3V, Dorsal third ventricle; ic, internal capsule; Re, reuniens thalamic nucleus; Rt, reticular thalamic nucleus; VM, ventromedial thalamic nucleus; VPL, ventral posterolateral thalamic nucleus; VPM, ventral posteromedial thalamic nucleus. E–I, Assessment of presynaptic laminar origin of corticocortical inputs to vM1. Retrogradely labeled neurons in each presynaptic region are shown, with arrowhead indicating laminae with densest label in contralateral vM1 (E), ipsilateral M2 and OC (F), contralateral M2 and OC (G), ipsilateral retrosplenial agranular cortex (RSA, H), and ipsilateral vS1 and S2 (I). Arrow indicates border of vS1 (left) and S2 (right). Dashed line indicates approximate position of white matter. Scale bar, 0.5 mm in all panels.
- Figure 4.
Comparing input strength from a single pathway across layers using sCRACM. A–D, Illustration showing how inputs to neurons in different cortical layers were compared. A, Multiple pyramidal neurons were recorded in the same neocortical column and filled with biocytin. B, Mean current during 75 ms poststimulus is represented as a heat map with the same scale (at right) for four cells from the same slice in (from left to right) L2/3, L5A, L5B, and L6. Neuronal somata indicated by triangles. C, Each column represents a single neuron, with the input map of B reduced to a vector by summing input across map locations at the same laminar depth. The white line overlaid represents laminar depth of the cell body. Red pixels represent locations of maximum input. The absolute plot (left) uses the sum of the measured currents and plots all neurons on the same scale. The normalized plot (right) scales the vector for each neuron from 0 (blue, minimum input) to 1 (red, maximum input) to show location of input in the arbor. D, Illustration of input strength comparison. The sum of all suprathreshold pixels in a map is compared for neurons recorded in different layers of the same slice. Sum of input is given in pA and plotted on a logarithmic plot. Dashed line represents unity. L5A is used to compare with other layers for posterior thalamus, as it was the layer with strongest average inputs.
- Figure 5.
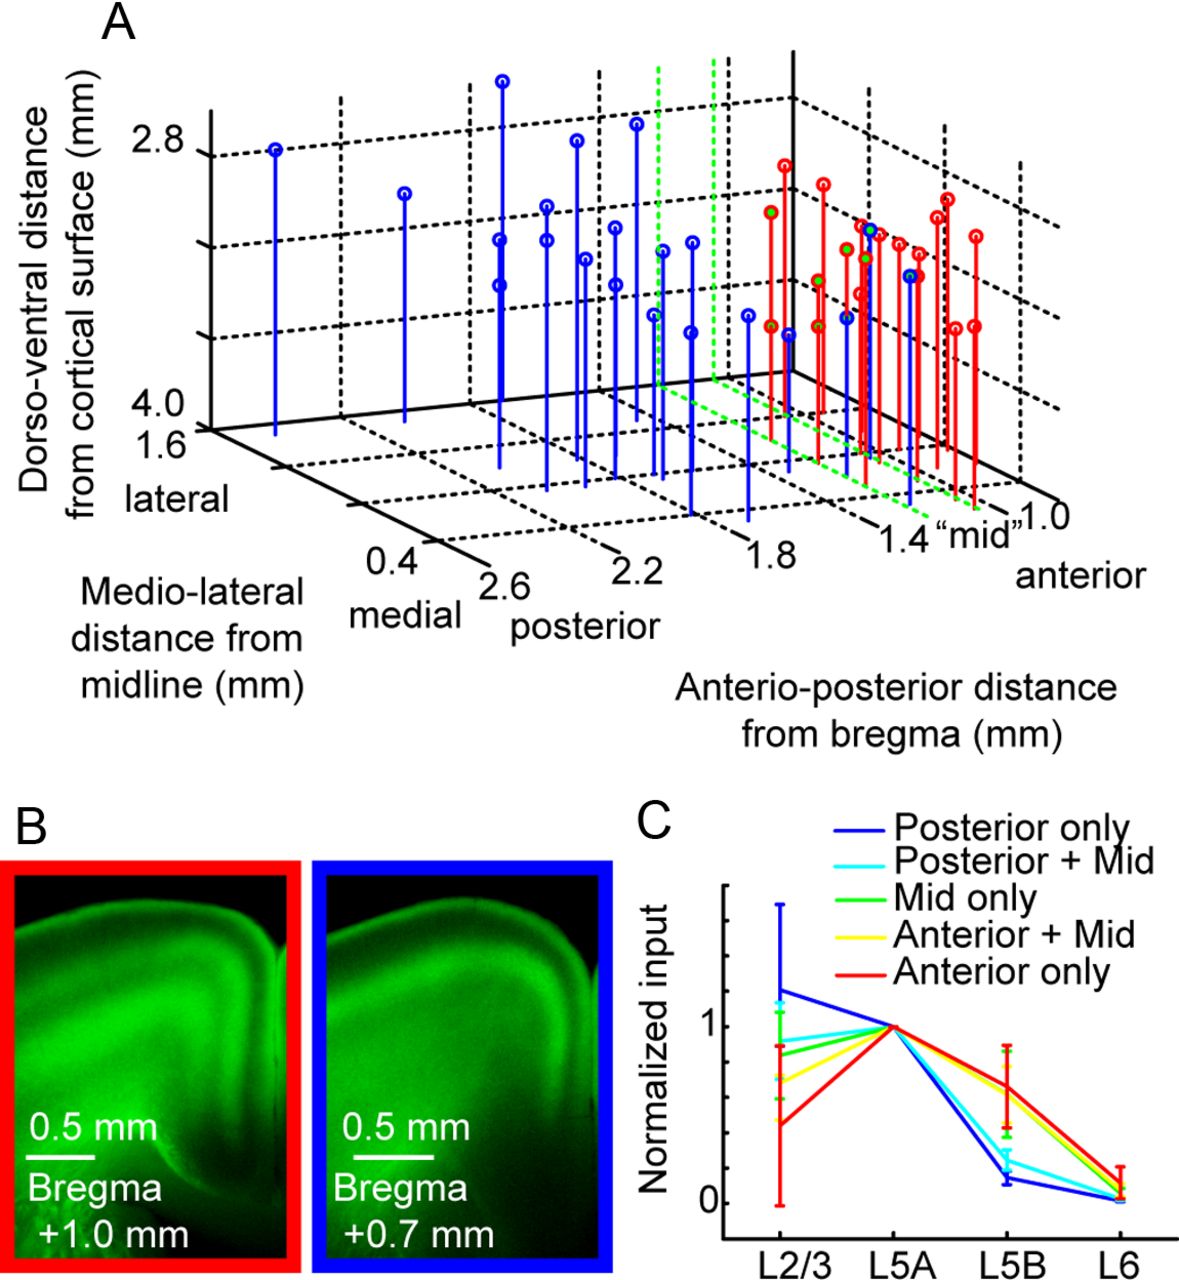
Analysis of motor cortex input from thalamus, grouped by injection site location. A, Thalamic injection coordinates were estimated based on sections containing strong AAV expression and dye coinjection with virus. Coordinates (in mm) are given in depth from the surface of cortex, distance from the midline, and anterior/posterior position relative to bregma (Paxinos and Franklin, 2004). Motor thalamus (red) and sensory thalamus (blue) overlapped in a region (∼1–1.2 mm posterior to bregma), designated as “mid” (green). B, Example images of axon pattern in cortex from anterior (left) and posterior (right) injections. This pattern was used to categorize injections into sensory and motor thalamic categories. C, Geometric means of the intensity ratio, normalized to the layer receiving the strongest input (L5A). The overlaid graph shows the mean ratio and SD (bootstrap, see Materials and Methods). In posterior injections (blue), L5B input was low, but L5B input strength increased in data groupings including mid (green) and anterior injection sites (red).
- Figure 6.
Inputs to vM1 from sensory thalamus. A, AAV injection site in posterior thalamus, after Paxinos and Franklin (2004). B, Fluorescence image of a coronal vM1 section (thickness, 300 μm) showing axonal fluorescence. Dashed lines mark region used for fluorescence quantification. C, Quantification of fluorescence as a function of laminar depth. Cortical depth is shown in fractional coordinates (pia, 0; white matter, 1); fluorescence was background subtracted and normalized. Dashed lines indicate borders of cortical layers. Note peaks in L1 and L5A, as well as the plateau near white matter. D, Comparison of input strength across neurons in different cortical layers. Each point represents input to a pair of neurons in the same slice (solid circles, neuron pairs in which one cell had no detectable input). Dashed line represents unity. N, Number of pairs; p value, Wilcoxon signed rank test. E, Geometric means of the amplitude ratio, normalized to the layer receiving the strongest input (L5A). The overlaid graph shows the mean ratio and SD (bootstrap). F, Left, input maps for pyramidal neurons grouped by layer. Each column represents a single neuron, with its map compressed to a vector by summing across map locations at the same laminar depth. Thick white line, Laminar depth of the cell body. Vertical white lines, Boundaries separating layers. Color map adjusted to saturate top 0.5% of pixels. Right, Same neurons presented with input for each cell normalized its maximum input. G, Description of input location for pyramidal neurons for all four layers. Normalized mean input maps for each pyramidal neuron layer were averaged into a vector and aligned to the soma. These were then plotted as an input vector (left) and a graph (right), showing the input as a function of laminar depth relative to the soma in 50 μm bins. Triangles and dashed lines indicate soma depth. Only the strongest recipient layers (L2/3 and L5A) are plotted at right. Note points above the pia are plotted as zero.
- Figure 7.
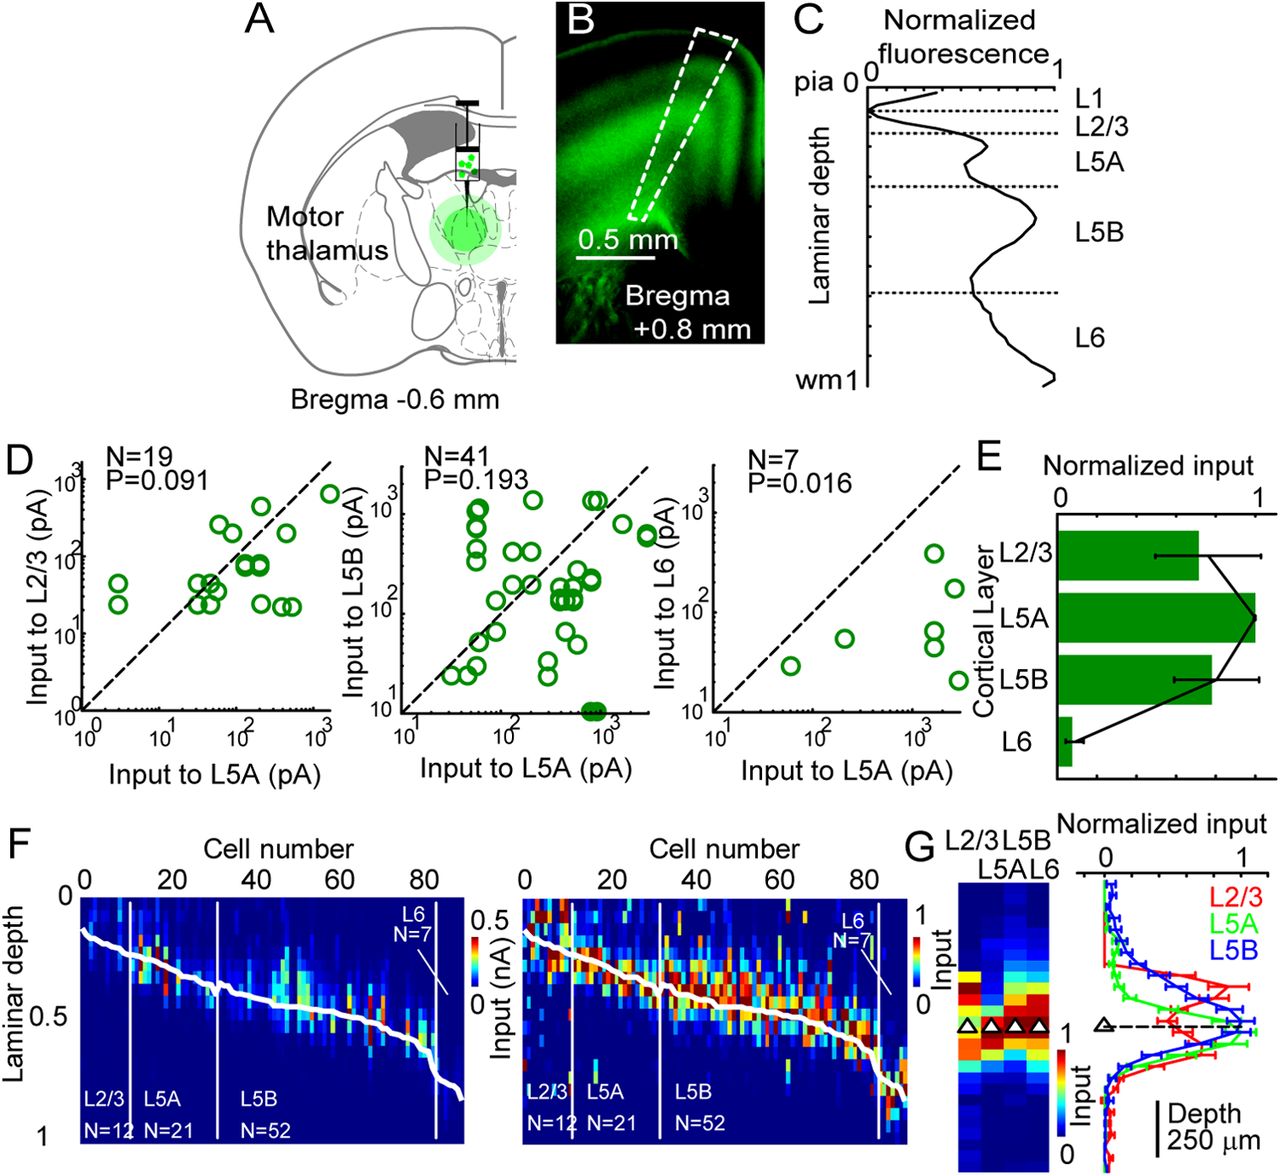
Inputs to vM1 from motor thalamus. A, AAV injection site in anterior thalamus, after Paxinos and Franklin (2004). B, Fluorescence image of a coronal vM1 section (thickness, 300 μm) showing axonal fluorescence. Dashed lines mark region used for fluorescence quantification. C, Quantification of fluorescence as a function of laminar depth. Cortical depth is shown in fractional coordinates (pia, 0; white matter, 1); fluorescence was background subtracted and normalized. Dashed lines indicate borders of cortical layers. Note peaks in L1, L5A, and L5B, as well as a peak near white matter. D, Comparison of input strength across neurons in different cortical layers. Each point represents input to a pair of neurons in the same slice (solid circles, neuron pairs in which one cell had no detectable input). Dashed line represents unity. N, Number of pairs; p value, Wilcoxon signed rank test. E, Geometric means of the amplitude ratio, normalized to the layer receiving the strongest input (L5A). The overlaid graph shows the mean ratio and SD (bootstrap). F, Left, input maps for pyramidal neurons grouped by layer. Each column represents a single neuron, with its map compressed to a vector by summing across map locations at the same laminar depth. Thick white line, Laminar depth of the cell body. Vertical white lines, Boundaries separating layers. Color map adjusted to saturate top 0.5% of pixels. Right, Same neurons presented with input for each cell normalized its maximum input. G, Description of input location for pyramidal neurons for all four layers. Normalized mean input maps for each pyramidal neuron layer were averaged into a vector and aligned to the soma. These were then plotted as an input vector (left) and a graph (right), showing the input as a function of laminar depth relative to the soma in 50 μm bins. Triangles and dashed lines indicate soma depth. Only the strongest recipient layers (L2/3, L5A, and L5B) are plotted at right. Note points above the pia are plotted as zero.
- Figure 8.
Input from motor thalamus to subtypes of L5B neurons in vM1. A, Schematic illustrating injection of ChR2-expressing AAV (green) into anterior thalamus and retrograde tracer (red) into pontine nuclei to label PT-type neurons. B, Comparison of input strength between retrogradely labeled PT-type pyramidal neurons and their unlabeled neighbors. Each point represents input to a pair of neurons in the same slice (solid circles, neuron pairs in which one cell had no detectable input). Dashed line represents unity. N, Number of pairs; p value, Wilcoxon signed rank test. Differences not significant. C, Schematic of experiment comparing upper and lower neurons in L5B to explore sublaminar differences. L5B neurons recorded in the same slice were divided into upper (laminar depth 0.35–0.51) and lower (laminar depth 0.52–0.67) groups and input compared as before. Green arrows represent motor thalamic input to each class. D, Comparison of input strength between upper and lower L5B neurons. Each point represents input to a pair of neurons in the same slice. Dashed line represents unity. N, Number of pairs; p value, Wilcoxon signed rank test. Differences not significant.
- Figure 9.
Frontal cortex (M2) excites the output layers of vM1. A–G, Quantification of inputs to vM1 from M2. A, AAV injection site in M2, after Paxinos and Franklin (2004). B, Fluorescence image of a coronal vM1 section (thickness, 300 μm) showing axonal fluorescence. Dashed lines mark region used for fluorescence quantification. C, Quantification of fluorescence as a function of laminar depth. Cortical depth is shown in fractional coordinates (pia, 0; white matter, 1); fluorescence was background subtracted and normalized. Dashed lines indicate borders of cortical layers. Note a single peak in deep layers (L5B and L6). D, Comparison of input strength across neurons in different cortical layers. Each point represents input to a pair of neurons in the same slice. Dashed line represents unity. N, Number of pairs; p value, Wilcoxon signed rank test. E, Geometric means of the amplitude ratio, normalized to the layer receiving the strongest input (L5B). The overlaid graph shows the mean ratio and SD (bootstrap). F, Left, Input maps for pyramidal neurons grouped by layer. Each column represents a single neuron, with its map compressed to a vector by summing across map locations at the same laminar depth. Thick white line, Laminar depth of the cell body. Vertical white lines, Boundaries separating layers. Color map adjusted to saturate top 0.5% of pixels. Right, Same neurons presented with input for each cell normalized its maximum input. G, Description of input location for pyramidal neurons for all four layers. Normalized mean input maps for each pyramidal neuron layer were averaged into a vector and aligned to the soma. These were then plotted as an input vector (left) and a graph (right), showing the input as a function of laminar depth relative to the soma in 50 μm bins. Triangles and dashed lines indicate soma depth. Note points above the pia are plotted as zero.
- Figure 10.
Input from M2 to subtypes of L5B neurons in vM1. A, Schematic illustrating injection of ChR2-expressing AAV (green) into M2 and retrograde label (red) into pontine nuclei to label PT-type neurons. B, Comparison of input strength between retrogradely labeled PT-type pyramidal neurons and their unlabeled neighbors. Each point represents input to a pair of neurons in the same slice. Dashed line represents unity. N, Number of pairs; p value, Wilcoxon signed rank test. Differences not significant. C, Schematic of experiment comparing upper and lower neurons in L5B to explore sublaminar differences. L5B neurons recorded in the same slice were divided into upper (laminar depth 0.35–0.51) and lower (laminar depth 0.52–0.67) groups and input compared as before. Blue arrows represent differences in M2 input to each class. D, Comparison of input strength between upper and lower L5B neurons. Each point represents input to a pair of neurons in the same slice. Dashed line represents unity. N, Number of pairs; p value, Wilcoxon signed rank test. Lower L5B neurons received more input (p = 0.019).
- Figure 11.
Analysis of vM1 and M2 long-range projections. A–F, Coinjection of AAV-EGFP and retrograde tracer in vM1 or M2 in adult mice. After >2 weeks of expression, animals were sectioned in 100 μm coronal sections and imaged with a fluorescence microscope (AxioImager). Prefixes “i”, “m”, and “c” designate ipsilateral, medial, and contralateral, respectively. A–C, vM1 injection shows reciprocal connections with M2, OC (A), contralateral vM1 (B), and thalamus (C). D–F, M2 injection also reveals reciprocal connections with vM1 (E), OC, contralateral M2 (E), and thalamus with a medial shift relative to vM1 projections (F). G, Quantification of the total fluorescence of from vM1 injections (sum of pixels) across targets in the cortex, basal ganglia, and thalamus for N = 2 animals. Thalamic nuclei are grouped into ipsilateral (iTha), contralateral (cTha), and midline (mTha; for unpaired nuclei) thalamic nuclei. Prefixes “i”, “m”, and “c” designate ipsilateral, medial, and contralateral, respectively. Ect, Ectorhinal cortex; Str, striatum; ZI, zona incerta. H, Output density for vM1 injections, where fluorescence is divided by area and divided by output density to vS1 for normalization. I, J, Quantification of total fluorescence and output density for M2 injections (N = 2 animals) in a similar fashion. vM1 is used for normalization in J.
- Figure 12.
OC excites L6 neurons in vM1. A, AAV injection site in OC, after Paxinos and Franklin (2004). B, Fluorescence image of a coronal vM1 section (thickness, 300 μm) showing axonal fluorescence. Dashed lines mark region used for fluorescence quantification. C, Quantification of fluorescence as a function of laminar depth. Cortical depth is shown in fractional coordinates (pia, 0; white matter, 1); fluorescence was background subtracted and normalized. Dashed lines indicate borders of cortical layers. Note peaks in L2/3 and near the L5B/L6 border. D, Comparison of input strength across neurons in different cortical layers. Each point represents input to a pair of neurons in the same slice. Dashed line represents unity. N, number of pairs; p value, Wilcoxon signed rank test. E, Geometric means of the amplitude ratio, normalized to the layer receiving the strongest input (L6). The overlaid graph shows the mean ratio and SD (bootstrap). F, Left, input maps for pyramidal neurons grouped by layer. Each column represents a single neuron, with its map compressed to a vector by summing across map locations at the same laminar depth. Thick white line, Laminar depth of the cell body. Vertical white lines, Boundaries separating layers. Color map adjusted to saturate top 0.5% of pixels. Right, Same neurons presented with input for each cell normalized its maximum input. G, Description of input location for pyramidal neurons for all four layers. Normalized mean input maps for each pyramidal neuron layer were averaged into a vector and aligned to the soma. These were then plotted as an input vector (left) and a graph (right), showing the input as a function of laminar depth relative to the soma in 50 μm bins. Triangles and dashed lines indicate soma depth. Note points above the pia are plotted as zero.
- Figure 13.
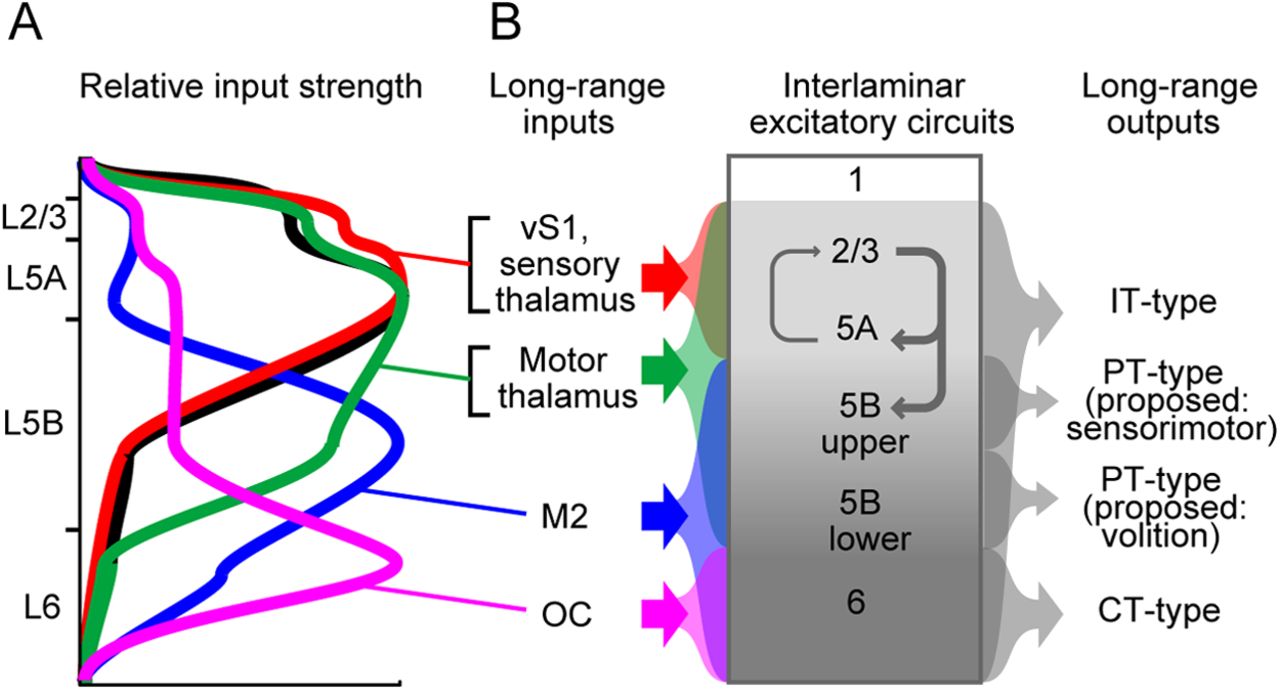
Circuit diagram for lamina-specific long-range excitation to primary motor cortex. A, Schematic showing the relative input strength from each pathway to layers in vM1, based on ratios measured in Figures 6, 7, 9, and 12. Profile of vS1 input (black) (Mao et al., 2011) is included for comparison. B, A circuit diagram for excitatory inputs to primary motor cortex. Left, Laminar specificity of long-range excitatory input is shown for all pathways described. Input from vS1 to vM1 is included with sensory thalamus. Center, Interlaminar excitatory circuits between vM1 pyramidal neurons (gray) are dominated by descending pathways. Right, Long-range outputs of vM1 are shown, with laminar specificity indicated.


Tables
Target A-P M-L D-V Motor thalamus −0.45 0.85 3.25 Sensory thalamus −1.2 1.3 2.75 Frontal cortex (M2) 2.7 0.9 0.8/0.5 Orbital cortex 2.6 1.0 1.7/2.0 vM1 1.05 0.9 0.8/0.5 Pons −4.0 0.75 4.2/4.5 Stereotaxic injections were performed at P12–P16 for sCRACM experiments. Distances are in mm along the anterior/posterior (A-P) axis, relative to bregma, with positive values anterior to bregma; along the medial/lateral (M-L) axis, relative to the midline; and, in dorsal/ventral (D-V) axis, relative to pia. Where two depths are listed, injections were made at both depths.


