
Abstract
Hierarchical predictive coding suggests that attention in humans emerges from increased precision in probabilistic inference, whereas expectation biases attention in favor of contextually anticipated stimuli. We test these notions within auditory perception by independently manipulating top-down expectation and attentional precision alongside bottom-up stimulus predictability. Our findings support an integrative interpretation of commonly observed electrophysiological signatures of neurodynamics, namely mismatch negativity (MMN), P300, and contingent negative variation (CNV), as manifestations along successive levels of predictive complexity. Early first-level processing indexed by the MMN was sensitive to stimulus predictability: here, attentional precision enhanced early responses, but explicit top-down expectation diminished it. This pattern was in contrast to later, second-level processing indexed by the P300: although sensitive to the degree of predictability, responses at this level were contingent on attentional engagement and in fact sharpened by top-down expectation. At the highest level, the drift of the CNV was a fine-grained marker of top-down expectation itself. Source reconstruction of high-density EEG, supported by intracranial recordings, implicated temporal and frontal regions differentially active at early and late levels. The cortical generators of the CNV suggested that it might be involved in facilitating the consolidation of context-salient stimuli into conscious perception. These results provide convergent empirical support to promising recent accounts of attention and expectation in predictive coding.
Introduction
Predictive coding has emerged as a powerful framework for modeling neural information processing (Knill and Pouget, 2004; Friston, 2005; Rao, 2005; Bar, 2009). Cortical circuits implementing Bayesian inference (Bastos et al., 2012) maintain a successively complex hierarchy of generative models of sensory causation (Friston, 2008). Bottom-up prediction errors flowing upward allow adaptive inferences about sensations, in turn producing top-down predictions that propagate downward.
Predictive coding theories have been used to explain the manifestation of the mismatch negativity (MMN) (Näätänen, 1992; Winkler, 2007) and P300 (Donchin and Coles, 1988; Picton, 1992) event-related potentials (ERPs) as prediction error signals (Garrido et al., 2007, 2009; Wacongne et al., 2011; Lieder et al., 2013). Recently, dissociations between these ERPs have lent support to hierarchical prediction in auditory cortex (Wacongne et al., 2011). A temporally constrained, attention-independent first level generates the MMN, labeled as the local effect of short-term stimulus deviance. Prediction error at this level feeds forward to a temporally extended, attention-dependent system that extracts longer-term patterns. Operating at the level of conscious awareness, this system learns to expect the occurrence of local deviants. It attenuates the predicted error at the lower level but fails to predict complex deviations occurring over longer timescales. Residual prediction error at this higher level is indexed by the P300, identified as the global effect of longer-term stimulus deviance.
Here we describe how the neural dynamics at successive levels of hierarchical auditory prediction are modulated by expectation and attention. Within Bayesian inference, attention reflects the acuity of perception and emerges from increased precision in inference (Rao, 2005; Friston, 2009; Feldman and Friston, 2010), and top-down expectation of specific patterns drives the tuning of this precision in favor of contextually salient or anticipated stimuli. We set up a predictive hierarchy by using simple tones that were contextually grouped into sequences to create and then deviate from stimulus patterns at multiple levels of predictive complexity. This design allowed us to vary the amount of bottom-up stimulus deviation alongside manipulations of top-down expectation and attention. Specifically, stimuli deviating in frequency or laterality at local and global levels were presented while attention was engaged on the auditory stream and while it was distracted by a visual task. Top-down expectation was manipulated by altering task instructions while keeping the stimuli unchanged. We measured modulations in ERPs reflecting successive levels of auditory prediction: the MMN at the local level, the P300 at the global level, and the well-known contingent negative variation (CNV) (Walter et al., 1964; Tecce, 1972) at the level of top-down expectation. We reconstructed cortical sources of these ERPs to describe the differentiated effects of attention on temporal and frontal sources, with corroborative evidence from direct intracranial recordings in an epileptic patient. We show that the CNV faithfully reflects subtle changes in expectation, in keeping with a large body of literature about this slow EEG drift. Its cortical generators suggest that the CNV potentiates the specific brain regions involved in the consolidation of contextually salient stimuli into conscious perception.
Materials and Methods
Participants.
Thirty neurologically healthy adults (16 males and 14 females) with normal binaural hearing (mean ± SD age, 27.7 ± 6.7 years) participated in the study, which was approved by the Cambridge Psychology Research Ethics Committee. They gave written informed consent and were paid £10/h for their time. Each participant was tested in one of the three main experimental conditions: (1) attend sequences, (2) attend tones, or (3) interference.
Intracranial patient.
An epileptic patient (right-handed male aged 20 years) implanted with intracranial electrodes was tested in the attend sequences and interference conditions. He suffered from drug-resistant epilepsy since the age of 6 years and was offered surgical intervention to alleviate his intractable condition. Structural computed tomography (CT) and MRI scans were acquired after surgery, and no structural abnormalities were observed in either. The experimental protocol was reviewed and approved by the Institutional Ethics Committee of the Epilepsy Unit at Ramos Mejia Hospital, which follows the guidelines of the Declaration of Helsinki. Written informed consent was obtained before testing. The patient was attentive and cooperative during testing, and his cognitive performance before and during the surgery was indistinguishable from normal volunteers. His current drug treatment included 300 mg/d phenytoin, 400 mg/d lamotrigine, and 2000 mg/d levetiracetam.
Direct cortical recordings were obtained with subdural grid electrodes (with 10 mm interelectrode distance). The patient had a 64-electrode grid (8 rows × 8 columns) covering the entire right prefrontal, central, and pericentral cortices. The inferior limits of this grid covered the superior temporal gyrus, from the temporal pole extending backward to the posterior part of the middle temporal sulcus. The patient also had two 16-electrode strips in an 8 × 2 configuration. One strip extended from the lower part of the temporal–parietal junction (TPJ) to the lower bank, extending back to the occipital pole along the upper line of the most posterior part of temporal lobe. A second strip began immediately above the first one and extended back to the inferior parietal lobule. All electrode sites were selected according to clinical criteria with no reference to the present study. However, the patient was specifically recruited for this study because it was possible to measure from large portions of the parietal, temporal, and prefrontal lobes simultaneously.
Experimental setup.
Participants were seated comfortably in a dimly light room while presented with auditory or simultaneous auditory and visual stimuli, using Psychtoolbox version 3 (Brainard, 1997) running in MATLAB on a Dell laptop. Auditory stimuli were presented using Etymotics ER-3A earphones at a comfortable volume. Visual stimuli were presented centrally (subtending a visual angle of ∼2°) on a dark background with a 21-inch CRT display placed at a distance of ∼70 cm from the participant.
Stimuli.
Each participant was presented with 10 blocks of stimuli, with breaks after every block. Eight of these were experimental blocks, and two were control blocks. Audible tones lasting 50 ms were presented in grouped sequences consisting of five tones spaced 100 ms apart. Individual tones were mixtures of three sinusoids, either type A (500, 1000, and 2000 Hz) or type B (350, 700, and 1400 Hz), identical to those used previously (Bekinschtein et al., 2009). Sequences were either monaural or interaural. In monaural sequences, all five tones were presented to either the left ear or the right ear. Such sequences consisted of either five identical tones (AAAAA or BBBBB) or four identical tones and a final one of the other type (AAAAB or BBBBA). In contrast, in interaural sequences, the final tone was presented in the opposite ear to the previous four. Hence, there were four corresponding interaural sequences, notated as AAAAA, BBBBB, AAAAB, and BBBBA (Fig. 1). Together, these tone sequences could be grouped into those that were local standards, in which the last tone was identical to the previous four (AAAAA and BBBBB), or local deviants, in which the last tone differed in either frequency (AAAAB and BBBBA) or laterality (AAAAA, BBBBB, AAAAB, and BBBBA).

Experimental design. Auditory stimuli consisted of sequences of five tones of type A or B and were presented in experimental blocks of type X or Y. In X blocks, standard sequences (71.5%) were monaural repetitions of the same tone type, interspersed with rare deviant sequences with the fifth tone differing in either type (monaural; 14.25%) or laterality (interaural; 14.25%). Y blocks were similar, except that the standard sequences had a fifth tone differing in type. This effectively created an orthogonal contrast between temporally local versus global deviance in the pattern of tones. Additionally, interaural deviant sequences generated both local and global deviance. These were contrasted with control blocks consisting only of interaural deviant sequences.
Approximately 160 sequences were presented in each block, lasting ∼4 min. The interval between consecutive sequences was randomly sampled from a uniform distribution between 700 and 1000 ms. Each experimental block began with a habituation phase, consisting of a 3 s pause followed by the 20 presentations of a monaural sequence that would occur commonly throughout the rest of the block, termed the global standard sequence. This phase was followed by the test phase, consisting of 138–142 sequences. Of these, 100 (∼71.5%) were the global standard. The remaining were rare, global deviant sequences, which were either monaural or interaural with equal probability. There were 19–21 (∼14.25%) of each kind of deviant sequence in a block, pseudorandomly interspersed among the global standards. Two to five global standards were always presented between one deviant sequence and the next with 80% of deviants preceded by two to three global standards.
Figure 1 illustrates the structure of X and Y block types, which were set up to create a design that allowed for orthogonal local and global contrasts of predictability across the eight experimental blocks: global standard monaural sequences in X blocks were also local standards, whereas global standards in Y blocks were local deviants. This meant that the tone sequence that served as the monaural global standard in an X block was the global deviant in the complementary Y block and vice versa. However, interaural sequences were always locally and globally deviant in experimental blocks.
The dominant tone type (A or B) and laterality (left or right) of monaural sequences within each block was counterbalanced, resulting in the eight experimental blocks listed in Table 1. So for example, in the L-A-X block (Fig. 1, left column; Table 1, first row), the locally standard monaural AAAAA sequence presented to the left ear was also the global standard. Occasional global deviants in this block were also locally deviant, either the monaural AAAAB sequence presented to the left ear or the interaural AAAAB sequence in which the fifth tone was presented to the right ear. In contrast, in the L-A-Y block (Fig. 1, right column; Table 1, third row), the locally deviant monaural AAAAB sequence presented to the left ear was now the global standard. Global deviants in this block were either the locally standard AAAAA sequence presented to the left ear or the locally deviant interaural AAAAA sequence. The eight blocks were presented in pseudorandom order such that the first block was always an X block, and no more than two X or two Y blocks were presented consecutively.
Structure of experimental blocks
Two additional control blocks were presented randomly interspersed among the experimental blocks. These blocks had 160 sequences each and consisted solely of interaural deviant sequences. Interaural deviance was entirely expected in control blocks, and hence the responses here served as a baseline for comparing with those in experimental blocks. Control block X contained 40 repetitions each of sequences of the kind AAAAA and BBBBB, presented first to the left and then the right ear. Control block Y had the same structure but consisted of AAAAB and BBBBA sequences.
Experimental task.
There were three main experimental conditions into which participants were randomly assigned in equal numbers: (1) attend sequences, (2) attend tones, or (3) interference. The first two conditions consisted only of auditory stimulation, and participants were asked to remain comfortably seated and keep their eyes closed throughout the experiment. These two conditions only differed in the instruction given to participants at the beginning of every block. In the attend sequences condition, they were asked to attend to the auditory stimulation and count any rare/uncommon sequences. At the end of each block, they were asked to report this count before continuing the experiment. Hence, in this condition, we expected participants to attend to and extract the global rule that characterized deviant sequences. In the attend tones condition, they were instead asked to attend to the individual tones and count any odd/deviant tones they heard. As a result, participants were expected to focus on the local rule that identified deviant tones.
In the interference condition, the auditory stimulation was identical to the other two conditions, but in addition, participants were asked to perform a demanding visual task intended to divert their attention away from the auditory stimuli. Colored letters (A, E, J, P, or T in red, green, blue, yellow, or magenta) were presented in random order at a rate of approximately one per second, with an on-screen time of 150 ms followed by a 850 ms blank interval. At the beginning of each block, participants were asked to count the number of occurrences of a randomly selected colored letter designated as the target for that block. There were 8–11 targets in each block. At the end of the block, they were asked to report this count before continuing. Onsets of auditory and visual stimuli were mutually random, and hence responses to visual stimuli were averaged out in the ERPs time locked to auditory stimuli.
EEG data collection and preprocessing.
In addition to reporting counts at the end of each block, at the end of the experiment, participants in the attend sequences and attend tones conditions were asked to describe the auditory stimuli they heard. All of them reported hearing monaural and interaural deviants.
During the experiment, 129-channel high-density EEG data in microvolts, sampled at 250 Hz and referenced to the vertex, were collected using the Net Amps 300 amplifier (Electrical Geodesics). Data from 92 channels over the scalp surface were retained for additional analysis, after excluding those on the neck, cheeks, and forehead. The retained continuous data were low-pass filtered at 20 Hz and epoched between −200 and 1300 ms relative to the start of the presentation of each sequence. The epochs generated were baseline corrected relative to the mean activity during the −200 to 0 ms window before the presentation of the fifth tone. An exception was made to this for analyzing the CNV, in which a −200 to 0 ms before presentation of the first tone was used as the baseline to measure linear drift.
Data containing excessive eye movement or muscular artifact were rejected by a quasi-automated procedure: noisy channels and epochs were identified by calculating their normalized variance and then manually rejected or retained by visual confirmation. Rejected channels were interpolated using spherical spline interpolation. A mean ± SD of 14 ± 7% of channels were interpolated and 10 ± 6% of epochs were rejected by this procedure. There were no significant differences between the proportion of channels interpolated or epochs rejected in the three conditions. The retained data were jointly re-referenced to the mastoid electrodes. These processing steps were implemented using custom MATLAB scripts that used EEGLAB functionality (Delorme and Makeig, 2004).
EEG data analyses.
Epochs in the habituation phase of all blocks were excluded from additional analysis. Time windows of interest were compared in pairs of experimental conditions using spatiotemporal clustering analysis implemented in FieldTrip (Oostenveld et al., 2011). For each such pairwise comparison, epochs in each condition were averaged subject-wise. The number of epochs contributing to a subject's pair of ERPs were equalized before averaging, by rejecting a random subset of epochs in the condition with more epochs than the other. These averages were passed to the analysis procedure of FieldTrip, the details of which are described by Maris and Oostenveld (2007). In brief, this procedure compared corresponding spatiotemporal points in the subject-wise averages using one-tailed dependent (for within-subject comparisons) or independent (for across-subject comparisons) samples t tests. Although this step was parametric, FieldTrip used a nonparametric clustering method first introduced by Bullmore et al. (1999) to address the multiple comparisons problem. t values of adjacent spatiotemporal points whose p values were <0.05 were clustered together by summating their t values, and the largest such cluster was retained. A minimum of two neighboring electrodes had to pass this threshold to form a cluster, with neighborhood defined as other electrodes within a 4 cm radius. (There were eight electrodes in the smallest cluster reported in the results). This whole procedure, i.e., calculation of t values at each spatiotemporal point followed by clustering of adjacent t values, was then repeated 1000 times, with recombination and randomized resampling of the subject-wise averages before each repetition. This Monte Carlo method generated a nonparametric estimate of the p value representing the statistical significance of the originally identified cluster. The cluster-level t value was calculated as the sum of the individual t values at the points within the cluster. Interaction effects of attention versus deviant type were tested by running the above analysis on subject-wise ERP differences between responses to the two types of deviants (interaural and monaural).
The above procedure was adapted to compare CNV drifts between pairs of conditions. Slopes of the least-squares linear fit to the −600 to 0 ms window were calculated at each electrode in each subject-wise ERP average. These values were submitted to the statistical analysis of FieldTrip (Maris and Oostenveld, 2007), which now identified spatial (rather than spatiotemporal) clusters of electrodes at which the CNV slopes were significantly different between conditions. An analogous procedure was used to compare the latency of the P300 between a pair of conditions: for each subject-wise P300 ERP, the time point at which 50% of the absolute area under the curve between 200 and 600 ms was reached was calculated (Luck and Hillyard, 1990). These time points were then analyzed with FieldTrip to identify clusters of electrodes in which the 50% area latency was significantly different.
Source reconstruction.
Cortical sources of subject-wise averaged ERPs for conditions of interest were reconstructed with Brainstorm (Tadel et al., 2011). The forward model was calculated using the OpenMEEG Boundary Element Method (Gramfort et al., 2010) on the cortical surface of a template MNI brain (colin27) with a 1 mm resolution. The inverse model was constrained using weighted minimum norm estimation (Baillet et al., 2001) to estimate source activation in picoampere-meters. To plot cortical maps, grand-averaged activation values were normalized by calculating z scores at each time point relative to baseline activity within the −200 to 0 ms window and then spatially smoothed with a 5 mm kernel. Subject-wise activation time courses were extracted at regions of interest (ROIs) visually identified in the cortical maps. Time courses in pairs of conditions were compared to identify statistically significant temporal clusters using a FieldTrip-based analysis similar to that used to test the EEG responses in sensor space (see above) but now at one ROI at a time.
Intracranial data analyses.
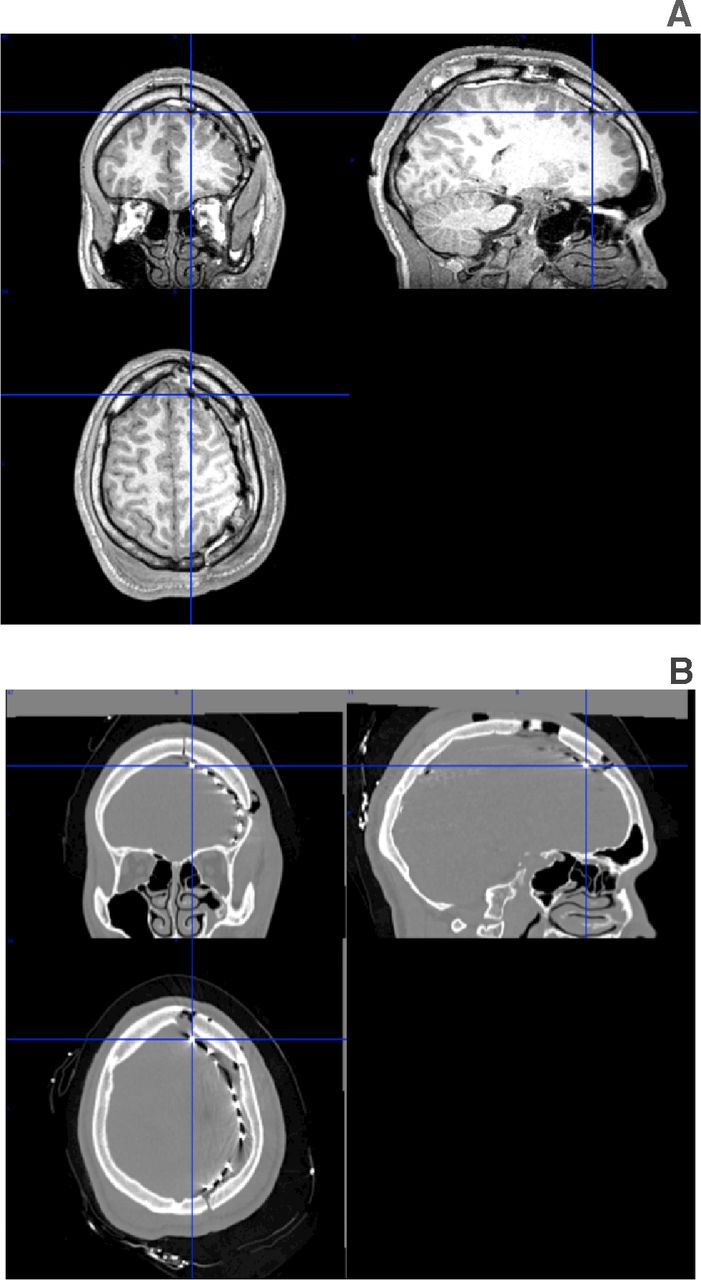
The epileptic patient's CT and MRI scans (Fig. 2) were visualized in MRIcron (Rorden and Brett, 2000) to pinpoint locations of electrodes within temporal and frontal ROIs. They were normalized to MNI space in SPM (Friston et al., 2011) to identify coordinates and anatomical loci (Table 2).

MRI and CT scans of an epileptic patient with intracranial electrodes. A and B depict MRI and CT scans of the epileptic patient after surgery to implant intracranial electrodes. In both panels, the three-dimensional location indicated is that of the electrode at the top right corner of the 8 × 8 grid covering frontal, central, and temporal regions of the right hemisphere.
Coordinates and anatomical loci of ECoG electrodes analyzed
Intracranial local field potentials (LFPs) were recorded at 2000 Hz, with respect to a reference near the right temporal lobe. Continuous data were downsampled to 250 Hz offline and low-pass filtered at 40 Hz. Epochs were extracted between −200 and 1300 ms relative to the start of the presentation of each sequence and baseline corrected during the −200 to 0 ms window before the presentation of the fifth tone. Noisy channels and epochs were rejected by visual inspection.
Individual LFP time courses were statistically compared using a FieldTrip-based clustering analysis similar to that used to test the EEG data (see above). This analysis was run over individual epochs from a pair of conditions after equalizing the number of epochs in each condition. It now identified temporal clusters of contiguous time points in which there were statistical differences in LFP. Interaction effects of attention versus deviance were tested by running the analysis with the epoch-wise LFP differences between responses to the two types of deviants.
Results
In what follows, there are several concepts we will refer to in trying to understand the neurophysiological correlates of perceptual processing observable in our data. We use the predictive coding framework (Friston, 2009; Feldman and Friston, 2010) to operationalize some of these terms. Here, prediction error corresponds to the mismatch between sensory input and top-down predictions about that input. These predictions are based on plausible explanations for current sensory input and are themselves learned and updated on the basis of preceding stimuli. Hence, prediction errors can be modulated in at least two ways. First, they could be greater because of a failure to predict the current stimulus. The predictability of a stimulus is inferred on the basis of repetition of standard stimuli. Hence, locally or globally deviant stimuli are unpredictable at their respective level of predictive complexity. Second, prediction errors can also be enhanced by gain mechanisms representing the predictive precision of a stimulus before it is presented. This can be changed a priori by task instructions that manipulate conditional expectation of an attentional set, so that certain stimuli acquire predictive validity for behavior. In both cases, we presume that the underlying synaptic mechanism corresponds to a gain control that reflects (1) the bottom-up learning of predictability or (2) top-down changes in expectation instantiated through task instructions.
Within this framework, we investigated the degree to which top-down manipulations of expectation interact with bottom-up manipulations of predictability. In the presence of simple (local) and complex (global) deviations from stimulus predictability, expectation was independently modulated by directing attention to global deviations in the attend sequences condition or to local deviations in the attend tones condition. The interference condition served as a control, in which expectation of auditory stimuli was removed by directing attention to a demanding visual task.
The relative complexity of our experimental design was necessitated by the need to fully counterbalance orthogonal local and global contrasts that allowed us to examine modulations of ERP components at successive levels of predictive complexity within one task. The design resulted in a large number of factors: (1) three stimulus-related factors with two levels each and (2) another task-related factor with three levels of attentional engagement. However, we will not exhaustively report all the main effects and potential interactions but will instead focus on the effects of local and global stimulus deviance and their interactions with attention. Hence, the following sections organize our findings along the successive levels of predictive coding in auditory cortex, in each of the three main task conditions: (1) attend sequences, (2) attend tones, and (3) interference. We begin with the stages that contribute to early prediction error indexed by the MMN (measured by the early response to local deviants), followed by the later, higher-order attentional processing responsible for the P300 (defined by the late response to global deviants). Finally, we describe the CNV as an index of top-down expectation per se that influences dynamics at the previous stages.
Level 1: local deviations
Having confirmed the existence of the previously reported local and global effects in our data (Fig. 3), we focused on the responses generated by interaural deviants. In any given experimental block, the auditory stream was dominated by monaural tone sequences presented only to one ear. In this auditory scene, rare monaural deviant sequences ended with a deviation in the same ear, whereas rare interaural deviant sequences ended with the fifth tone in the other ear. Although monaural and interaural deviations were equally rare in experimental blocks, they generated prediction errors of differing intensities and potentially variant cortical distributions. As we now show, this design allowed us to compare how the strength and sources of early prediction error influenced ERP dynamics along the processing hierarchy.

Classic local and global effects with and without attention. In each panel, the top half plots the spatial topography of the cluster at the time point of maximal difference between the pair of conditions. The green dot therein indicates the electrode at which this difference was obtained. The bottom half plots grand- average ERP time courses at this electrode in microvolts. The thick blue horizontal line indicates the temporal extent of the cluster, and the red dashed vertical line indicates the time point at which the topograph above is plotted. This time point is also specified in the title above, along with the Monte Carlo t and p values of the cluster. The vertical black dotted lines indicate the onset of the five tones in each sequence. A depicts the local MMN effect to monaural frequency deviants in the attend sequences condition. B plots the local effect in the interference condition, showing that it survives the absence of auditory attention. C depicts the global P300 effect to rare monaural sequences in the attend sequences condition. D depicts the significant difference between the global effects in the attend sequences and interference conditions, highlighting the fact that, in contrast to the local effect, it is contingent on the availability of auditory attention. This pattern of results replicates previous findings in a related study (Bekinschtein et al., 2009). glo. dev., Global deviations; std., standard.
Figure 4A compares the early MMN response generated by interaural and monaural deviants in the attend sequences condition. The significant spatiotemporal cluster identified within the 100–200 ms MMN time window points to the larger activation generated by the former. The underlying cause of this greater prediction error is the likely result of additional cortical recruitment sensitive to changes in the spatial pattern of the auditory stimuli. Importantly, the stronger MMN probably reflects the integrative processing of patterns across both auditory cortices, to detect laterality shifts at the end of interaural deviant sequences.

Level 1: local deviations (loc. dev.). Panels illustrate statistically significant spatiotemporal ERP clusters obtained in contrasts between pairs of conditions within 100–200 ms. A and C depict the clusters representing the larger MMN elicited by interaural versus monaural local deviance in attend sequences and interference conditions, respectively. D highlights the enhancement of the MMN by attention: a larger combined MMN was obtained in the attend sequences versus interference condition. B highlights the attenuation of the MMN attributable to top-down expectation: a smaller MMN was obtained in the attend tones condition than the attend sequences condition.
We verified that this early differential response to interaural deviants survived the absence of attention by analyzing ERPs from the interference condition, in which attention was diverted by a demanding visual task. Participants in the interference condition counted an average ± SD of 10 ± 1 rare visual targets in each block (8–11 targets were presented; see Materials and Methods), confirming that they were indeed focusing on the visual stream. As Figure 4C shows, even without the benefit of auditory attention, interaural deviants still generated a significantly larger early MMN than monaural deviants. This relative automaticity of the MMN is well known (Näätänen et al., 1982, 1993), and our results confirm that attentional engagement is not necessary for generating the basic MMN. However, attentional diversion did attenuate the response to both kinds of deviants: Figure 4D depicts the significantly smaller combined MMN generated by monoaural and interaural deviants in the interference condition compared with the attend sequences condition. This contrast clearly highlights the role of attentional precision in sharpening, i.e., enhancing early prediction error signals generated in auditory cortex (Friston, 2005; Feldman and Friston, 2010; Kok et al., 2012).
We reconstructed cortical sources from each subject's ERPs to identify regions that might be responsible for the stronger responses to interaural deviants in addition to those modulated by the engagement of visual attention. Figure 5, A and B, plots cortical maps of grand-averaged activation differences between interaural and monaural deviants in the attend sequences condition at the temporal peak of the scalp MMN effect. We observed larger early responses to interaural deviance in the right TPJ and left posterior prefrontal cortex (PFC). Figure 5, C and D, plots the activation time courses at these regions, highlighting differences captured by the statistically significant temporal clusters. It is important to note that this right-lateralized response in the TPJ is independent of the laterality of interaural deviants, which was counterbalanced. Our analysis combined epochs from blocks with interaural sequences ending with a tone in the left ear, as well as those from blocks with sequences ending in the right ear (Table 1).

Local deviations (loc. dev.) in source space. A and B show the smoothed, z-score normalized cortical activation maps at the peak of the interaural MMN effect in the attend sequences condition, highlighting stronger responses in TPJ and PFC, respectively. C and D depict activation time courses in picoampere-meters, highlighting statistically significant temporal clusters at both these ROIs in the attend sequences condition. Corresponding time courses in the interference condition (E, F) show that only the temporal cluster at TPJ survives the lack of attention.
The TPJ in particular has been implicated previously in exogenously triggered attentional orienting (Corbetta et al., 2000; Kincade et al., 2005) to particularly salient stimuli. Figure 5, E and F, plots the activations for the same two regions in the interference condition. We found that interaural deviants still elicited a statistically stronger response in TPJ but not in posterior PFC. Furthermore, we verified that there was indeed an interaction effect (cluster t = 35.26, p = 0.015) between attention (attend sequences vs interference) and type of deviant (interaural vs monaural) in PFC but not in TPJ. This pattern of effects points to a key dissociation between the functional role of the two regions in processing deviants: when auditory attention is engaged (attend sequences), both regions activated preferentially to interaural deviants. However, in its absence (interference), interaural deviants generated stronger (although diminished) responses in the TPJ but failed to initiate discriminative processing in PFC. This dissociation emphasizes the role of frontal areas in generating recurrent feedback to further the propagation of early prediction error, as suggested by MMN models (Garrido et al., 2007, 2009; Boly et al., 2011a) of neuroimaging data (Opitz et al., 2002; Doeller et al., 2003; Tse and Penney, 2008).
Intracranial recordings from an epileptic patient tested in the attend sequences and interference conditions provided an independent test of the dissociations observed in the EEG source reconstruction (for intracranial electrode locations, see Table 2). Figure 6C plots the time course of LFPs elicited at an electrocorticography (ECoG) electrode situated over the right TPJ (Fig. 6A) of an epileptic patient performing the task in attend sequences condition. The location of the TPJ electrode was coincident with the region implicated in the source reconstruction (compare Figs. 5A, 6A) and similarly generated a significantly stronger early response to interaural deviants (compare Figs. 5C, 6C). We could not measure activations over left PFC in the patient because of a lack of cortical coverage. Nevertheless, we did find that electrodes over right dorsolateral PFC (Fig. 6B) generated a statistically larger response to interaural deviance (compare Figs. 6D, 5D). In line with the dissociation observed in the source reconstruction (Fig. 5E,F), in the interference condition (Fig. 6E,F), this differential response remained significant in TPJ but not in PFC. As before, the interaction between attention and type of deviant was significant in PFC (cluster t = 38.54, p = 0.013) but not in TPJ. This pattern of findings provide independent, although partial, corroboration of the cortical dynamics seen in EEG, delineating the role of attention in modulating the prediction error signal in temporal and frontal regions.

Local deviations (loc. dev.) in intracranial recordings. A and B indicate locations of intracranial ECoG electrodes on the patient's cortex at which LFPs were compared. Electrode numbers correspond to their entries in Table 2. Electrodes are colored by the statistical differences elicited by interaural and monaural deviants: no statistical differences were found at yellow electrodes. Only the attend sequences condition was significant at orange electrodes, and both attend sequences and interference conditions were significant at red electrodes. This coloring scheme shows that, although most electrodes over TPJ (A) registered a stronger response to interaural deviants with and without attention, electrodes over PFC (B) only responded when attention was engaged. Time courses and statistical comparisons at the electrodes encircled in green are shown in the panels below. C–E depict significant temporal LFP clusters obtained in contrasts between pairs of conditions within 100–200 ms. C and D depict stronger responses to interaural deviants at electrodes over both TPJ and dorsolateral PFC in the presence of attention. E and F show that this stronger response only survives in TPJ when attention is absent.
Although the attend sequences versus interference conditions contrasted above represented a straightforward manipulation of attention, the attend tones condition generated a more subtle manipulation of top-down expectation (or bias) and consequent attentional focus. More specifically, in the attend sequences condition, participants attended to global, block-level irregularities in tone sequences. In the attend tones condition, although the stimuli were identical and auditory attention was equally engaged, their focus was shifted instead on to local features, i.e., simple deviations in tonal properties. The efficacy of this shift was verified by measuring behavioral responses, i.e., the number of deviations reported at the end of each block. In the attend sequences condition, participants correctly reported the number (∼40) of rare sequences they counted (mean ± SD count, 39 ± 13). In the attend tones condition, they instead reported the number of deviant tones (mean ± SD count, 149 ± 13), which in the Y blocks were significantly higher (∼140) than the number of rare sequences. We hypothesized that the top-down expectation of local rather than global features might in turn modulate early EEG responses to local deviations.
In the attend tones condition, interaural deviants did not generate a significantly larger MMN, in contrast to the attend sequences and interference conditions. Rather, as shown in Figure 4B, the early response to deviants of both kinds in the attend tones condition was significantly reduced compared with attend sequences. In other words, as local rather than global temporal patterns became explicitly expected, prediction error at lower levels of the auditory hierarchy that tracked these local patterns were reduced. This finding is convergent with previous MEG evidence of attenuation of early auditory responses to expected versus unexpected stimuli (Todorovic et al., 2011; Todorovic and de Lange, 2012).
Together, the results here describe the impact of attention and expectancy on the error signal manifesting in early stages of the predictive hierarchy: although attention enhanced the MMN, top-down expectancy bias attenuated it. These findings point to the influence of task-conditional expectation on representations of predictability generated early in auditory processing. In a later section, we will show that the CNV is a direct EEG measure of expectation that can be linked to these early modulations.
Level 2: global deviations
Later stages in the predictive hierarchy integrate information over longer temporal windows and hence track more complex changes in sensory patterns. Information processing at this level is thought to aggregate information from distributed frontoparietal networks (Dehaene et al., 1998; Dehaene and Changeux, 2011), subserving conscious access to the detected patterns and deviations therein. In particular, previous research has shown that the relatively late P300 ERP is a reliable marker of temporally global deviations, requiring attentional engagement and resulting in reportable conscious perception (Bekinschtein et al., 2009).
We examined responses to the different types of global deviations in our data by examining the P300 ERP within the 200–600 ms window. P300s evoked by interaural deviant sequences were larger than monaural deviants, indexing the greater amount of cortical activation generated by the rare shifts in laterality of tones. This is shown in Figure 7A, depicting the spatiotemporal cluster encompassing the significantly more positive and earlier P300 generated by interaural deviants in the attend sequences condition. It is worth noting here that, as both monaural and interaural deviant sequences were equally rare in any given experimental block, this larger interaural global effect cannot be explained by differences in stimulus probabilities that are well known to affect the P300 (Johnson, 1986). Furthermore, the same interaural deviant sequences, when presented in separate control blocks consisting of only interaural deviants, did not generate this late effect. This is evident in Figure 7B, which highlights the fact that no P300 was elicited when interaural deviance was entirely expected. Finally, we confirmed that the interaural global effect was also strongly contingent on attentional allocation, i.e., in the interference condition, interaural deviant sequences did not generate a larger P300; in fact, no P300 was apparent for either type of deviant. This is evident in Figure 7 when comparing c with a, and we confirmed that there was a statistically significant interaction in the P300 time window (cluster t = 10,761.75, p = 0.002) between attention (attend sequences vs interference) and type of deviant (interaural vs monaural). This difference emphasized the contrast between prediction error propagation at the local and global levels: although the early effect of interaural deviance (Fig. 4C) survived the absence of attention, the late effect did not.

Level 2: global deviations (glo. dev.). A and E depict the cluster representing the larger P300 within 200–600 ms elicited by interaural versus monaural global deviance in attend sequences and attend tones conditions. B depicts the cluster comparing the response to interaural deviants (dev.) in experimental versus control blocks in the attend sequences condition. C highlights the lack of a significant P300 to interaural or monaural global deviance in the interference condition. D (top) shows the spatially smoothed, z-score normalized cortical map of sources active at the time point of maximal difference between the P300s in A, and D (bottom) plots the activation time course at the prominent frontal source. F (top) plots the topography and significant spatial cluster of 50% area latency differences between P300s elicited by deviants in the attend sequences versus attend tones conditions. F (bottom) plots of grand-averaged ERPs at the electrode at which this difference was maximal, indicated by the green dot in the topograph. Colored regions in F indicate 50% of the area under the P300 between 200 and 600 ms. ctrl., Control.
In source space, regions at the pole of the right frontal cortex (FC) were activated by the heightened P300 for interaural deviants. Figure 7D (top) highlights these areas on the cortical map at the peak of grand-averaged activation differences between interaural and monaural sequences in the attend sequences condition. The complete activation trace in anterior FC for the conditions of interest is shown in Figure 7D (bottom). The pattern there emphasizes the exclusively late-stage response of the region to interaural and monaural deviants in the attend sequences condition. Furthermore, we confirmed that this region was driving the scalp ERP differences: subject-wise activations in anterior FC were significantly higher for interaural deviants than monaural deviants (cluster t = 55.45, p = 0.037). However, we could not verify this pattern with intracranial recordings, because the patient's cortical grid did not cover the anterior frontal sources identified by the EEG source reconstruction.
The stronger late response to interaural deviants also manifested in the attend tones condition (Fig. 7E). There were no significant differences between the amplitudes of the P300 ERPs in the attend tones versus attend sequences conditions. Interestingly, however, there was a small but significant difference between the temporal latency and duration of the P300. This difference is apparent in Figure 7 when comparing A with E and was significant in a 50% area latency analysis. More specifically, we compared the P300 ERPs in the two conditions by performing a spatial cluster analysis of the latency at which 50% of the area under the P300 curve within 200–600 ms was reached (Luck and Hillyard, 1990) for each participant (see Materials and Methods). The resulting parietal cluster of electrodes in which this latency was significantly earlier in the attend tones condition, along with the ERP time course at the maximal electrode within the cluster, are shown in Figure 7F. This late divergence in attention-dependent responses between the two conditions reflects the main impact of the manipulation: although the actual stimuli were identical in the two conditions, the precision of the attentional bias was not. In the attend sequences condition, long-range temporal focus on global patterns resulted in increased attentional precision relatively late in the predictive hierarchy. This in turn generated more protracted P300s, likely to be indexing the integration of more complex predictive contexts. In contrast, in the attend tones condition, the short-term interest in local tonal features resulted in shorter, sharper P300 responses. This suggests that the requisite predictive information available earlier in the processing hierarchy benefited more from attentional precision. It is worth noting that the comparative sharpening of the P300 in the attend tones condition is in contrast to the dampening of the MMN highlighted in the previous section (Fig. 4B).
Together, the findings in this section have described the modulation of the P300 by attention and expectation. Prediction error generated in early stages of auditory processing is sensitive to the amount of bottom-up stimulus predictability but relatively insensitive to attention. However, the upward propagation of this error and resulting late-stage dynamics are much more contingent not only on attentional precision but also on top-down expectation. From the perspective of predictive coding theories, this precision weights (i.e., amplifies) the error to support hierarchical inference (Feldman and Friston, 2010). The stimulus probabilities relevant to the task at hand dictate the buildup of top-down expectation and its consequent effect on the context updating reflected in the P300. As we will show in the next section, this buildup is closely tracked by the drift rate of the CNV. This baseline increase in activity indexed by the CNV ensures that the error signal feeding forward to later stages of the hierarchy is significantly amplified, manifesting as the larger P300 to interaural deviants.
Level 3: expectation
The previous two sections have described the impact of changes in top-down attention and expectation on early and late stages of hierarchical prediction. In this section, we highlight a direct EEG measure of expectation in our data: the CNV, a slow baseline drift in the EEG that has been linked previously to the buildup of expectation (Walter et al., 1964; Tecce, 1972; Rockstroh et al., 1982; Macar and Besson, 1985; Bickel et al., 2012). Figure 8A depicts the negative drift in the EEG during the presentation of global standard sequences in the attend sequences and interference conditions. As can be seen, beginning with the first tone in a sequence in the former condition, this drift persists until the processing of the final tone reveals the sequence as a global standard. We quantified this effect by comparing the linear slope within the −600 to 0 ms window (see Materials and Methods), i.e., only including the CNV drift during the presentation of the first four tones in each sequence. The spatial cluster (Fig. 8A, top) encompasses the electrodes at which this drift (Fig. 8A, bottom) is significantly more negative at frontocentral electrodes in the attend sequences condition. In other words, during the presentation of the first four tones within a sequence, there is a non-zero local CNV drift in the attend sequences condition, in sharp contrast to the interference condition. Thus, the presence of a CNV can be strongly linked to the engagement of auditory attention, corroborating previous evidence in this regard (Walter et al., 1964; Weinberg, 1972).

Level 3: top-down expectation. A describes the local CNV drift within the −600 to 0 ms window across all global standard sequences in the attend sequences versus interference conditions. B describes the global increase in CNV drift rate from early to late global standard sequences within the attend sequences condition. In both panels, the top half plots the topography and significant cluster of electrodes at which CNV drift was significantly different. The bottom half depicts the ERP time course at the electrode at which this difference was maximal, indicated by the green dot in the topograph. Colored dashed lines therein show the linear fits to the corresponding ERP time courses. C describes the local CNV drift across all global standard (glo. std.) sequences in the attend tones versus interference conditions. D highlights the lack of an increase in CNV drift rate from early to late global standard sequences in the attend tones condition. E shows the spatially smoothed z-score normalized cortical map of sources activated during the presentation of global standards in the attend sequences condition. F plots activations at the prominent frontal source for early and late global standards in attend sequences and attend tones conditions, along with linear fits to each time course.
Delving deeper, we also found that the rate of CNV drift itself progressively increased with successive presentations of global standards, until a global deviant sequence was presented. To demonstrate this effect, Figure 8B plots the CNV for early and late global standard sequences presented in the attend sequences condition. These were defined with respect to the time since the last global deviant preceding them: early global standards occur immediately after a global deviant and late ones just before the next global deviant. As is evident from the figure, the rate of drift is greater after a number of global standards have been presented. A significant difference between the slopes of early and late global standards manifested primarily in frontal electrodes. This anticipatory increase in the drift rate can be seen as a global CNV effect: it tracks the progressive increase in probabilistic expectation of temporally uncertain global deviants across successive global standards. In other words, it indexes higher-order prediction of global deviants themselves across an entire block of sequences. This buildup of top-down expectation drives attentional precision to ensure the propagation of prediction error to the level of conscious access.
Figure 8C depicts the CNV drift in the attend tones condition, depicting the frontal cluster of electrodes in which this drift was significantly stronger than in the interference condition. Hence, there was a qualitatively equivalent local CNV drift in the attend sequences and attend tones conditions (Fig. 6, compare A with C). However, in sharp contrast to the attend sequences condition, there was no significant progressive increase in the drift rate in the attend tones condition when comparing early and late global standards. This can be seen in Figure 8 when comparing B with D and was confirmed by a significant interaction (cluster t = −34.96, p = 0.03) between attention (attend sequences vs attend tones) and type of global standard (early vs late). In other words, there was no global increase in this drift across sequences presented in the attend tones condition.
Although the CNV itself has long been subject to detailed investigation, researchers have attempted to isolate the physiological origins of such a baseline shift in anticipatory neural excitability (Elbert et al., 1994; Rosahl and Knight, 1995; Hamano et al., 1997; Bares and Rektor, 2001; Gómez et al., 2001, 2003; Nagai et al., 2004). These studies have reported activation in a wide range of cortical and subcortical areas, including temporal, frontal, and cingulate cortices, and supplementary motor areas. We reconstructed cortical sources to identify brain regions involved in generating the CNV drifts in our task. Figure 8E plots the grand-averaged activation map highlighting the regions in the anterior FC that showed the strongest baseline drift in activity in the attend sequences condition. Figure 8F depicts the time course of this drift, which closely mirrors the pattern in the scalp EEG data (Fig. 8A,B). In the attend sequences condition, the rate of increase in FC activity itself increases from one sequence to the next, resulting in the prominent difference in CNV drift rate between early and late global standards. We confirmed that this difference was statistically significant across subject-wise activations (t = 2.28, p = 0.019). This is in contrast to the attend tones condition, in which both early and late global standards elicit equal drift rates in the same region (Fig. 8F). Indeed, as with the scalp EEG above, CNV drift in FC showed a significant interaction (t = 2.03, p = 0.03) between attention (attend sequences vs attend tones) and type of global standard (early vs late). This pattern of effects clearly implicates anterior FC as a potential cortical driver of the global and local CNV effects.
It is worth noting that we mainly obtained differences in frontal areas in the source reconstruction of the CNV drift. The absence of a motoric component in our experimental task might explain the lack of activation in motor areas often found with the conventional S1 (warning tone) − S2 (imperative tone) task used to elicit the CNV (Walter et al., 1964). Alluding to potential reasons for these variations, Gómez et al. (2001)) suggested that the CNV might reflect the facilitatory priming of the specific neural circuits that are going to be involved in subsequent processing of a task-salient stimulus. This is indeed the case in our data: the same frontal areas generating the CNV also responded strongly to the late-stage context updating triggered by global deviants (Fig. 7D) that are in fact presaged by the global CNV effect.
These results described here sit well with the interpretation of the drift rate of the CNV as a dynamic and accurate index of the amount of conditional top-down expectation. In the attend sequences condition, prediction of global deviant sequences resulted in the global CNV effect, progressively ramping up with successive presentations of global standards. In the attend tones condition, only a local CNV drift was registered, because participants were expecting and predicting only local stimulus changes. This difference highlights a subtle but important distinction in how expectation and attention affect the CNV in different ways: although attention is required to generate the basic (local) CNV drift, the presence of explicit top-down expectation engenders the (global) increase in the rate of this drift.
Discussion
In summary, our findings have described the influence of attention and expectancy on the error signal manifesting at successive stages of the predictive hierarchy. Early first-level processing indexed by the MMN was sensitive to the amount of prediction error: here, attentional precision enhanced early responses to violations of predictability, but explicit top-down expectation diminished it. This pattern was in contrast to later, second-level processing indexed by the P300: although sensitive to the strength of the error signal, responses at this level were contingent on attentional engagement and were in fact sharpened by top-down expectation. At the highest level, the drift of the CNV was a fine-grained marker of top-down expectation itself, closely indexing the prediction of both local and global patterns. Each of these ERP components has been subjected to detailed empirical investigation over the past decades. By testing current notions about attention and expectancy from predictive coding on these ERPs, we contribute to the synthesis of the ERP literature with a general theoretical framework.
Our empirical investigations in the context of hierarchical predictive coding theory might also have implications beyond the theoretical domain. Indeed, based on formal modeling of MMN responses from patients with disorders of consciousness (DoC; including vegetative and minimally conscious states), researchers have attempted to isolate the deficits in predictive information flow that might underlie these states of profound cognitive and neurological dysfunction (Boly et al., 2011a). Although the methodological challenges inherent in this work have been the subject of debate (Boly et al., 2011b; King et al., 2011), foundational advances could eventually be valuable in the clinical setting because they could help us understand the link between the presence of the MMN/P300 and covert residual awareness in some patients (Fischer et al., 2004, 2010; Daltrozzo et al., 2007). Indeed, as we suggested previously (Chennu and Bekinschtein, 2012), effective early intervention could benefit from improved understanding of the cognitive architecture subserving the generation of these responses.
It is worth noting that variants of the experimental design we used here have been used successfully previously for measuring level of consciousness in cohort studies with DoC patients (Bekinschtein et al., 2009; Faugeras et al., 2012). These studies have reported a specific linkage between the presence of a P300-driven global effect and presence/recovery of consciousness. In particular, Faugeras et al. (2012)) also showed that the presence of the local CNV effect described here was another key predictor of the global effect in patients. Knowledge of how bottom-up predictive error and top-down expectation modulate these ERPs and their cortical generators could further efforts to improve the efficacy of future tests used with patients.
Conclusions
Hierarchical predictive coding has received considerable attention lately as an overarching framework by which the brain learns from and then anticipates sensory input. Here we have shown how the well-known MMN, P300, and CNV ERP components can be construed along a hierarchy that predicts progressively complex bottom-up input of varying strength in the presence of changes in top-down expectation and attention. Source reconstruction of ERPs implicated key regions in temporal and frontal areas that contributed differentially to successive levels along the hierarchy, which was validated using direct measurements from intracranial recordings. This endeavor has allowed us to suggest an integrative interpretation of these ERP components within the context of hierarchical prediction. In doing so, we connect the large body of empirical ERP literature with current theoretical developments in predictive coding.
Footnotes
- Received January 8, 2013.
- Revision received March 12, 2013.
- Accepted March 18, 2013.
This research was supported by Wellcome Trust Biomedical Research Fellowship WT093811MA, the James S. McDonnell Foundation, Medical Research Council Grant U.1055.01.002.00001.01, Argentinian National Research Council for Science and Technology, Chilean National Fund for Scientific and Technological Development Grant 1130920, and the Canada Excellence Research Chairs program. We thank Amber Simler and Corinne Bareham for assisting with data collection, and Prof. Howard Bowman for contributing valuable discussions and insights.
The authors declare no competing financial interests.
- Correspondence should be addressed to Srivas Chennu, Herchel Smith Building, Forvie Site, Robinson Way, Cambridge CB2 0SZ, UK. sc672{at}cam.ac.uk
- Copyright © 2013 the authors 0270-6474/13/3311194-12$15.00/0