

Abstract
Cortical activity is determined by the balance between excitation and inhibition. To examine how shifts in brain activity affect this balance, we recorded spontaneous excitatory and inhibitory synaptic inputs into layer 4 neurons from rat somatosensory cortex while altering the depth of anesthesia. The rate of excitatory and inhibitory events was reduced by ∼50% when anesthesia was deepened. However, whereas both the amplitude and width of inhibitory synaptic events profoundly increased under deep anesthesia, those of excitatory events were unaffected. These effects were found using three different types of anesthetics, suggesting that they are caused by the network state and not by local specific action of the anesthetics. To test our hypothesis that the size of inhibitory events increased because of the decreased rate of synaptic activity under deep anesthesia, we blocked cortical excitation and replayed the slow and fast patterns of inhibitory inputs using intracortical electrical stimulation. Evoked inhibition was larger under low-frequency stimulation, and, importantly, this change occurred regardless of the depth of anesthesia. Hence, shifts in the balance between excitation and inhibition across distinct states of cortical activity can be explained by the rate of inhibitory inputs combined with their short-term plasticity properties, regardless of the actual global brain activity.
Introduction
Cortical excitatory and inhibitory neurons are massively interconnected, forming a network of feedforward and feedback circuits. Because of this massive interconnection, inhibitory cells should modulate the activity of excitatory cells and vice versa (van Vreeswijk and Sompolinsky, 1996; Litvak et al., 2003; Bereshpolova et al., 2011). Cortical excitation and inhibition are synchronized during spontaneous activity (Okun and Lampl, 2008) and comodulated in response to changes in stimulus properties (Wehr and Zador, 2003; Priebe and Ferster, 2006). The relationships between excitation and inhibition may be involved in various physiological functions, including increasing the stability of cortical activity, preventing runaway excitation (Tsodyks et al., 1997; Troyer et al., 1998) and improving the dynamic range of input representation (Liu et al., 2011). However, the ratio between cortical excitation and inhibition (E/I balance) is not constant. For example, stimulus intensity or shape can affect the E/I balance (Heiss et al., 2008; Isaacson and Scanziani, 2011), and E/I balance can change over a short timescale as a result of adaptation, depending on stimulation history and rate (Heiss et al., 2008).
Shifts in brain states, such as between sleep and awake states as well as across different depths of anesthesia, are accompanied by variations in electroencephalography (EEG) activity, local field potential (LFP), and firing rate of cortical neurons (Peña et al., 1999; Poulet and Petersen, 2008; Bereshpolova et al., 2011). In addition, these shifts are accompanied by changes in the subthreshold membrane potential (Vm) activity (Hromádka et al., 2008; Gentet et al., 2010; Okun et al., 2010). Because cortical firing rate is modulated across patterns of EEG activity, short-term synaptic plasticity may alter cortical E/I balance. However, because excitatory and inhibitory synaptic connections can be facilitated or depressed (Beierlein et al., 2003; Markram et al., 2004; Gabernet et al., 2005), it remains unknown how the relationships between excitatory and inhibitory inputs of cortical cells are modulated across distinct brain activities.
In this study, we used whole-cell patch recordings to examine how shifts between slow and fast EEG activity, induced by altering the depth of anesthesia, affect the rate and magnitude of spontaneous excitation and inhibition of intracellularly recorded layer 4 neurons of the barrel cortex. Although the magnitude of inhibition increased under deep anesthesia, the magnitude of excitation remained unaffected. We hypothesized that the increased amplitude of inhibition at the deeper state of anesthesia results from a reduced firing rate of inhibitory cells, allowing the inhibitory synapses to recover from synaptic depression. Indeed, using electrical stimulation, we found a greater depression of inhibitory inputs at higher stimulation frequency, regardless of the depth of anesthesia. Our results suggest that, during spontaneous cortical activity, the E/I balance is determined mainly by the short-term synaptic plasticity of inhibitory inputs.
Materials and Methods
Subjects and surgery.
Wistar rats (4–8 weeks old; n = 27 of either sex) were anesthetized and ventilated (Katz et al., 2006). Layer 4 whole-cell and cortical EEG recordings were made in lightly or deeply halothane-anesthetized rats or together with propofol or ketamine at a very low concentration of halothane, as described below.
A light level of anesthesia was induced by a low concentration of halothane (0.25%). A deep level of anesthesia was obtained by a high concentration of halothane (1.25%), propofol (50 mg/kg, i.p), or ketamine (50–100 mg/kg, i.p). The latter two anesthetics were applied together with the low concentration of halothane. An additional group was examined under low (25 mg/kg, i.p) and high concentrations of ketamine. In this group, no halothane was used throughout surgery and anesthesia was maintained using ketamine alone. The short t1/2 of halothane allowed switching back and forth between deep and light anesthesia, whereas propofol and ketamine were used only unidirectionally to increase the depth of anesthesia. Changes in cortical state were quantified by the ratio between the square roots of the power in the beta and delta bands of the surface EEG recorded at the ipsilateral hemisphere (Rampil, 1998; Jameson and Sloan, 2006). The measurements were performed only after >10 min elapsed since the most recent change in the level of administered anesthetics.
Electrophysiological methods.
Whole-cell patch-clamp recordings and EEG recordings were performed in current-clamp mode, as described previously (Katz et al., 2006, 2012; Okun et al., 2010). Intracellular signals were acquired using an Multiclamp-700B amplifier (Molecular Devices) and low passed at 4 kHz before being digitized at 10 kHz. Borosilicate micropipettes were pulled to produce electrodes with a resistance of 4–10 MΩ when filled with an intracellular solution containing the following: 136 mm K-gluconate, 10 mm KCl, 5 mm NaCl, 10 mm HEPES, 1 mm MgATP, 0.3 mm NaGTP, 10 mm phosphocreatine (310 mOsm), and 1 mm QX-314 to prevent the cells from action potential discharge. The Vm of each cell was recorded under zero current, hyperpolarization, and depolarization currents [mean current level of 0.4 ± 0.15 nA (depolarization) and 0.2 ± 0.09 nA (hyperpolarization), 1 s each, repeated 120–1200 times in a random order]. Currents were adjusted to hyperpolarize the cells to −80 mV or to depolarize them until clear inhibitory synaptic potentials were observed. The amount of current was kept fixed throughout the recordings from each cell. Loose-patch recordings were made with patch recording pipettes filled with standard patch solution without QX-314 in current-clamp mode without application of pipette pressure.
Cell identification.
Layer 4 inhibitory interneurons were identified using well-established extracellular recording methods. Specifically, spikes were of high frequency and <0.6 ms duration (including both negative and positive components; see Fig. 4A, inset; Barthó et al., 2004; González-Burgos et al., 2005; Bereshpolova et al., 2011).
Intracortical stimulation.
For electrical stimulation [ISO-Flex; A.M.P.I. Instruments; stimulus duration of 0.1 ms; intertrial interval of 1 s; tungsten electrode, 100 kΩ (A-M Systems); stimulation amplitude, 10–100 μA], the electrode was positioned at a depth of 1150–1200 μm below the pia (just below the recording site). The exact amplitude of stimulation was adjusted to generate spikes in ∼50% of the stimuli, recorded in a cell-attached mode.
Pharmacological blocking of excitation.
To examine the magnitude of inhibition evoked by a train of electrical stimuli, AMPA receptors were blocked by surface application of 6,7-dinitroquinoxaline-2,3-dione (DNQX) mixed with ACSF (1 mm; Tocris Bioscience). The blocker was applied >30 min before the intracellular recording session and only when we found that ongoing LFP activity completely disappeared. Excitation blockage was tested by examining the response to electrical stimulation while recording the Vm of layer 4 cells at resting Vm or slightly hyperpolarized. The amplitude of the electrical stimulation was determined before applying the blocker as described above.
Data and statistical analyses.
The recordings were analyzed using custom software written in MATLAB R2011A (MathWorks). Vm analysis started 100 ms after the onset of the current injection steps, after the membrane capacitance was fully charged. Synaptic events were detected using previously used methods (Okun and Lampl, 2008).
All comparisons were made using a Wilcoxon's signed-rank test and Friedman's test. Importantly, our choice to perform the experiments in anesthetized animals allowed us to use a within-cell comparison.
Results
To study how shifts in spontaneous cortical activity affect the magnitude of excitatory and inhibitory inputs into cortical cells, we obtained whole-cell current-clamp recordings in layer 4 of the barrel cortex in halothane anesthetized rats (n = 18; recording depth, 800–1150 μm below the pia). Recording sessions started when animals were either deeply or lightly anesthetized. The depth of anesthesia was determined based on the power spectrum of the EEG, which under light and deep anesthesia matched stages III-1/III-2 and stages III–IV and V of anesthesia, respectively (Friedberg et al., 1999). Our analysis (data not shown) indicates that EEG activity gradually changed over the first 4–7 min after alteration of the depth of anesthesia. In each cell, Vm was recorded at three holding current levels (each 1 s long), namely, hyperpolarization, zero-current, and depolarization delivered in a pseudorandom order (Fig. 1). We adjusted the currents to hyperpolarize the cells to approximately −80 mV or depolarize them to −40 to −30 mV, to reveal clear excitatory and inhibitory synaptic potentials, respectively. To prevent action potential discharge, QX-314 was added to the pipette (Heiss et al., 2008). Surface EEG recordings served to evaluate the pattern of cortical activity (Katz et al., 2012). After recording spontaneous activity using the above protocol, the depth of anesthesia was altered (see Materials and Methods), and a “wait-after” period of >10 min was allowed before the protocol was repeated in the same cell under the new level of anesthesia (i.e., light or deep anesthesia, depending on the initial level).

Measurement of EPSPs and IPSPs in a whole-cell recorded layer 4 neuron at two states of halothane anesthesia. A, Top, EEG activity and its power spectrum (inset) under light and deep states of anesthesia. Bottom, The corresponding spontaneous Vm activity while the cell was injected with a random sequence of positive, zero, and negative 1 s current pulses. B, C, Example traces recorded under hyperpolarization (B) and depolarization (C) under light (red) and deep (blue) levels of anesthesia (the first 100 ms after stepping the currents were removed from each trace).
Previous studies reported changes in the rate of postsynaptic potentials (PSPs) between sleep/awake states and for different levels of anesthesia (Mahon et al., 2001; Steriade et al., 2001; Castro-Alamancos, 2004). To detect aggregated PSPs or “bumps” (DeWeese and Zador, 2006), we used similar methods as reported in previous intracellular recording studies in both anesthetized (Okun and Lampl, 2008) and awake (Okun et al., 2010) animals. Increased depth of anesthesia was accompanied by a significant increase in the EEG power at the low-frequency bands (Fig. 1A, inset). Decreased PSP rates were observed in all the recorded cells under deeper anesthesia (Figs. 1B,C, 2A) for EPSPs (recorded when cells were hyperpolarized; from 12.5 ± 0.6 to 7.9 ± 0.4 Hz, p = 0.003), zero-current activity (zPSPs; from 12.6 ± 0.75 to 7.2 ± 0.7 Hz, p = 0.007), and IPSPs (recorded when cells were depolarized; from 13.2 ± 0.9 to 7.3 ± 0.5 Hz, p = 0.002). Inspection of individual trials (Fig. 1B,C) suggests that, in addition to a reduced event rate, the amplitude of individual IPSPs, but not of the EPSPs, was larger in the deeper state of anesthesia.
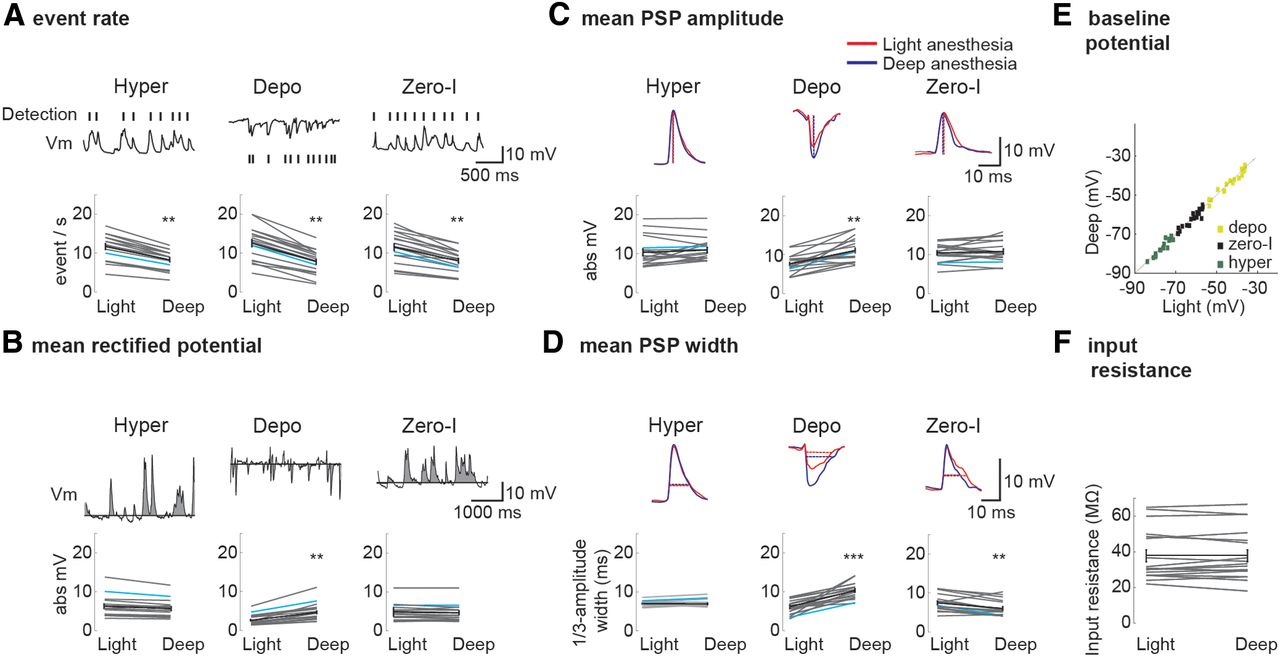
Comparison of EPSP, IPSP, and zPSP parameters under deep and light halothane anesthesia. A, Mean rate of EPSPs (recorded under hyperpolarization; Hyper), IPSPs (recorded under depolarization; Depo), and zPSPs (recorded under zero-current activity; Zero-I). A reduced rate for the three types was observed under deep anesthesia. Here and in the following panels, the population average (n = 18) is presented in black, and the blue line indicates the presented cell. B, MRP for the three recording conditions. An increase in MRP (calculated over epochs of 60 s) under deep anesthesia was observed exclusively for the depolarized condition. C, Analysis of the peak amplitudes of the mean PSPs shows no significant change in EPSP and zPSP but a significant increase in IPSP amplitude under deep anesthesia. D, There was no change in EPSP width and an increased IPSP width under deep anesthesia. zPSP width (when measured at ⅓ of the peak amplitude) was significantly reduced under deep anesthesia. E, F, The resting Vm (between the PSPs) and input resistance were not affected by the depth of anesthesia (n = 18 cells). Error bars in A–D represent SEM. **p < 0.01, ***p < 0.001.
To evaluate changes in mean excitatory and inhibitory activity over a long period, regardless of the rate and shape of the individual PSPs, we calculated the mean rectified potential (MRP). The MRP is the area above the median Vm normalized by time (Fig. 2B; when inhibitory inputs were revealed using positive injected currents, the absolute value of the negatively deviating potential was calculated). Note that the median potential closely matched the Vm in the absence of any synaptic events. We found no significant changes in the MRP for hyperpolarizing (3.3 ± 1.7%, p = 0.4; Fig. 2B) and zero-current (6.4 ± 5.1%, p = 0.07) conditions across levels of anesthesia. However, the MRP during depolarization was 60% higher (60.8 ± 2.3%, p = 0.003) under deeper anesthesia, indicating stronger overall inhibition.
We then quantified the effects of anesthesia level on the magnitude of the EPSP and IPSP bumps observed in individual trials (Fig. 1B,C). We measured the magnitude of PSPs using three complementary methods. First, detected events were averaged together (“event-triggered average”) and the peak amplitude of the average PSP was measured (Fig. 2C). Similarly to the MRP analysis reported above, this analysis showed no significant change in the mean magnitude of the EPSPs or zPSPs but a significant increase in the size of the mean IPSP under deeper anesthesia (by 24.6 ± 2.1%, p < 0.01). In addition to this method, we divided the MRP by the number of detected PSP events for each holding current and at each level of anesthesia. This analysis (data not shown) indicated no change under hyperpolarized and zero-current conditions (7.7 ± 3.1%, p = 0.15 and 9.1 ± 2.8%, p = 0.094, respectively). However, the mean inhibitory MRP/event was significantly larger under deep anesthesia (42 ± 2.2%, p < 0.001). This measurement ignores the exact shape and distribution of the bumps and provides one way to estimate their mean potential. In the third analysis, we measured and averaged the potential of all individually detected events (Okun and Lampl, 2008). This analysis (data not shown) indicated no change in the average mean potential of EPSPs and zPSPs (5.1 ± 3.3%, p = 0.21 and 7.1 ± 4.2%, p = 0.09, respectively) and increased amplitude of IPSPs for the deep anesthesia (52.0 ± 3.5%, p < 0.001). Although the three analysis methods are not fully independent and share the event detection component, together with the MRP analysis, our findings strongly indicate that in layer 4 the magnitude of inhibition changes across levels of anesthesia with no evident effect on the magnitude of excitation.
We have shown previously that, during spontaneous activity, inhibitory inputs lag behind excitation (Okun and Lampl, 2008), thereby limiting the temporal window for input integration (Gabernet et al., 2005). Thus, we hypothesized that, when no current is injected (i.e., at resting Vm) under the deeper level of anesthesia, increased inhibition would result in a narrower zPSPs. Measurements of PSP width at the resting potential indeed supported this conjecture (Fig. 2D). At the deeper level of anesthesia, the width of the zPSPs was narrower (by 32 ± 6.6%, p = 0.01), whereas the IPSPs were wider (by 44 ± 4.7%, p < 0.001). These changes were not accompanied by a change in the width of the EPSPs (2.1 ± 1.1%, p = 0.1). Hence, although we did not examine directly the synchrony between these inputs, we speculate that, at the deeper level of anesthesia, the stronger and wider inhibitory inputs narrowed the width of the zPSPs. In addition, that our recordings confirmed the predicted narrowing in the width of the zPSP is a strong validation of our estimated changes in inhibition and excitation across different levels of anesthesia using current-clamp measurements.
A priori, the increase in IPSP size could also reflect a prominent change in the intrinsic properties of the cells across levels of anesthesia. To examine this possibility, we compared the median Vm between PSPs for the three holding currents across the two levels of anesthesia. Plotting these potentials for deep versus light anesthesia levels (Fig. 2E) showed no significant change in the resting potential (median ± SE, Vm_light = −60.29 ± 1.34, Vm_deep = −61.56 ± 1.26), depolarized (Vm_light = −36.37 ± 1.27, Vm_deep = −37.67 ± 1.33), or hyperpolarized (Vm_light = −76.07 ± 1.25, Vm_deep = −77.03 ± 2.11) voltages in the absence of synaptic activity (Phyperpolarization = 0.21, Pdepolarization = 0.71, and Pzero-current = 0.39) across levels of anesthesia (comparisons were made within cells, and the median Vm calculated for each current level was considered to reflect the Vm in the absence of synaptic inputs). Furthermore, these values were used to calculate the input resistance of the cells, which was not affected across levels of anesthesia (p = 0.89; Fig. 2F), indicating that the changes in synaptic properties across levels of anesthesia were not attributable to changes in resting potential or input resistance.
Effects on inhibition are stable across anesthetic agents
It was postulated recently that the effects of anesthetic agents on cortical activity are indirectly mediated by projecting loci, upstream to the cortex, such as the thalamus or even the brainstem (Franks and Zecharia, 2011). If the effects of anesthesia occur upstream, then our findings should not depend on the mechanism of action of the anesthetic agent. However, other works have suggested prominent local effects of anesthesia on cortical neurons (Antkowiak, 2002).
To test how the excitatory and inhibitory dynamics depend on anesthesia level with different anesthetic agents, we repeated the experiment described in the previous section using the NMDA receptor antagonist ketamine and the GABAA agonist propofol (n = 6 for each anesthetic agent; Müller et al., 2011). Specifically, activity was first tested under deep and light halothane anesthesia, then we reduced the concentration of halothane to a low level (<0.25%, >10 min), ketamine or propofol was injected, and the protocol was repeated after we observed clear signs in the EEG activity of deep anesthesia (>10 min). Analysis of the synaptic dynamics in the deeply anesthetized ketamine-injected rats showed results that were very similar to those observed using halothane (Fig. 3A). More specifically, the PSP rate decreased under the deeper ketamine-induced anesthesia (on average, from 10.6 ± 3.1 to 6.4 ± 1.7 Hz, p < 0.05, for all three holding potentials; Fig. 3B). When PSP size was calculated (Fig. 3C), we found that, although there were no changes in the size of EPSPs (4.9 ± 2.1%, p = 0.28) and zPSPs (7.1 ± 1.4%, p = 0.41), the size of IPSPs was significantly larger under deeper ketamine-induced anesthesia (27.3 ± 3.8%, p = 0.02). Analysis of integrated MRP divided by the number of PSP events (data not shown) indicates no significant changes in the excitatory MRP/event and zero-current MRP/event (8.2 ± 4.6%, p = 0.10 and 7.1 ± 1.9%, p = 0.22, respectively) but a significant increase in the inhibitory MRP/event for the deeper state (46.5 ± 1.5%, p < 0.01). Averaged peak values of individual excitatory, inhibitory, and resting PSPs showed no change for EPSPs and zPSPs (10.3 ± 7.4%, p = 0.13 and 6.4 ± 1.2%, p = 0.08, respectively) but an increased average mean for IPSPs in the deeper state (43.8 ± 2.2%, p = 0.013). No significant change in the resting (Vm_light = −59.06 ± 1.25, Vm_deep = −60.79 ± 1.07), depolarized (median Vm_light = −36.14 ± 1.69, Vm_deep = −35.98 ± 1.19), or hyperpolarized (median Vm_light = −75.79 ± 1.14, Vm_deep = −76.24 ± 0.97) Vm, or in the input resistance were found across levels of anesthesia (Phyperpolarization = 0.55, Pdepolarization = 0. 83, and Pzero-current = 0.29 and p = 0.8, respectively; Fig. 3D). Hence, as with halothane, ketamine had no effect on the resting potential and input resistance of the cells. Analysis of the results in the propofol-injected rats showed changes in synaptic dynamics similar to those with halothane and ketamine across levels of anesthesia (Fig. 3E–H; statistics not shown). Finally, to exclude the possibility that residual halothane interacted with the other anesthetics, E/I balance was also tested when rats were anesthetized only with ketamine, when animals were not subjected to halothane at all (n = 3). Similar to the results reported above, the synaptic dynamics in lightly versus deeply ketamine-anesthetized rats showed increased inhibition and no change in the magnitude of excitation (Fig. 3A, inset).

Comparison of spontaneous EPSP and IPSP parameters when anesthesia level was increased by ketamine or propofol. A, E, The mean EPSPs (recorded under hyperpolarization; Hyper), IPSPs (recorded under depolarization; Depo), and zPSPs (recorded under zero-current activity; Zero-I) under deep and light levels of halothane anesthesia and >10 min after injection of ketamine or propofol to convert light halothane anesthesia to deep ketamine or propofol anesthesia. Similar dynamics in the size of the mean PSP were found in a rats in which no halothane was used and light and deep levels of ketamine anesthesia were compared (inset). B, F, Mean rate of EPSPs, IPSPs, and zPSPs was lower under deep compared with light anesthesia (n = 6 for each anesthetic agent). The population average is presented in black. C, G, Peak amplitudes of the mean EPSP, IPSP, and zPSP shows that only the IPSPs increased after ketamine or propofol injection. D, H, Resting Vm potential and input resistance were not affected by ketamine or propofol injections (n = 6 for each anesthetic agent). Error bars represent SEM. *p < 0.05, **p < 0.01.
In summary, despite their different mechanisms of action, the effects of the three anesthetic agents on excitatory and inhibitory dynamics are very similar. They reduce the rate of synaptic events, increase the amplitude of inhibitory inputs, and do not affect the size of the excitatory inputs. All these effects occur without significant changes in the membrane input resistance and resting potential (Fig. 3D,H).
Increased rate of cortical activity reduces the amplitude of inhibition
We speculated that the reduction in the magnitude of inhibition under light anesthesia is mainly attributable to short-term synaptic depression. Accordingly, because of the high firing rate of inhibitory cells and the relatively slow recovery from synaptic depression of these synapses, the inhibitory inputs are highly susceptible to modulation in the firing rate.
We first examined the relationship between the firing rate of cortical cells and the depth of anesthesia. To this end, cell-attached recording of layer 4 cells (76 putative excitatory cells and 17 putative inhibitory cells; see Materials and Methods) were made across two levels of halothane anesthesia (Fig. 4A). Putative inhibitory cells were characterized by their narrow spike width (<0.6 ms; Fig. 4A, inset) (Barthó et al., 2004; González-Burgos et al., 2005; Bereshpolova et al., 2011). Increased mean spiking rate was found under the lighter level of anesthesia for the analyzed putative excitatory neurons (n = 15, by 79 ± 2.31% from 1.78 to 3.2 spike/s; p < 0.001) and for the putative inhibitory neurons (n = 17, by 120 ± 1.8% from 5.1 to 11.63 spike/s; p < 0.001). The high similarity between the firing rate of putative inhibitory cells and the rate of inhibitory synaptic events (11.6 and 13.2 Hz, respectively) strongly suggests that almost the same population of inhibitory afferent axons were recruited for each inhibitory event. In contrast, that the firing rate of excitatory cells is much lower than the rate of excitatory events (3.2 and 12.5 Hz, respectively) strongly indicates that synaptic excitatory inputs are shuffled, such that successive events are generated by different sets of presynaptic afferents.

Firing rate of cortical cells is modulated by the depth of anesthesia and the recovery of spontaneous synaptic activity after repetitive intracortical stimulation. A, Loose cell-attached recordings of putative inhibitory (left) and excitatory (right) cells of layer 4 under two levels of halothane anesthesia and the corresponding EEG activity. Cells were classified based on spike shape (inset) and width (negative plus positive components). Increased spiking rate was observed in both cell populations under light anesthesia, but only the rate of the inhibitory cells matched the rate of subthreshold inhibitory events (Fig. 2A). B, The recovery of spontaneous synaptic activity after repetitive intracortical electrical stimulation. Intracellular recordings of spontaneous inhibitory (top) and excitatory (bottom) activity from a layer 4 cell (left) and after a brief electrical stimulation. The rate and amplitude of inhibition (top) and excitation (bottom) were measured during a 1 s window, starting after baseline potential was stabilized (dashed line). C, Although the rate and amplitude of spontaneous inhibitory events were significantly suppressed after repetitive intracortical stimulation (top), excitation was not significantly suppressed (bottom, n = 3 cells). Error bars represent SEM. *p < 0.05, **p < 0.01, ***p < 0.001.
Our next step was to examine the recovery of spontaneous excitatory and inhibitory activity of layer 4 cells after 50 Hz intracortical electrical stimulation in a nearby site (Fig. 4B, cells, n = 4; see Materials and Methods). In contrast to the rapid recovery of the rate (spontaneous, 4.1 ± 0.22 Hz and after stimulation, 3.4 ± 0.5 Hz, p = 0.34) and amplitude (spontaneous, 5.6 ± 1.12 mV and after stimulation, 5.1 ± 1.16 mV, p = 0.23, means of detected events) of spontaneous EPSPs recorded during hyperpolarized currents, both the rate and amplitude of spontaneous inhibitory activity (recorded when positive current was injected) were depressed for almost 1 s after stimulation (spontaneous, 3.98 ± 0.3 Hz and after stimulation, 2.01 ± 0.62 Hz, p = 0.03; spontaneous, 4.36 ± 0.14 mV and after stimulation, 1.87 ± 0.19 mV, p = 0.01). These results suggest that inhibitory synapses recover from synaptic depression much more slowly than excitatory synapses. When compared with excitation, this property together with the higher rate of inhibitory firing and thus the small shuffling between these events can explain the higher sensitivity of spontaneous inhibition to synaptic depression across different depths of anesthesia.
That spontaneous inhibitory events slowly recovered from repetitive electrical stimulation suggests that a partial overlap exists between the subset of the inhibitory synapses that are active during spontaneous activity and by those evoked by the intracortical electrical stimulation. Thus, we were able to examine the effect of different rates of local electrical stimulation on the size of evoked IPSPs and in addition to dissociate this effect from that of the actual depth of anesthesia. To this end, we blocked cortical excitatory transmission with DNQX while patching layer 4 cells (n = 6; see Materials and Methods). As expected, under these conditions, no spontaneous PSPs were observed at resting Vm. Nearby intracortical electrical stimulation was used to replay the pattern of inhibitory events recorded from other cells under deep and light levels of anesthesia, while depolarizing the cells to unveil electrically evoked inhibitory synaptic potentials (Fig. 5A). These traces show that the magnitude of the evoked IPSPs was significantly larger when we replayed the pattern of the lower rate recorded under deep anesthesia. In addition, depression of the evoked IPSPs was clearly observed throughout the 3-s-long depolarization, in particular for the higher rate. Hence, the analysis of these data was confined to the last 1 s of the depolarized traces (Fig. 4B, bold portion of the traces). The patterns of low and high rates, as recorded without administration of the synaptic blocker, were replayed for each cell at two levels of anesthesia to evaluate the effects of anesthesia and rate independently.

Rate-dependent synaptic depression of inhibitory synapses is independent of the actual depth of anesthesia. A, Cortical excitation was pharmacologically blocked and the cell was depolarized by positive current injection, whereas the temporal patterns of PSPs observed under deep (top) and light (bottom) anesthesia were replayed using electrical stimulation (black vertical bars; see Materials and Methods). Only the last 1 s of the trails were analyzed (black portion of the traces). B, Electric stimulus-triggered average of IPSPs of the cell presented in A for high (left) and low (right) rates of cortical stimulation, under deep and light anesthesia conditions. C, MRP for inhibitory potentials for six cells. MRP size was higher under the low rate stimulation, regardless of the level of anesthesia. The population average is in black. D, A significant increase in IPSP amplitude was observed under the low rate of stimulation, regardless of the level of anesthesia. Error bars represent SEM. *p < 0.05, **p < 0.01.
Interestingly, the average amplitude of the inhibitory response to electrical stimulation was larger at the lower rate of stimulation, regardless of the actual depth of anesthesia (Fig. 5A,B). Across the population, we found that the level of anesthesia had no effect on the average peak amplitude of the evoked IPSPs (Fig. 5C; 2.8 ± 0.97%, p = 0.96 for a low rate of stimulation and 4.1 ± 0.99%, p = 0.82 for a higher rate of cortical stimulation). For both levels of anesthesia, the amplitude of evoked IPSPs increased significantly in response to a low-frequency compared with high-frequency stimulation (63.68 ± 4.7%, p = 0.02 for light anesthesia and 64.01 ± 5.3%, p = 0.02 for deep anesthesia). Furthermore, MRP analysis strongly supported the above conclusions, demonstrating no differences in MRP for a given rate when measured at different levels of anesthesia (Fig. 5D; percentage change in MRP: 3.0 ± 1.1%, p = 0.45 for the high rate and 1.9 ± 1.02%, p = 0.94 for the low rate). Similarly to the amplitude measurements, the MRP was significantly higher when the lower rate of stimulation was used (by 62 ± 2.7%, p = 0.0026 for light anesthesia and by 62 ± 5.1%, p = 0.002 for deep anesthesia). Together, our results strongly indicate that the change in the magnitude of inhibition across levels of anesthesia is mediated through a change in the rate of cortical inhibitory inputs, as a result of short-term synaptic depression.
Discussion
Here we asked how spontaneous cortical E/I balance changes when the depth of anesthesia is altered. Using intracellular recording of layer 4 cells in S1, we found that the magnitude of inhibitory events significantly increased under deep anesthesia without any significant change in the magnitude of excitatory ones. We used intracortical electrical stimulation to replay the fast and slow patterns of inhibitory activities recorded at light and deep anesthesia, respectively. We found that inhibitory synapses were depressed at higher stimulation rate, regardless of the actual depth of anesthesia. Our data suggest that short-term synaptic depression plays a central role in determining the E/I balance during spontaneous activity.
Effects of anesthesia on cortical activity
In agreement with previous studies, EEG power at the low-frequency bands increases during deep anesthesia (Rampil, 1998; Franks and Zecharia, 2011; Katz et al., 2012). Although EEG dynamics during light and deep anesthesia closely matched that of awake and slow-wave sleep, respectively (Steriade et al., 1993), these circuits may operate differently and in a layer-dependent manner in drug-free animals. In layer 4, increasing the depth of anesthesia decreases the rate of excitatory and inhibitory events. Because of possible changes in shuffling of inputs and in synchronized activity, this by itself does not necessarily indicate that the firing rate of presynaptic cells was reduced. However, our results show clear reduction in the firing rate of both putative inhibitory and excitatory cells under deep anesthesia (Fig. 4A), in agreement with extracellular recordings of layer 4 cells comparing states of cortical synchronization and desynchronization (Hirata and Castro-Alamancos, 2010) and during shifts between states of natural slow-wave sleep or isoflurane anesthesia and wakefulness (Vijayan et al., 2010).
Cortical excitation is insensitive to changes in inhibition
Synaptic connections between excitatory and inhibitory cortical neurons predict that changes in the magnitude of inhibition will affect that of excitation. However, we show that a prominent change in the size of inhibitory events was not accompanied by a change in the size of excitatory events. A similar result was reported recently in the mouse V1, demonstrating that evoked excitation in pyramidal neurons of layer 2/3 was not affected by optogenetic suppression of parvalbumin-expressing cells (Atallah et al., 2012). Although only single cells were recorded in our study, we suggest that changes in E/I balance strongly affect the synchrony in the network in a similar way that is induced by the cholinergic system (Goard and Dan, 2009). Specifically, the widening of the zPSP is caused by reduced inhibitory drive under light anesthesia. In turn, this change increases the integration time window for excitation and thus allows spikes to be emitted over a wider time range, which may cause a reduction of synchronized firing in the network.
Upstream effects of anesthesia on cortical E/I balance
The mechanisms that control the magnitude of inhibition across different levels of anesthesia can be both intrinsic and synaptic. Both can result from the anesthetics acting directly on cortical neurons or upstream to the cortex. Furthermore, the effects of these mechanisms can be mediated by the neuromodulatory systems acting on cortical or subcortical circuits. Direct effect of the anesthetics or neuromodulators on cortical circuits can alter the magnitude of inhibition directly or as a result of changes in the intrinsic properties of the neurons. However, in our experiments, we found no significant changes in the input resistance or resting potential for the different levels of anesthesia, in agreement with the insignificant effect of halothane on the Vm of hippocampal neurons (Nishikawa and MacIver, 2000). In contrast, recordings from brainstem neurons showed significant hyperpolarization under a high concentration of halothane (Sirois et al., 2000). In vitro studies demonstrated that the amplitude of IPSPs increases after application of halothane (Nishikawa and MacIver, 2000). In contrast, others showed that anesthetics do not affect directly the firing and synaptic transmission at the cortical level (Keifer et al., 1996; Ries and Puil, 1999; Alkire et al., 2007). Our results support the later findings because the three families of anesthetics, despite their different pharmacological mechanisms of actions, induced similar effects on E/I balance and had no effect on the passive properties of the cells. Finally, this conclusion is strongly supported by our finding that the amplitude of electrically evoked IPSP is independent of the actual depth of anesthesia (Fig. 5).
The magnitude of the cortical inhibitory input is rate dependent
Shifts in cortical activity were suggested to reflect changes in the rate of thalamocortical inputs (Hirata and Castro-Alamancos, 2010; Bereshpolova et al., 2011; Constantinople and Bruno, 2011; Poulet et al., 2012). Thalamocortical synapses onto inhibitory neurons depress on repeated activation significantly more than do thalamocortical synapses onto excitatory neurons (Beierlein et al., 2003; Gabernet et al., 2005). Additionally, the reciprocal connections between inhibitory fast-spiking neurons and excitatory regular-spiking neurons undergo strong depression, whereas the connections between inhibitory low-threshold spiking and regular-spiking cells mostly facilitated (Beierlein et al., 2003). Hence, the modulation of the E/I balance in layer 4 can result from changes in the rate of thalamocortical inputs. Accordingly, an increased rate of feedforward thalamic inputs entails more depression of inhibition compared with excitation, mostly because of reduction in the recruited population of fast-spiking neurons. However, our results (Figs. 4, 5) strongly suggest that depression of inhibitory synapses contributes to reduced magnitude of inhibition during higher rate of spontaneous activity.
The similarity in their rate of activities suggests that putative fast-spiking cells (Fig. 4A) are the main cell type responsible for the IPSPs recorded intracellularly (Fig. 2). This suggestion is in agreement with a recent in vitro study that showed that, in layer 2/3, fast-spiking cells play a significant role in determining the E/I balance during spontaneous activity (Tahvildari et al., 2012). Hence, we suggest that overlapping sets of presynaptic inhibitory afferents were activated between successive inhibitory events. By replaying the patterns of inhibitory inputs using local electrical stimulation while blocking cortical excitation, we showed that the magnitude of inhibition increased as the rate of stimulation decreases (Fig. 5). Furthermore, at a frequency range of ∼10 Hz, even a moderate reduction in the rate of stimulation profoundly increases the magnitude of inhibition. Similarly, in vitro studies found that depression of inhibitory synapses is sensitive to small changes in presynaptic firing frequency for input rates of ∼10 Hz, although for input rates >40 Hz, this is no longer the case (Beierlein et al., 2003; Gabernet et al., 2005). Moreover, we found that the rate-dependent depression of inhibition was independent of the actual level of anesthesia, in agreement with the similar effects of different anesthetics on E/I balance.
The slow recovery of spontaneous IPSPs from brief repetitive intracortical stimulation strongly suggests an overlapping in the population of inhibitory synapses that were activated during spontaneous activity and in response to electrical stimulation. Indeed, increasing the depth of anesthesia and reducing the rate of local electrical stimulation increased the magnitude of inhibition by a similar proportion (60 and 63%, respectively). In agreement with our conclusions, LFP recordings in layer 4 across different states of wakefulness suggest that thalamocortical synaptic transmission is unlikely to be affected by the neuromodulatory systems across states, but as a result of depression, it depends only on the rate of these inputs (Stoelzel et al., 2009).
Two independent factors can explain the lack of change in the magnitude of excitatory events across different levels of anesthesia and rates of activity. First, the firing rate of cortical excitatory neurons is much lower than the rate of excitatory synaptic events (compare Figs. 2A, 4A), suggesting that these inputs are primarily shuffled between events. Accordingly, a large pool of presynaptic excitatory cells that fire at a very low rate participate in the ongoing activity, with only a small fraction of them contributing successively to each spontaneous event. Second, spontaneous excitatory activity quickly reappeared after the suppression that was induced by repetitive electrical stimulation (Fig. 4B), suggesting that excitatory synapses recover rapidly from short-term synaptic depression. Although we have not recorded from thalamic cells in this study, the first argument also holds for these inputs because we recently that showed spontaneous thalamic firing is very low (<2 Hz) under both light and deep anesthesia (Katz et al., 2012).
Whether the present results are applicable only to layer 4 of the S1 requires additional investigation. A recent study reported stronger visually evoked inhibition in layer 2/3 of V1 in awake versus anesthetized mice (Haider et al., 2013). In the present study, layer 4 interneurons increased their firing rate under light anesthesia, in agreement with the possibility of higher cholinergic activation of thalamic input (Goard and Dan, 2009; Hirata and Castro-Alamancos, 2010). In contrast to layer 4 dynamics, a marked reduction in the firing rate was found during transition from synchronized to desynchronized states in layer 2/3 (Gentet et al., 2010; Sakata and Harris, 2012; Haider et al., 2013). A more complicated picture emerged recently in a study of layer 2/3 cells in V1 (Alitto and Dan, 2013), in which it was shown that the firing rate of excitatory and parvalbumin-positive cells increases at low levels of cortical desynchronization as a result of activation of muscarinic receptors and decreases under strong desynchronization as a result of activation of nicotinic receptors. Together, emerging evidence shows that, although the firing rate of layer 4 cells increases under desynchronized state, it decreases in layer 2/3 cells. Therefore, we suggest that a reduction in the firing rate of layer 2/3 neurons under a desynchronized state allows inhibitory synapses to recover from synaptic depression during spontaneous activity and explains why the magnitude of visually evoked inhibition in V1 layer 2/3 is greater in the awake animal (Haider et al., 2013).
In summary, variation in the firing rate of cortical cells in combination with short-term synaptic depression properties can explain changes in E/I balance across different cortical states. Our approach to directly quantify the dynamics of E/I balance within a cell can be used to measure E/I balance in drug-free animals across different behavioral conditions.
Footnotes
This work was supported by Israel Science Foundation Grants 1160/11 and 1565/10, United States–Israel Binational Science Foundation Grant 2007444, ERA-NET Neuron, the Minerva Foundation funded by the Federal German Ministry for Education and Research, and German Research Foundation Project C3 of Collaborative Research Centre 889. We thank Michael Okun, Misha Tsodyks, Elad Ganmor, Gilad Silberberg, and the members of the Lampl group for their helpful comments on this work.
The authors declare no competing financial interests.
- Correspondence should be addressed to Ilan Lampl, Department of Neurobiology, Weizmann Institute of Science, Rehovot 76100, Israel. ilan.lampl{at}weizmann.ac.il


