

Article Figures & Data
Figures
- Figure 1.
Cortical neurons with Shank3 knockdown show a selective reduction of NMDAR-mediated ionic and synaptic currents. A, Representative Western blots of Shank3 in HEK293 cells transfected with full-length rat Shank3 (Shank3FL) or the N-terminal deleted, siRNA-resistant Shank3 construct (Shank3R) in the presence of Shank3 siRNA or a scrambled control siRNA. B, Top, Immunostaining of Shank3 in cortical cultures (DIV19–22) transfected with control siRNA, Shank3 siRNA, or Shank3 siRNA plus Shank3R. Bottom, Bar graphs (mean ±SEM) showing the density, size, and intensity of Shank3 clusters (red) in neurons (GFP-positive) with different transfections. *p < 0.01, ANOVA. C, Representative traces of NMDAR- or AMPAR-mediated ionic currents in cultured cortical neurons (DIV 21) transfected with control siRNA, Shank3 siRNA, or Shank3 siRNA plus Shank3R. Calibration: 200 pA, 0.5 s. D, Bar graph summary of the NMDAR- or AMPAR-current density in cortical cultures with different transfections. *p < 0.01, ANOVA. E, Representative traces of evoked NMDAR-EPSC and AMPAR-EPSC in cortical neurons (DIV 14–18) transfected with Shank3 siRNA or GFP alone. Calibration: 20 pA, 50 ms. F, Bar graphs showing the peak amplitude of evoked NMDAR-EPSC and AMPAR-EPSC in cortical cultures with different transfections. *p < 0.01, t test.
- Figure 2.
Cortical neurons with Shank3 knockdown show reduced surface NR1 clusters. A, Immunostaining of surface NR1 in cortical cultures (DIV 19–22) transfected with control siRNA, Shank3 siRNA, or Shank3 siRNA plus Shank3R. Scale bar, 10 μm. B, Bar graphs (mean ± SEM) showing the density, size, and intensity of surface NR1 clusters (red) in neurons (GFP-positive) with different transfections. *p < 0.01, ANOVA. C, Immunostaining of PSD-95 in cortical cultures transfected with control siRNA or Shank3 siRNA. D, Bar graphs (mean ± SEM) showing the density, size, and intensity of PSD-95 clusters (red) in control siRNA- or Shank3 siRNA-transfected neurons (GFP-positive).
- Figure 3.
The Shank3 regulation of NMDAR currents is influenced by agents that affect actin dynamics. A, Representative NMDAR currents in cultured cortical neurons transfected with control siRNA or Shank3 siRNA (DIV 19–22) in the presence of actin stabilizer phalloidin (1 μm), actin destabilizer latrunculin B (5 μm), or the microtubule stabilizer taxol (10 μm). Calibration: 200 pA, 0.5 s. B, Bar graph summary of NMDAR current density in control siRNA- or Shank3 siRNA-transfected neurons in the absence or presence of various cytoskeleton modifying agents. *p < 0.01, ANOVA.
- Figure 4.
Rac1 is involved in Shank3 regulation of NMDAR currents. A, Representative NMDAR currents in cultured cortical neurons transfected with control siRNA or Shank3 siRNA (DIV 21) in the absence or presence of Rac1 inhibitor EHT (1 μm), or co-transfected with either CA-Rac1 (0.65 ng/μl, constitutively active form of Rac1) or DN-Rac1 (0.65 ng/μl, dominant-negative form of Rac1). Calibrations: 200 pA, 0.5 s. B, Bar graph summary of NMDAR current density in control siRNA- or Shank3 siRNA-transfected neurons in the absence of presence of various Rac1-altering agents. *p < 0.01, ANOVA.
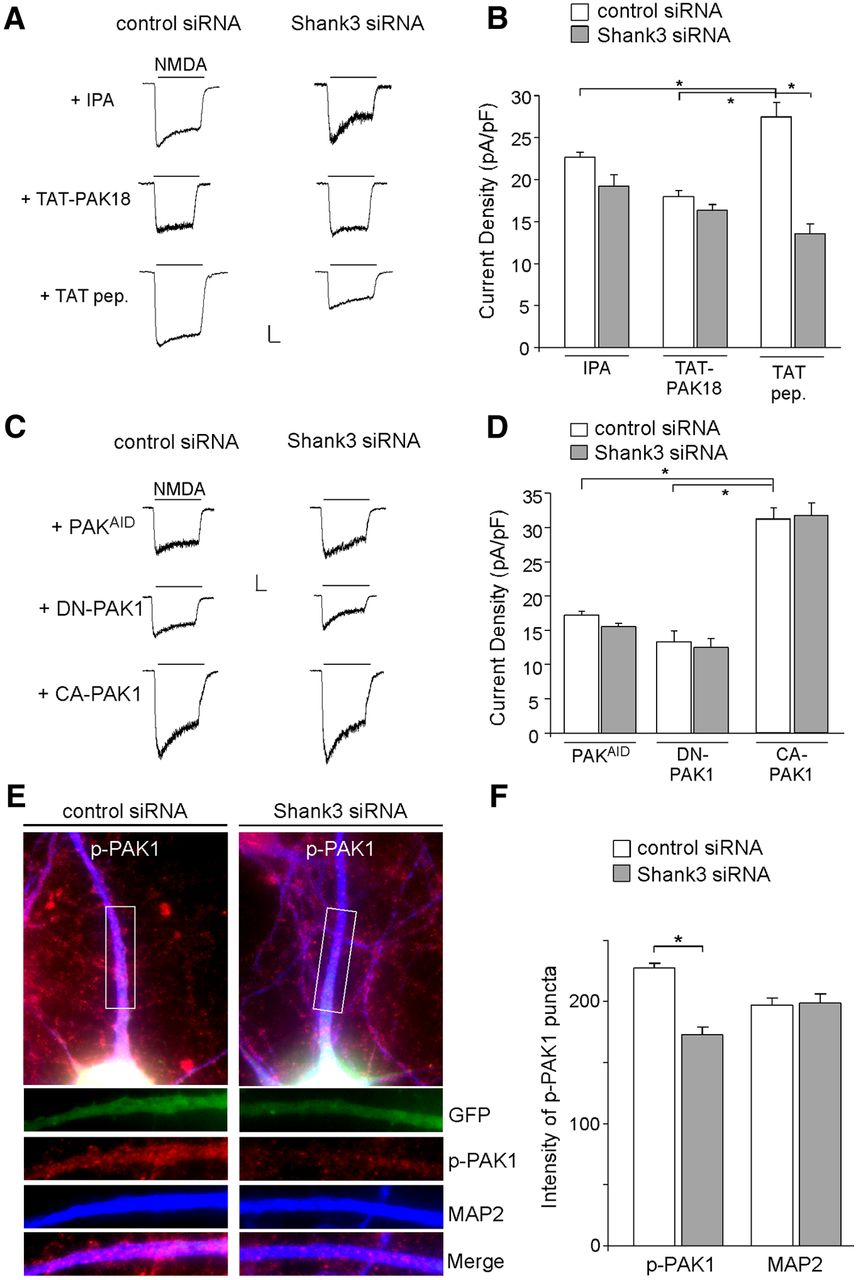
- Figure 5.
PAK activity is required for Shank3 regulation of NMDAR currents. A, Representative NMDAR currents in cultured cortical neurons transfected with control siRNA or Shank3 siRNA (DIV 21) in the presence of a pharmacological PAK inhibitor, IPA (5 μm), or a membrane-permeable PAK inhibitory peptide, TAT-PAK18 (10 μm). A peptide only containing the cell-permeable TAT sequence was used as a control. Calibrations: 200 pA, 0.5 s. B, Bar graph summary of NMDAR current density in control siRNA- or Shank3 siRNA-transfected neurons in the absence or presence of various PAK inhibiting agents. *p < 0.01, ANOVA. C, Representative NMDAR currents in cultured cortical neurons co-transfected with Shank3 siRNA and PAKAID (10 μm, dominant-negative form of PAK1–3), DN-PAK1 (0.95 ng/μl, dominant-negative form of PAK1), or CA-PAK1 (0.65 ng/μl, constitutively active form of PAK1). A control siRNA was also used. D, Bar graph summary of NMDAR current density in control siRNA- or Shank3 siRNA-transfected neurons in the presence of PAK mutants. *p < 0.01, ANOVA. E, Immunostaining of Thr423p-PAK1 (red) and MAP2 (blue) in cortical cultures transfected with control siRNA or Shank3 siRNA (green). F, Bar graph summary (mean ±SEM) of the intensity of p-PAK1 and MAP2 staining in control siRNA- or Shank3 siRNA-transfected neurons (GFP-positive). *p < 0.01, t test.
- Figure 6.
Shank3 knockdown reduces F-actin clusters, which is mimicked and occluded by PAK inhibitor. A, C, Immunostaining of F-actin (red) and MAP2 (blue) in cortical cultures (DIV 19–22) transfected with control siRNA or Shank3 siRNA (green) in the absence (A) or presence (C) of TAT-PAK18. B, D, Bar graph summary (mean ± SEM) showing the density, size, and intensity of F-actin puncta in control siRNA- or Shank3 siRNA-transfected neurons (GFP-positive) in the absence (B) or presence (D) of TAT-PAK18. *p < 0.01, t test.
- Figure 7.
Inhibiting cofilin activity blocks the effects of Shank3 siRNA on NMDAR currents and F-actin. A, Representative NMDAR currents in cultured cortical neurons transfected with control siRNA or Shank3 siRNA (DIV 19–22) in the presence of a membrane-permeable cofilin inhibitory peptide, TAT-p-Cofilin (10 μm), or a TAT control peptide. B, Bar graph summary of NMDAR current density in control siRNA- or Shank3 siRNA-transfected neurons in the presence of TAT-p-Cofilin peptide or TAT control peptide. *p < 0.01, ANOVA. C, Immunostaining of F-actin (red) and MAP2 (blue) in cortical cultures transfected with control siRNA or Shank3 siRNA (green) treated with TAT-p-Cofilin peptide. D, Bar graph summary (mean ±SEM) showing the density, size, and intensity of F-actin puncta in control siRNA- or Shank3 siRNA-transfected neurons (GFP-positive) in the presence of TAT-p-Cofilin peptide.


