

Article Figures & Data
Figures
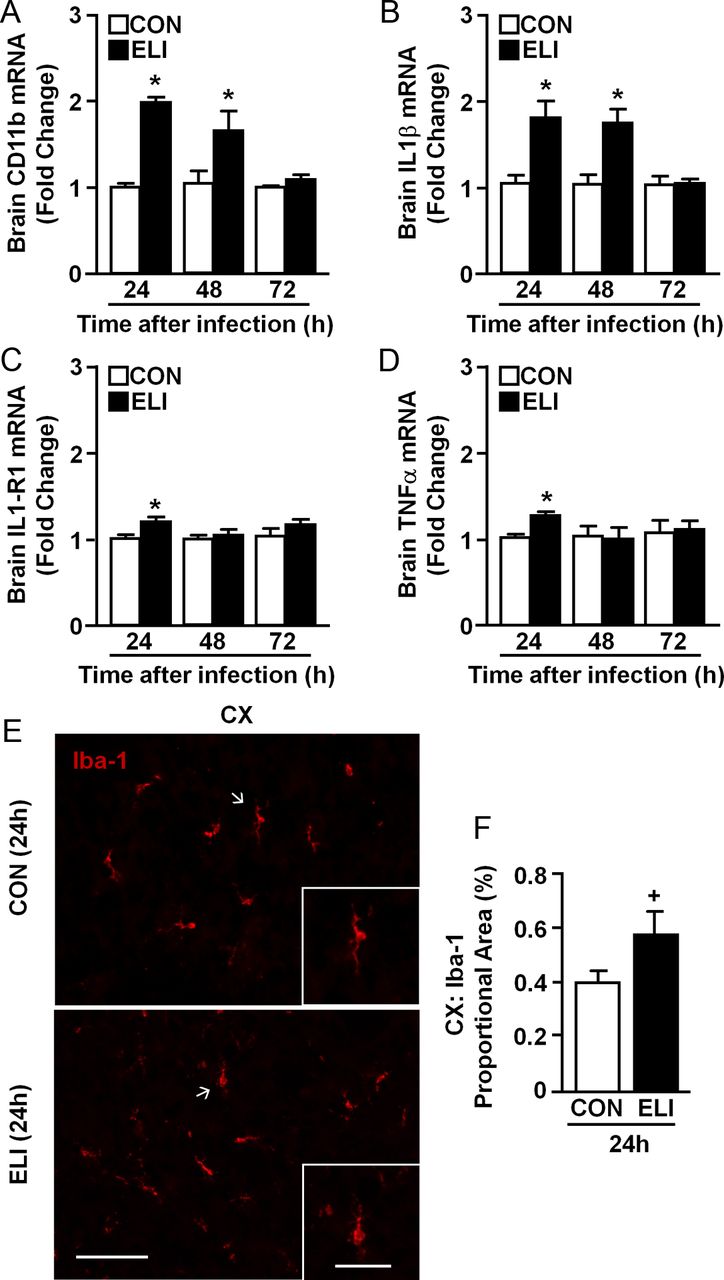
- Figure 1.
Neonatal (P3) E. coli infection caused transient brain inflammation and microglial activation. Neonatal BALB/c mice (P3) were injected subcutaneously with either sterile saline (CON) or E. coli (ELI). Brains were collected from male and female mice 24, 48, or 72 h later and mRNA levels of (A) CD11b, (B) IL-1β, (C) IL-1R1 and (D) TNFα were determined (n = 7). In a related study, male and female mice were infected as above. The brain was collected 24 h later and Iba-1 protein expression was determined. E, Representative images of Iba-1 labeling in the CX of both CON and ELI mice are shown (scale bar, 100 μm). Insets show enlarged image of microglia (scale bar, 50 μm). F, Digital image analysis of Iba-1 proportional area in the cortex (n = 4). Bars represent the mean ± SEM. Means with asterisk are significantly different from controls (p < 0.05). Means with plus sign denote a tendency (p ≤ 0.1).
- Figure 2.
Reduced motor coordination and hyperactivity were observed in juvenile and young adult after neonatal infection. Neonatal mice (P3) were injected subcutaneously with either saline (CON) or E. coli (ELI), and motor coordination in males was determined when mice were juveniles (P35) and again as young adults (P60). Time spent on the accelerating rotarod is shown at (A) P35 and (B) P60 (n = 8). In a separate study, locomotor activity was determined in male CON and ELI mice as juveniles (P35) and young adults (P60). C, Total distance traveled and (D) total time moving in an open field at P35 and P60 are shown (n = 7). In a separate study, object memory was determined in CON and ELI mice as (E) juveniles (P35) and (F) young adults (P60) (n = 14). Bars represent the mean ± SEM. Means with asterisk are significantly different from controls (p < 0.05), and means with plus sign tended to be different from controls (p ≤ 0.1).
- Figure 3.
Hypomyelination was observed in the brains of juvenile mice exposed to E. coli as neonates. Neonatal mice (P3) were injected subcutaneously with either saline (CON) or E. coli (ELI), and brain tissue from male and female mice was collected and stained for myelin 1 month later (P35). Representative images and quantification of myelin staining are shown in: A, coronal section and B, quantification of total white and gray matter areas examined; C, D, the mid-section of the corpus callosum; E, F, the cingulum bundle of the corpus callosum; G, H, the motor cortex; and I, J, cerebellum. Bars represent the mean ± SEM (n = 6–9). Means with asterisk are significantly different from controls (p < 0.05), and means with plus sign tended to be different from controls (p ≤ 0.1). Rel, Relative; CC, Corpus callosum; Cing, cingulum bundle; MCX, motor cortex; CBM, cerebellum. Scale bars: A, C, 500 μm; E, G, I, 250 μm.
- Figure 4.
Reduced number of oligodendrocytes in the corpus callosum and motor cortex of juvenile mice exposed to E. coli as neonates. Neonatal mice (P3) were injected subcutaneously with either saline (CON) or E. coli (ELI), and brain tissue from male and female mice was collected at P35 and Olig2 (red) and GFAP (green) or Olig2 (red) and NG2 (green) labeling was determined. Representative images of (A) Olig2, (B) Olig2/GFAP, (C) Olig2/NG2 from the CC of CON and ELI mice are shown. Average number of Olig2+/NG2+ cells in the (D) MCX, (E) CC, and (F) hippocampus (HPC). Average number of Olig2+/NG2− cells in the (G) MCX, (H) CC, and (I) HPC. Bars represent the mean ± SEM (n = 6). Means with asterisk are significantly different from controls (p < 0.05), and means with plus sign tend to be different from controls (p ≤ 0.1).
- Figure 5.
ELI altered the expression of iron storage related genes. Neonatal mice (P3) were injected subcutaneously with saline (CON) or E. coli (ELI), and blood, liver, and brain from male and female mice were collected at P4 and P12. A, Total iron was determined from serum at P4 and P12. B, Liver mRNA levels of hepcidin were determined (n = 6). Brain mRNA levels of (C) hepcidin, (D) ferroportin, (E) transferrin receptor and (F) L-ferritin were determined at P4 and P12 (n = 6). Bars represent the mean ± SEM (n = 6). Means with asterisk are significantly different from controls (p < 0.05), and means with plus sign tended to be different from controls (p ≤ 0.1).
- Figure 6.
ELI reduced ferroportin in the motor cortex at P4. Neonatal mice (P3) were injected subcutaneously with either saline (CON) or E. coli (ELI), and brain tissue from male and female mice was collected at P4 or P12. Protein levels of ferroportin (Ferro) were determined. Representative images of ferroportin labeling in the (A) CA1 of the HPC, (C) MCX, and (E) CC. Proportional area analyses of ferroportin labeling at P4 and P12 is provided for the (B, G) HPC, (D, H) MCX, and (F, I) CC. Hippocampus proportional area analysis represents average proportional area observed in the CA1, CA3, and dentate gyrus. Bars represent the mean ± SEM (n = 4). Means with asterisk are significantly different from controls (p < 0.05), and means with plus sign tended to be different from controls (p ≤ 0.1).
- Figure 7.
ELI robustly increased L-ferritin in the hippocampus and cortex before myelination. Neonatal mice (P3) were injected subcutaneously with either saline (CON) or E. coli (ELI), and brain tissue from male and female mice was collected at P12 and the protein levels of L-ferritin (L-Fer) were determined. Representative images of L-ferritin labeling are shown in the (A) CA1 of the HPC, (C) MCX, and (E) CC. Proportional area analyses of L-ferritin labeling for the (B) HPC, (D) MCX, and (F) CC are provided. HPC proportional area analysis represents average proportional area observed in the CA1, CA3, and dentate gyrus. Bars represent the mean ± SEM (n = 4). Means with asterisk are significantly different from controls (p < 0.05).
- Figure 8.
ELI-associated increase in L-ferritin did not colocalize with microglia, astrocytes, or oligodendrocytes. Neonatal mice (P3) were injected subcutaneously with either saline (CON) or E. coli (ELI), and brain tissue from male and female mice was collected at P12 and labeling for Iba-1 (pink), GFAP (white), Olig2 (light blue), and L-ferritin (L-Fer; red). Representative pictures of (A) microglia (Iba-1), (D) astrocytes (GFAP), and (G) oligodendrocytes (Olig2) in the corpus callosum (proximal to the hippocampal CA1 region) are shown. Quantification of immunopositive glia in the CC, HP, and CX for (B) Iba-1, (E) GFAP, and (H) Olig2 are provided. Representative images of colabeling with L-ferritin for (C) Iba-1, (F) GFAP, and (I) Olig2 are also provided. Bars represent the mean ± SEM (n = 4). Means with asterisk are significantly different from controls (p < 0.05). Means with plus sign denote a tendency (p ≤ 0.1). Scale bar, 100 μm.
- Figure 9.
Neonatal infection leads to iron sequestration in neurons before peak myelination. Neonatal mice (P3) were injected subcutaneously with either saline (CON) or E. coli (ELI), and brain tissue from male and female mice was collected at P12 and labeled for NeuN and L-Fer. Representative images of NeuN+ and L-ferritin+ are shown in the (A) CA1, (B) CA3, and (C) dentate gyrus (DG) regions of the HPC, and (D) the CX. Proportional area analyses of L-ferritin labeling in the (E) CA1, (F) CA3, (G) dentate gyrus, and (H) CX are shown. I, Orthogonal projections of interneurons from the CA1 region of the hippocampus for control and ELI mice are provided. Bars represent the mean ± SEM (n = 4). Means with asterisk are significantly different from controls (p < 0.05). Scale bars: A–D, 100 μm; I, 5 μm.


Tables
1 d after infection 7 d after infection Brain Liver Spleen Brain Liver Spleen Control — — — — — — K-12 E.coli ++ +++ + — — — Male and Female neonatal mice were injected subcutaneously with K-12 E. coli at P3. Brain, liver, and spleen tissues were collected 1 or 7 d later and cultured on nutrient-rich agar. Results expressed as average CFU recovered per specimen. —, No CFU recovered; +, 1–10 CFU; ++, 10–150 CFU; +++ ≥ 150 CFU (n = 6).


