

Article Figures & Data
Figures
- Figure 1.
The crustacean cardiac system and experimental procedure for characterizing the NMT. A, Schematic diagram of the intact crustacean cardiac system. The cardiac CPG (green box) sends feed-forward neural commands to the cardiac tissue, which provides feedback to the cardiac ganglion. The cardiac ganglion consists of four premotor neurons (in blue) and five motor neurons (in red), all of which are spontaneously oscillatory. B, In stimulated heart preparations, the cardiac CPG is removed (top) and the motor nerve is electrically stimulated by a suction electrode (bottom). C, Example trace from a stimulated heart preparation. The schematic on the left illustrates a more realistic representation of the crustacean heart than the diagrams in A and B. The cardiac motor nerve is stimulated (red trace), and muscle movement (black trace) is recorded via a force transducer.
- Figure 2.
The cardiac NMT measured in 16 stimulated heart preparations. Muscle movement traces from each preparation are overlaid. A, Response of the hearts to three representative patterns of electrical stimulation (see B, matching circled numbers). Traces on the left represent raw movement recordings, which vary significantly in amplitude. Traces on the right represent normalized by dividing each trace by the peak amplitude for that heart across all stimulation patterns. B, Normalized steady-state movement recordings for each of the 36 stimulation patterns.
- Figure 3.
Cardiac motor neuron activity is intrinsically variable across semi-intact heart preparations. A, Three example semi-intact heart experiments showing interanimal variability across preparations. The schematic at the top of the panel illustrates the experimental setup. Purple traces show extracellular suction electrode recordings of an anterolateral cardiac motor nerve; black traces show the heart contractions as measured by a force transducer (see Materials and Methods). (compare with Fig. 1C). B, Scatterplot matrix showing measured neural activity patterns across 122 semi-intact preparations. The scatterplots represent all pairwise relationships between motor neuron duty cycle, burst frequency, and spike frequency. Below the diagonal, red lines indicate the best fit line for each pairwise relationship. Above the diagonal, the R2 value for each pairwise relationship is listed. **p < 0.001. Histograms along the diagonal represent the distribution for each of these three variables.
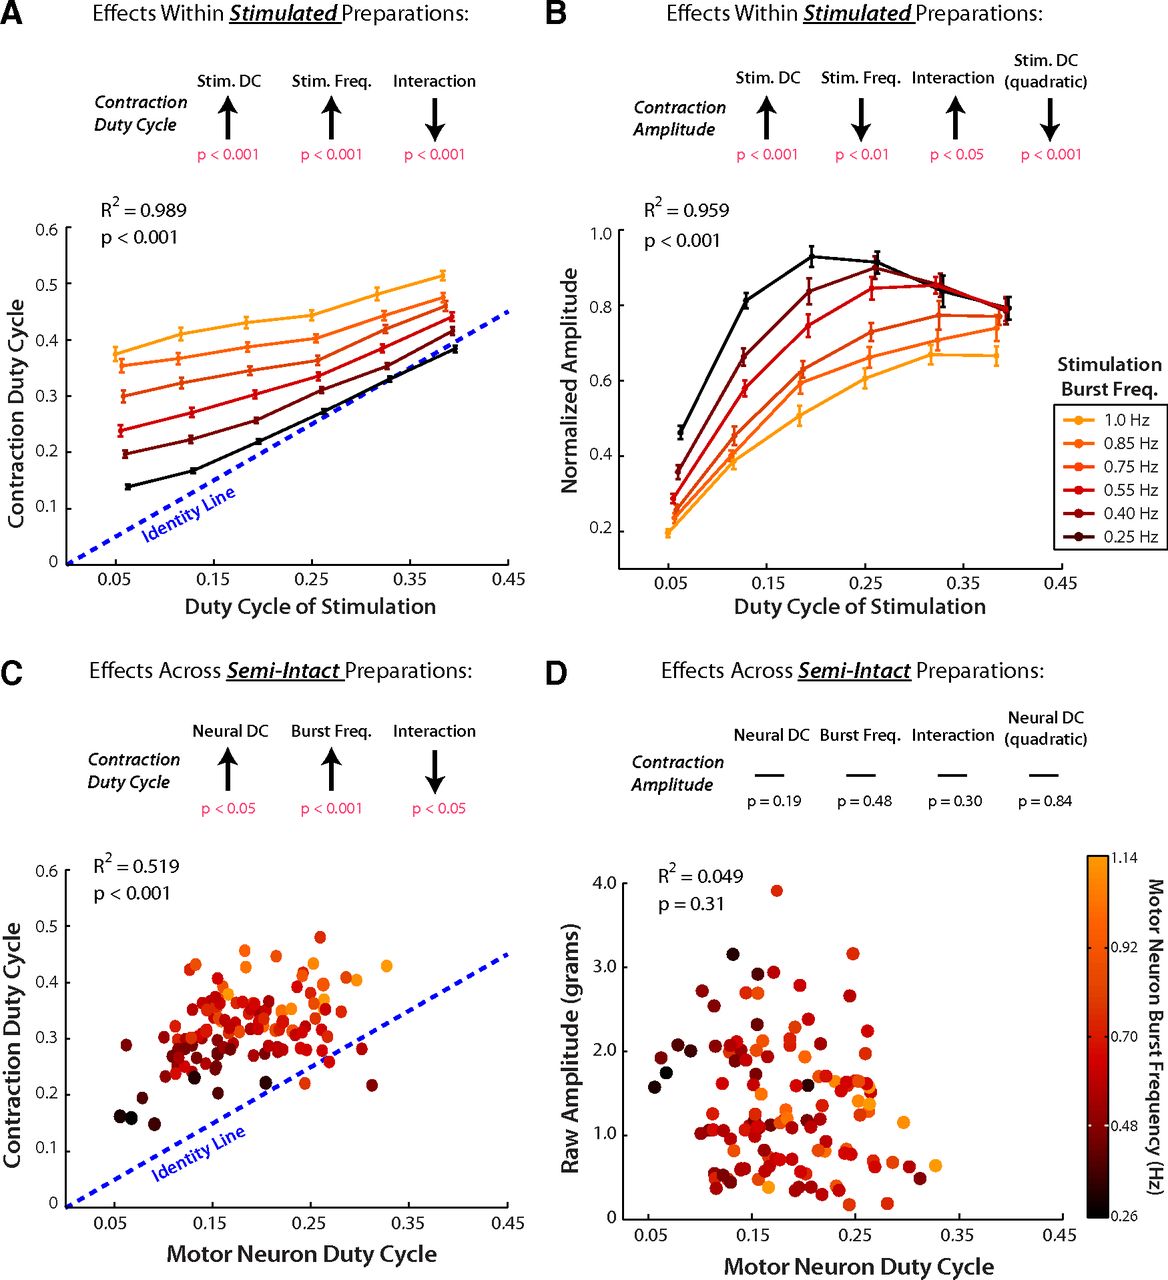
- Figure 4.
Predicting contraction duty cycle and amplitude from neural inputs within stimulated preparations and across semi-intact hearts. A, C, Linear models were fit to the form y = b0 + b1x1 + b2x2 + b3x1x2; where y = muscle contraction duty cycle, x1 = stimulation/neural duty cycle, and x2 = stimulation/neural burst frequency. B, D, Linear models were fit to the form z = b0 + b1x1 + b2x2 + b3x1x2 + b4x12; where z = muscle contraction amplitude. All estimates for regression parameters (b1, b2, etc.) were obtained using ordinary least-squares. Arrows at the top of each panel schematically indicate the sign and significance of each regression parameter using ANOVA; full ANOVA results are given in Tables 1 and 2. Plots at the bottom of each panel indicate the dependent variable on the vertical axis, neural/stimulation duty cycle on the horizontal axis, and neural/stimulation burst frequency on a color scale (see legends to the right of B, D). A, B, Effects of stimulation duty cycle and burst frequency on muscle contraction duty cycle (A) and contraction amplitude (B) within stimulated heart preparations. Error bars indicate mean ± SE (n = 16 preparations). C, D, Effects of spontaneous motor neuron duty cycle and burst frequency on muscle contraction duty cycle (C) and contraction amplitude (D) across semi-intact heart preparations (n = 122).
- Figure 5.
The cardiac NMT explains the differential effects of AST-C on contraction amplitude. A, In semi-intact heart preparations, bath application of the neuropeptide AST-C consistently decreases heart rate but either decreases (top) or increases (bottom) contraction amplitude. The experimental recordings show the extracellular motor nerve activity (gray traces) above the muscle contractions (blue trace and red trace). B, The NMT prediction for relative contraction amplitude (normalized to the largest response within preparations) across different levels of motor neuron burst frequency and duty cycle. Dark tiles represent low-amplitude contractions; light tiles represent large-amplitude contractions (the precise numeric value is given in the center of each tile). C, The effects of AST-C in 48 semi-intact preparations. The black/white background illustrates the cardiac NMT prediction for amplitude (similar to B, except we linearly interpolated to estimate the NMT prediction between the sampled 6 × 6 grid of points). Each arrow indicates the change in neural activity induced by AST-C (tail = control; tip = after AST-C application). Each arrow is colored by the effect of AST-C on contraction amplitude (see color bar above plot). D, The expected versus observed percentage changes in contraction amplitude induced by the application of AST-C. If the NMT model were perfect, all data points would fall on the identity line (y = x, orange-red line). The dark and light orange bands around the identity line indicate the ±10% and 20% change, respectively, in amplitude from the identity line.
- Figure 6.
The predicted changes in contraction amplitude resulting from hypothetical manipulations of neural activity. Black-and-white background represents the cardiac NMT prediction for contraction amplitude at various levels of neural stimulation (data are depicted as in Fig. 5B; white represents high-amplitude contractions; black represents low-amplitude contractions). A, B, Red arrows indicate manipulations that increase contraction amplitude; blue arrows indicate manipulations that decrease contraction amplitude. B, Purple arrow indicates a manipulation that approximately preserves contraction amplitude. Decimal numbers indicate normalized amplitude measurements for the initial and final neural activity patterns (same as Fig. 5B).


Tables
Stimulated heart preparations Across semi-intact preparations Sum of squares df F p Sum of Squares df F p Duty cycle 0.0515 1 461.2 1E-20 0.0123 1 6.442 0.012 Burst frequency (Hz) 0.0710 1 635.3 1E-22 0.0570 1 29.943 3E-07 Interaction 0.0088 1 78.8 4E-10 0.0102 1 5.355 0.022 Error 0.0036 32 0.2227 118 ↵aSee Figure 4A, C.
Stimulated heart preparations Across semi-intact preparations Sum of squares df F p Sum of squares df F p Duty cycle 0.3201 1 157.0 1E-13 0.893 1 1.715 0.19 Burst frequency (Hz) 0.1189 1 58.3 1E-08 0.262 1 0.504 0.48 Interaction 0.0100 1 4.9 0.034 0.561 1 1.078 0.30 Duty cycle (quadratic) 0.2847 1 139.6 5E-13 0.020 1 0.039 0.84 Error 0.0632 31 60.929 117 ↵aSee Figure 4B, D.
- Table 3.
95% confidence intervals of regression model coefficients for predicting contraction duty cyclea
Stimulated heart preparations Across semi-intact preparations Lower bound Estimate Upper bound Lower bound Estimate Upper bound Duty cycle 0.792 0.875 0.959 0.122 0.557 0.992 Burst frequency (Hz) 0.350 0.381 0.412 0.229 0.360 0.490 Interaction −0.659 −0.536 −0.413 −1.354 −0.729 −0.105 ↵aThe regression model fit to data from stimulated heart preparations is not significantly different from the model fit to data across semi-intact heart preparations.


