

Article Figures & Data
Figures
- Figure 1.
Experiment paradigm and replication of typical behavioral results in 0–2 Hz RT time courses. A, Subjects fixated a central cross and covertly attended to two peripheral boxes. After a varying interval (cue-to-target SOA: 0.2∼1.1 s) from the onset of the cue (an uninformative bar near one of the two peripheral boxes), a target (a circle or a square) occurred within either the cued box (valid) or the uncued box (invalid). Subjects were requested to determine the target shape, and the RT was recorded. To achieve a more prominent effect of cue resetting, the number of trials for SOA of 0.2 s was 10 times of that for other SOAs. B, RT time courses (normalized within-subject across all trials) as a function of cue-to-target SOA (N = 49). Grand average unfiltered RT time courses (top, mean ± SEM) and 0–2 Hz low-pass filtered RT time courses (bottom, mean ± SEM), for valid (red) and invalid (black) conditions.
- Figure 2.
Time-frequency power profile for RT time courses as a function of cue-to-target SOA (0.2–1.1 s) and frequency (0–25 Hz). A, Left, Grand average time-frequency plots (n = 49) for valid–invalid power difference when target was presented on LVF (upper) or RVF (lower). Right, Valid–invalid power difference time-frequency plots thresholded by permutation test. *Uncorrected p < 0.05 (within-frequency multiple-comparison correction). **p < 0.05 (within-frequency multiple-comparison correction). ***p < 0.05 (across-frequency multiple-comparison correction). Red represents positive valid–invalid power difference values; blue represents negative difference. B, Grand average time-frequency power (n = 49) for valid (top) and invalid condition (bottom), when target was presented on LVF (left) or RVF (right).
- Figure 3.
Time-frequency power profile and spectrum for detrended RT time courses. A, Grand average RT time course (n = 49) as a function of cue-to-target SOA before (upper) and after detrending (lower). The detrended RT time course (bottom) showed a rather flat fluctuating pattern lacking classical attentional and expectancy effects. B, Grand average time-frequency plots (n = 49) for valid–invalid power difference for the detrended RT time courses, when target was presented in LVF (upper) or RVF (lower). The detrended RTs showed a similar valid–invalid power difference profile as in Figure 2A. C, Grand average spectrum (n = 49) for RT time courses before (black) and after detrending (red). After detrending, the RT time courses manifested decreased power mainly in low frequencies.
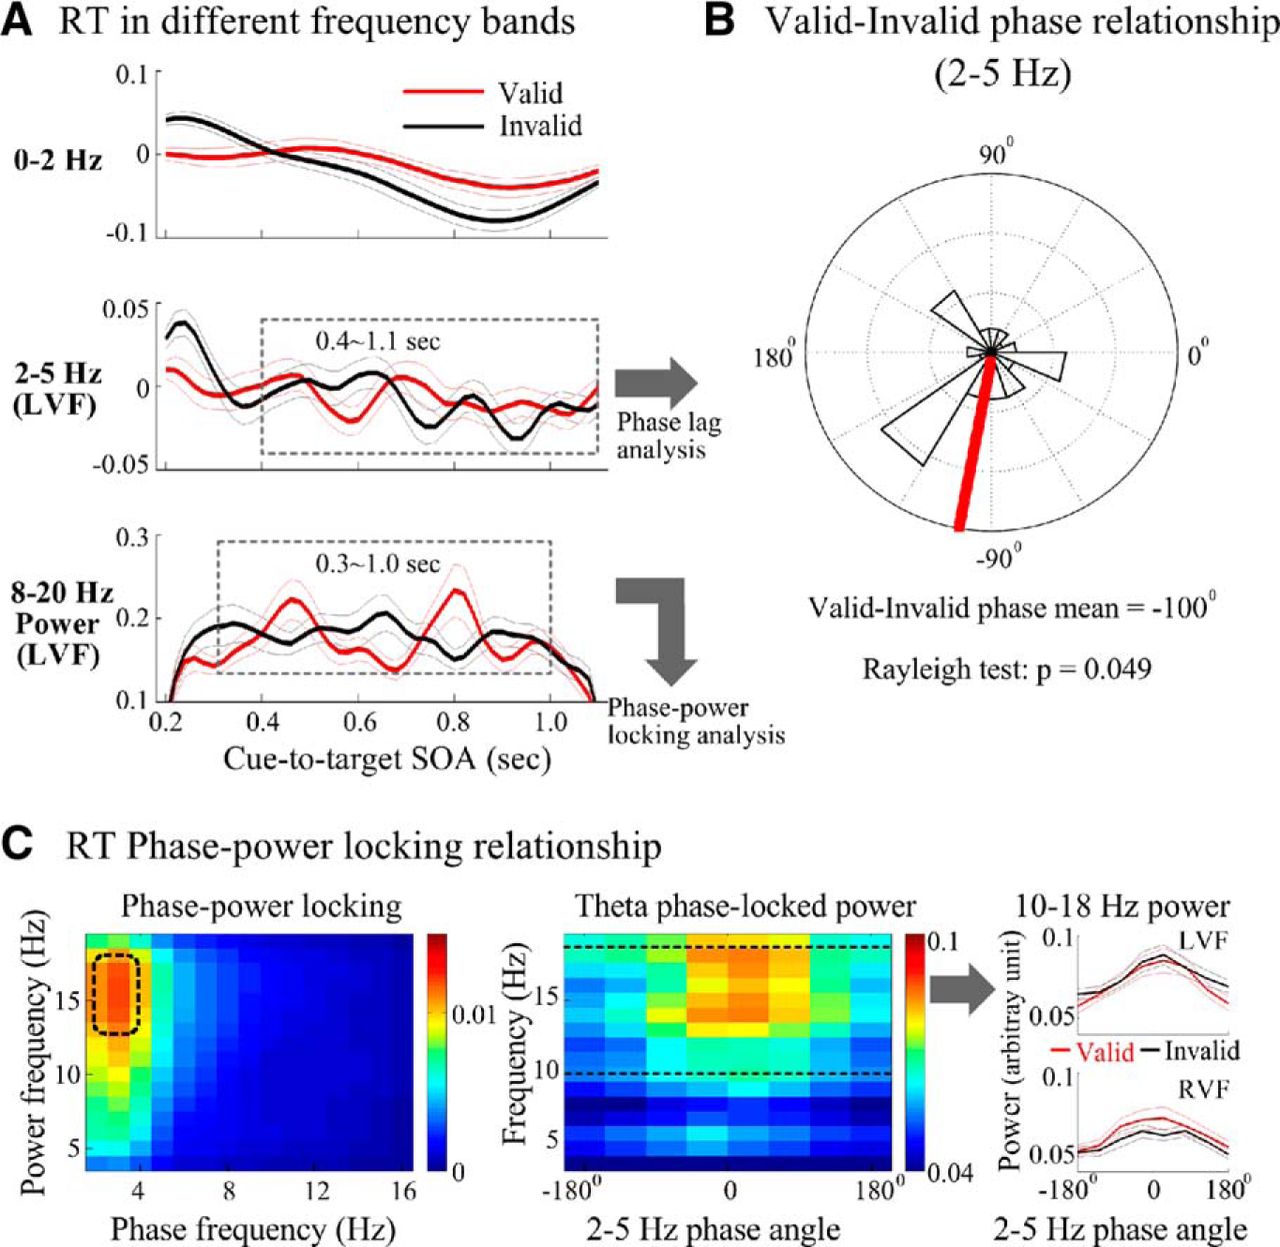
- Figure 4.
θ-band phase lag and α-θ power-phase coupling in RT time courses. A, Top, The 0–2 Hz filtered RT time courses as a function of cue-to-target SOA for valid (red) and invalid (black) conditions. Middle, θ-band (2–5 Hz) filtered RT time courses in LVF, with dotted box indicating the time range (0.4–1.1 s) for further phase lag analysis. Bottom, Power response for α-band (8–20 Hz) filtered RT time courses in LVF, with dotted box indicating the time range (0.3–1.0 s) for further phase-power locking analysis. B, Polar plots for the distribution (n = 49) of θ-band (2–5 Hz) phase lag between valid and invalid conditions in the RT time courses in LVF during the time range (A, middle, dotted box, 0.4–1.1 s). Red line indicates the mean valid–invalid θ phase difference. C, Phase-power locking in RT time course during the time range (A, bottom, dotted box, 0.3–1.0 s). Left, Grand mean cross-frequency phase-power locking (n = 49). Middle, Grand mean power response (n = 49) as a function of frequency (4–20 Hz) and θ-band phase (−180° to 180°). Dotted line indicates the upper and lower boundary for α-band range (8–20 Hz). Right, Grand mean (n = 49, mean ± SEM) α-band power (8–20 Hz, range between two dotted lines in left panel) as a function of θ-band (2–5 Hz) phase (−180° to 180°) for valid (red) and invalid (black) conditions, when target was presented in LVF (upper) or RVF (lower).


