

Article Figures & Data
Figures
- Figure 1.
Experiment 1. A, Trial timing and display setup. Inset 1, All possible saccade directions (indicated by arrows) and distractor locations (filled dark blue circles). Inset 2, Distractor location relative to saccade target. Example saccade direction is indicated by an arrow; cw, clockwise distractor location; ccw, counterclockwise. B, Horizontal saccade trajectory curvature as a function of distractor offset time relative to horizontal saccade onset. Shaded area indicates SEM. Sacc H, Horizontal saccade onset time C, Vertical saccade trajectory curvature as a function of distractor offset time relative to the vertical saccade onset. Sacc V, Vertical saccade onset time; Sacc H, horizontal saccade onset time in the double saccade task. D, Vertical saccade trajectories in the single saccade task. Filled circles represent relative distractor location (green, counterclockwise; violet, clockwise). Distractor offset time was 300–200 ms before the vertical saccade onset. Shaded areas indicate SEM. E, Vertical saccade trajectories in the double saccade task. Distractor offset time was 100–0 ms before the horizontal saccade onset (∼300–200 ms before the vertical saccade onset). Inset 1, Distractor locations before saccade sequence. Arrows indicate saccade sequence; star, eye position at the time of distractor presentation. Inset 2, Retinotopic distractor locations after the horizontal saccade. Curved lines indicate predicted trajectory curvature away from the retinotopic distractor location. Inset 3, Spatiotopic distractor locations and predicted spatiotopic saccade trajectory curvature. F, Spatiotopic saccade curvature for short and long intersaccadic interval duration. ns, Nonsignificant t test comparison between the two conditions.
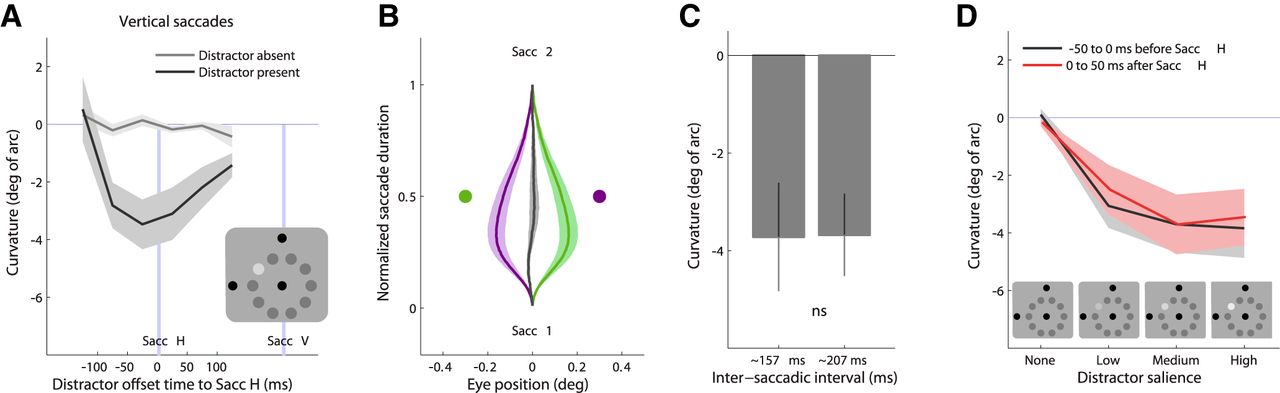
- Figure 2.
Results of Experiment 2. A, Vertical saccade trajectory curvature as a function of distractor offset time before vertical saccade onset and onset time after vertical saccade offset. Sacc V, Vertical saccade onset time; Sacc H, horizontal saccade onset time. Shaded areas indicate SEM. Example display setup is shown in the inset. B, Vertical saccade trajectories distractor (green, violet) and no-distractor trials (gray). Distractor offset time was 50–0 ms before the horizontal saccade onset. C, Spatiotopic saccade curvature for short and long intersaccadic interval duration. ns, Nonsignificant t test comparison between the two conditions. D, Saccade curvature for distractors presented before horizontal saccade onset and after horizontal saccade offset as a function of distractor salience level. Shaded areas indicate SEM.

Tables
Condition Horizontal saccade Vertical saccade Latency (ms) Duration (ms) Amplitude (°) Latency (ms) Duration (ms) Amplitude (°) Experiment 1 Single saccade 179 ± 8 46 ± 1 6.6 ± 0.1 212 ± 8 52 ± 2 6.8 ± 0.1 Double saccade 171 ± 7 45 ± 2 6.5 ± 0.1 217 ± 18 51 ± 2 6.8 ± 0.1 Experiment 2 Distractor present 186 ± 8 43 ± 3 6.6 ± 0.1 252 ± 15 48 ± 3 6.4 ± 0.2 Distractor absent 185 ± 8 43 ± 2 6.6 ± 0.1 241 ± 13 49 ± 3 6.4 ± 0.2


