

Article Figures & Data
Figures
- Figure 1.
Confocal microscopy reveals putative TC contacts. A, Expression of synaptophysin-EGFP in VPM after AAV injection. B, C, Two excitatory neurons in L4 of somatosensory cortex juxtasomally filled with biocytin visualized under epifluorescence microscopy. Red, Biocytin-filled cells labeled with Alexa Fluor 594-conjugated streptavidin; green, synaptophysin-EGFP. C, Higher-magnification view of the region outlined in B. D, z projection of dendritic segment after confocal imaging and deconvolution demonstrates adequate x and y resolution to distinguish spine heads and spine necks. E, y projection of the same image stack illustrating z resolution. F, y projection of same image stack before deconvolution. G–J, Examples of a subset of spines apposed to markers for presynaptic vesicle pools in TC boutons. Green in G–I, synaptophysin-EGFP; in J, anti-VGluT2.
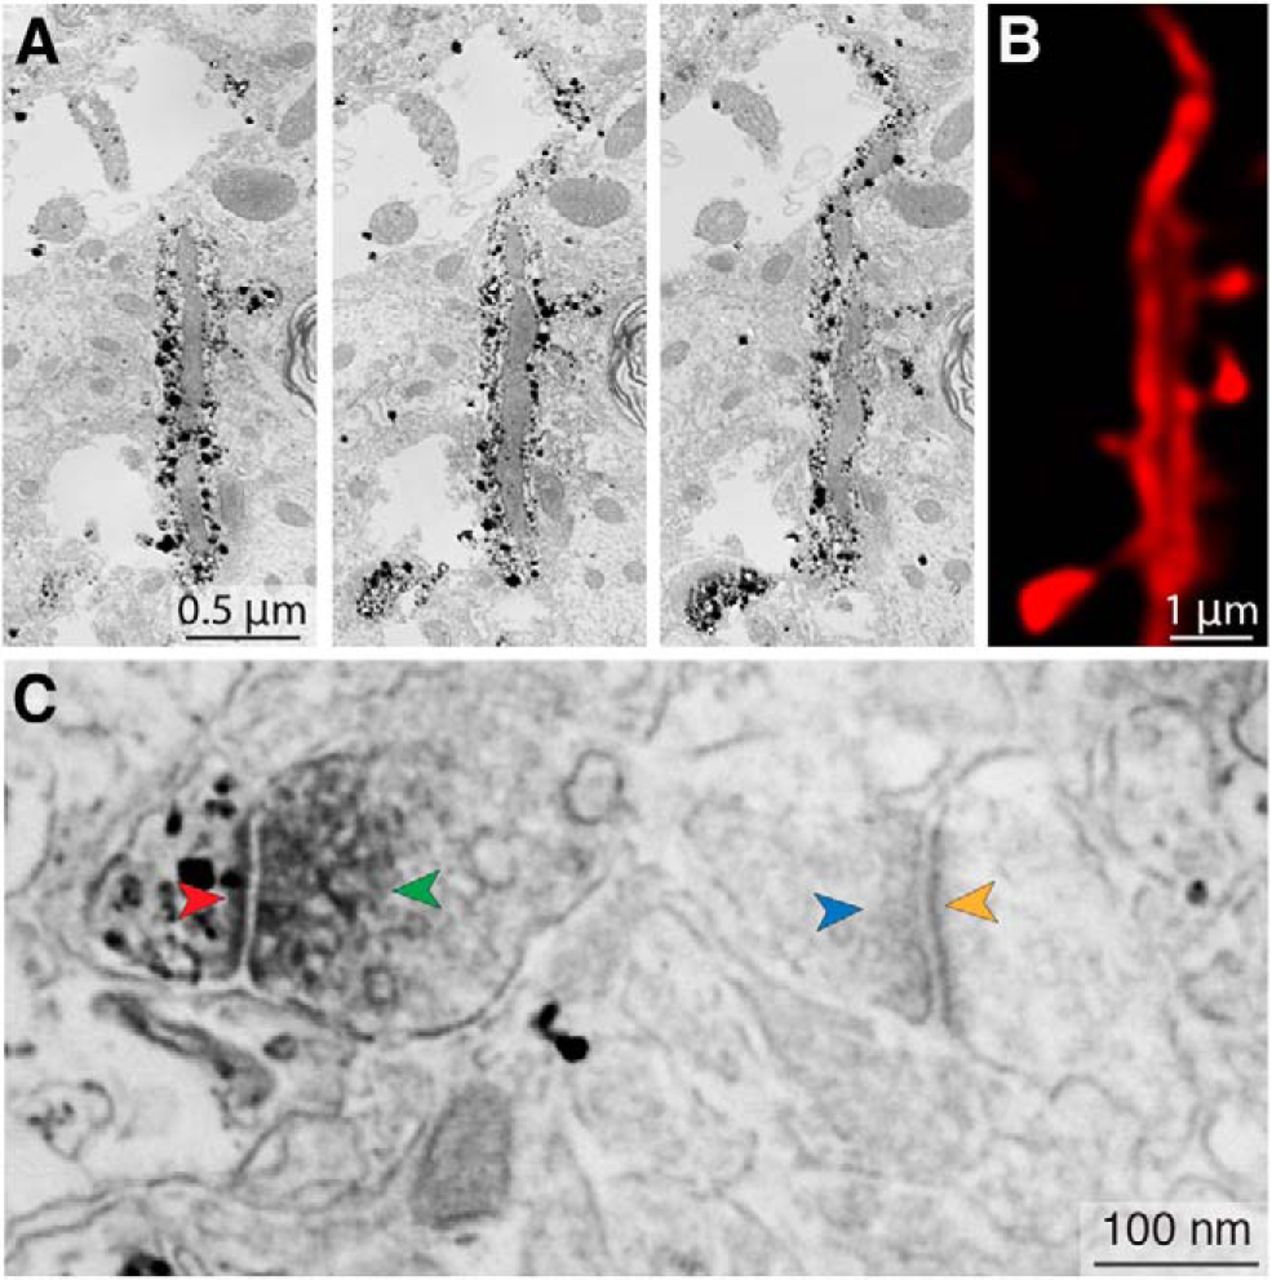
- Figure 2.
Dendrite labeling in LM and EM. A, SEM photomicrographs of three consecutive 70 nm ultrathin sections obtained at low magnification (12 nm/pixel) reveal punctate staining of the dendrite labeled with an Alexa Fluor-Nanogold-streptavidin triple-conjugate. The dendrite shaft, spine heads, and spine necks are clearly labeled, but a large mitochondrion remains unlabeled, implying that biotin did not penetrate this organelle during the neuron's filling. B, Single LM plane (equal in thickness to several consecutive ultrathin sections) that corresponds approximately to the same area of dendrite shown in A. Deconvolution permits distinction between the dendrite's biotin-filled cytoplasm and its unfilled mitochondrion. This photomicrograph is an x, y, z cropping of the dendrite shown in Figure 3A. C, High-magnification (2 nm/pixel) SEM photomicrograph showing a peroxidase-labeled VGluT2+ vesicle pool (green arrowhead, dark gray diffuse stain) apposed to a silver-enhanced Nanogold-labeled spine (black punctate stain) containing a PSD (red arrowhead); this contrasts with an unlabeled VGluT2− vesicle pool (blue arrowhead) apposed to an unlabeled spine containing a PSD (yellow arrowhead). This photomicrograph shows a larger field of view surrounding the spine/vesicle pool shown in Figure 3F.
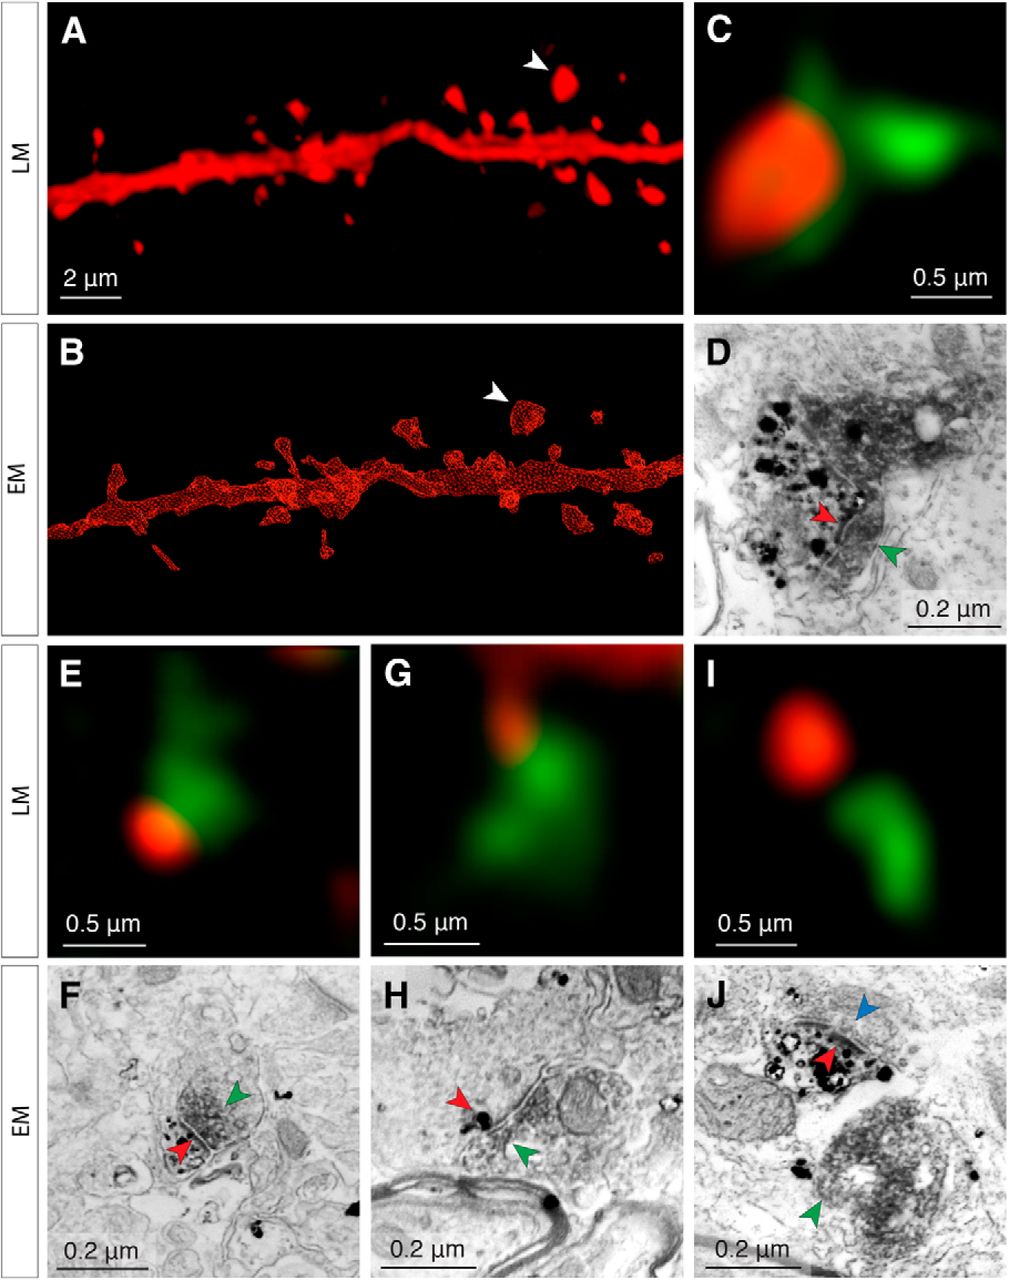
- Figure 3.
Reliable detection of putative TC contacts at the light level. The same spines are examined both in confocal microscopy stacks (A) and in subsequent reconstructions of 70 nm serial sections imaged by SEM (B). C–D, Example of a true positive (confirmed TC contact), the spine of which is indicated by the white arrowheads in A and B. Under confocal microscopy (C), the spine (red fluorescence) apposes a VGluT2+ vesicle pool (green fluorescence). The corresponding ultrastructure (D) reveals the spine (black punctate stain) with its PSD (red arrowheads) apposed to a VGluT2+ vesicle pool (dark gray diffuse stain, green arrowheads). E–J, Examples of a true positive, false positive and true negative from different areas of the same dendrite shown in A and B. E, F, True positive, legend same as for C and D. G, H, False positive. The 70 nm section (H) in which the labeled spine (black punctate stain, red arrowhead) is closest to the VGluT2+ vesicle pool (green arrowhead) does not contain a PSD and no synapse is formed between both labeled structures. The labeled spine's PSD is located in a different section and does not contact the VGluT2+ vesicle pool. Note that this ultrathin section contains only a small, terminal portion of the spine. I, J, True negative. Nearby, but nonapposed presynaptic and postsynaptic structures visualized under confocal microscopy (green, red fluorescence in I) are separated by ∼50 nm. This spine fails to satisfy the criteria for putative TC contacts; examination under SEM confirms that this is not a synapse (green arrowhead in J corresponds to the VGluT2+ vesicle pool in green fluorescence in I). The labeled spine head (black punctate stain, red arrowhead indicates PSD) forms a synapse with a separate terminal containing a VGluT2− vesicle pool (blue arrowhead).
- Figure 4.
Complete synaptic distribution of an L4 spiny stellate neuron. Shown is a high-resolution 3D reconstruction of a spiny stellate neuron illustrating individual spines apposed to synaptophysin-EGFP signal, denoted as TC (filled green circles) and unapposed spines assumed to be CC (empty red circles). This cell corresponds to cell 3 in Figure 6A.
- Figure 5.
Locations of somata and dendritic arbors relative to barrel borders. The six fully reconstructed cells are depicted relative to their barrel's borders. Black, barrel borders; red, somata; gray, dendritic arbors. Cell 1, the soma of which was located in the septum, is represented alongside its neighboring barrels. Note that cell 4 and cell 5 were located in the same barrel.
- Figure 6.
TC contacts are slightly more proximal to the soma than CC contacts. A, Between 6% and 15% of contacts are TC in fully reconstructed dendritic arbors (stacked histogram: green, TC; red, CC; number, fraction of total spines that are TC; star, star pyramid, all others are spiny stellate; S, septal neuron, all others are barrel). B, Top, TC (green) and CC (red) spine density for one cell (cell 3, shown in Fig. 4). Bottom, Ratio of TC to CC spines declines as a function of distance from the cell soma. C, Average of all fully reconstructed cells. Error bars indicate SE. D, Spines in cell 6 were classified as mushroom (left), stubby (middle), or filopodium (right); diagram is denoted on the x-axis. The fraction of TC contacts was approximately equal across all three classes of spines (legend same as in A).
- Figure 7.
Clustering of TC synapses along the dendrites of an L4 star pyramid neuron. A, Volumetric reconstruction of a barrel neuron recorded and filled intracellularly (cell 6). B, Cumulative density of the distances between putative TC synapses in cell 6 (green) and mean of 5000 Monte Carlo simulations of TC synapses randomly placed along the dendrites using the measured somatic proximity function (black). C, Actual median spacing of TC synapses for this cell (line) compared with the distribution of the medians obtained by simulation (histogram).
- Figure 8.
Compartmental model predicts that relative TC proximity to the soma does not render this class of inputs stronger. A, Top, TC (green) and CC (red) spine density for cell 6 (shown in Fig. 7A). Bottom, Ratio of TC to CC spines declines as a function of distance from the cell soma. B, Voltage responses of actual cell (black) to somatic injection of pink noise current and the fitted model (blue) to the same current injection. A compartmental model based on the volumetric morphology (shown in Fig. 7A) and the voltage response were used to constrain the fit of three biophysical parameters (axial resistance, specific conductance, and specific capacitance). C, Percent change in mean squared error (MSE) of the model's fit when varying the specific membrane conductance and capacitance (g and Cm, respectively) in four short, distal terminal dendrite segments of the cell's 48 segments. D, Individual EPSP peaks measured at the soma resulting from a synaptic conductance injected into the compartmental model at the 4154 CC and 743 TC spine locations (green and red, respectively). E, Distributions of simulated somatic EPSP peaks for the two classes of inputs shown in D.
- Figure 9.
Electrical stimulation permits selective thalamic or cortical fiber activation. A, Thalamocortical sections of barrel cortex 3 weeks after injection of VPM with AAV expressing ChR2-mCherry. An electrolytic lesion (white cross) indicates the site of electrical stimulation. WM, White matter. B, Photoactivation of VPM terminals results in a pronounced negative field potential in L4. Black trace, Average of 50 trials without photoactivation; blue trace, average of 46 trials with photoactivation. Low-intensity electrical stimulation of the white matter (black arrowhead) follows 50 ms after a laser light pulse (blue arrowhead) and produces a comparatively weak fEPSP. Electrical stimulation artifacts are cropped for clarity. C, D, Average fEPSP (n = 40–48 trials per trace) in L4 evoked by electrical shock 50 ms after photoactivation of ChR2+ VPM presynaptic fibers (blue trace). Black trace, No prior photoactivation; black arrowhead, electrical shock onset. Insert, Configuration of the recording and stimulation electrodes in a coronal view of S1; ChR2+ fibers are indicated in blue. C, Electrical shock of white matter produces a fEPSP that is conditioned by prior (50 ms) photoactivation of VPM fibers (black vs blue traces). D, In the same animal, electrical shock of cortex L2/3 is not conditioned by prior photoactivation of VPM fibers. E, Percent change in fEPSP peak magnitude after photoactivation of VPM fibers. Left, Electrical shock in white matter; right, electrical shock in cortex L2/3 (magnitudes normalized to control amplitude); ctl, control condition (black traces in C, D); light, after photoactivation (blue traces in C, D). **p < 0.01, n.s. not significant; gray lines indicate individual animals; black lines indicate means.
- Figure 10.
Unitary TC and CC inputs are equally potent when measured in vivo. A, Somatic voltage recorded during 7 trials of a L4 spiny stellate neuron in response to a 2.55 V stimulus delivered to the white matter under the neuron's barrel column in an adult rat. The stimulus results in successful synaptic transmission 50% of the time. B, As the intensity of the stimulus is increased from 2 to 2.55 V (left), trials generated progressively more successes with relatively constant EPSP amplitude. Stimulus intensity was randomized during acquisition, but ordered in this plot for clarity. Zero (0) indicates no stimulus; arrowhead indicates the stimulus intensity used to obtain the traces shown in A. Histogram of the EPSP peak amplitude shows a bimodal distribution (right); black line indicates a fit using a double Gaussian function (μ1 = 0.004 mV, σ1 = 0.047 mV, μ2 = 1.00 mV, σ2 = 0.198 mV). C, D, Same as for A and B, but in a young animal, stimulating in L2/3. μ1 = 0.087 mV, σ1 = 0.102 mV, μ2 = 1.383 mV, σ2 = 0.091 mV. E, Paired pulses in white matter (20 Hz) reveal pronounced short-term depression (mean of 60 trials). F, Peak amplitudes of EPSPs evoked by paired pulses reveal dual successes of synaptic transmission (top right quadrant), dual failures (bottom left quadrant), a preponderance of successes on the first stimulus only (top left quadrant), or a minority of successes on the second stimulus only (top right quadrant). Black line indicates identity. G, EPSP2/EPSP1 ratio for paired pulses at 20 Hz (large circles: 10 Hz) recorded in adult (black) and juvenile (gray) rats. H, Summary of the unitary EPSP amplitudes recorded in adult (black) and juvenile (gray) rats. Lines indicate the means.


