

Abstract
Weight loss is a prominent early feature of Alzheimer's disease (AD) that often precedes the cognitive decline and clinical diagnosis. While the exact pathogenesis of AD remains unclear, accumulation of amyloid-β (Aβ) derived from the amyloid precursor protein (APP) in the brain is thought to lead to the neuronal dysfunction and death underlying the dementia. In this study, we examined whether transgenic mice overexpressing the Swedish mutation of APP (Tg2576), recapitulating selected features of AD, have hypothalamic leptin signaling dysfunction leading to early body weight deficits. We found that 3-month-old Tg2576 mice, before amyloid plaque formation, exhibit decreased weight with markedly decreased adiposity, low plasma leptin levels, and increased energy expenditure without alterations in feeding behavior. The expression of the orexigenic neuropeptide Y (NPY) in the hypothalamus to the low leptin state was abnormal at basal and fasting conditions. In addition, arcuate NPY neurons exhibited abnormal electrophysiological responses to leptin in Tg2576 hypothalamic slices or wild-type slices treated with Aβ. Finally, the metabolic deficits worsened as Tg2576 mice aged and amyloid burden increased in the brain. These results indicate that excess Aβ can potentially disrupt hypothalamic arcuate NPY neurons leading to weight loss and a pathologically low leptin state early in the disease process that progressively worsens as the amyloid burden increases. Collectively, these findings suggest that weight loss is an intrinsic pathological feature of Aβ accumulation and identify hypothalamic leptin signaling as a previously unrecognized pathogenic site of action for Aβ.
Introduction
Alzheimer's disease (AD) is pathologically characterized by amyloid plaques, composed of amyloid-β (Aβ) peptides, and by neurofibrillary tangles, composed of hyperphosphorylated tau (Querfurth and LaFerla, 2010). Accumulation over time of Aβ1–40 and Aβ1–42 derived from the amyloid precursor protein (APP) in the brain is thought to lead to the neuronal dysfunction and death underlying the dementia. Increasing evidence suggests that AD begins several years before the cognitive decline (Bateman et al., 2012), stressing the need to intervene earlier in AD, before significant damage occurs (Sperling et al., 2011). Therefore, it has become increasingly important to gain better insights into the pathological processes occurring at the earliest stages of AD.
Body weight loss is a prominent clinical feature of AD, correlating with disease severity and increased mortality (White et al., 1998). Dementia causing alterations in feeding behavior could potentially explain weight loss during late stages of AD. However, several studies have reported that one of the earliest manifestations in preclinical AD is accelerated early weight loss (Barrett-Connor et al., 1996; Buchman et al., 2005; Stewart et al., 2005; Johnson et al., 2006). Increased burden of AD biomarkers, such as CSF Aβ1–42 levels in cognitively normal individuals, were also associated with weight loss, thereby linking Aβ pathology to weight loss in preclinical AD (Vidoni et al., 2011). Thus, weight loss likely represents an intrinsic feature of AD that arises early in the disease process.
The exact mechanisms underlying the weight loss in preclinical AD are unknown, but early Aβ accumulation could conceivably disrupt brain circuits regulating body weight. Leptin is an adipocyte-derived hormone that acts as the negative afferent loop in the regulation of body weight mainly through hypothalamic pathways (Zhang et al., 1994; Gautron and Elmquist, 2011). Leptin receptors are also expressed in the cortex and hippocampus and have been implicated in learning and memory (Harvey, 2013). Epidemiological studies have also shown a correlation between low plasma leptin levels and increased risk of developing AD or age-related cognitive decline (Power et al., 2001; Holden et al., 2009; Lieb et al., 2009; Johnston et al., 2014). Furthermore, studies in transgenic mice overexpressing APP have shown that exogenous leptin reduces, whereas leptin deficiency exacerbates amyloid pathology in these mice (Greco et al., 2010; Takeda et al., 2010). These observations, collectively, raise the possibility that altered leptin signaling plays an early role in AD, but the cellular and molecular bases for this effect remain to be established.
In this study, we tested the hypothesis that excess Aβ causes hypothalamic leptin signaling dysfunction resulting in early weight loss. Using a transgenic mouse model overexpressing the Swedish APP mutation (Tg2576), we found that there is body weight and metabolic deficits before amyloid plaque formation, an effect associated with low plasma leptin and marked dysfunction in leptin-responsive hypothalamic arcuate neuropeptide Y (NPY) neurons. Our findings suggest that APP overexpression and/or Aβ accumulation causes early alterations in leptin-responsive hypothalamic neurons involved in regulating body weight and provide a potential mechanism for the weight loss associated with preclinical AD.
Materials and Methods
Animals.
All procedures were approved by the Institutional Animal Care and Use Committee of Weill Cornell Medical College and Rockefeller University. Experiments were performed in APPswe transgenic (Tg2576) mice with the transgene human APP695 containing the Swedish double mutation K670N, M671L driven by a hamster prion protein promoter (RRID:MGI_MGI:3710766) (Hsiao et al., 1996). All Tg2576 mice were derived from an in-house colony maintained on the original hybrid C57BL/6J-SJL line. Sex- and age-matched wild-type (WT) littermate mice were used as controls for all experiments. All mice were housed in climate controlled 12 h light-dark cycle rooms and had free access to water and standard rodent chow (LabDiet, catalog #5053) unless otherwise specified. After weaning, female Tg2576 mice were group-housed, but male mice were individually caged because of aggressive behavior. For NPY-GFP mice, we used the previously well-characterized BAC transgenic NPY-hrGFP mice line (B6.FVB-Tg(NPY-hrGFP)1Lowl/J, The Jackson Laboratory, catalog #006417, RRID:IMSR_JAX:006417) (van den Pol et al., 2009). To generate Tg2576 mice with GFP labeling in NPY neurons, we crossed male Tg2576 mice with female NPY-GFP mice to produce hemizygous NPY-GFP mice with or without a copy of the APPswe transgene.
Blood/plasma and tissue analysis in Tg2576 mice.
For tissue and plasma analysis, all mice were killed by CO2 asphyxiation between 11 AM and 1 PM or 4–6 h after lights on. Blood was obtained by transcardiac puncture with an EDTA-treated needle and measured immediately for glucose levels with a commercial glucometer (AgaMatrix). Plasma was obtained from the blood samples by centrifugation of the EDTA-treated blood and then stored at −20°C in aliquots to avoid freeze-thaw. Plasma leptin and insulin levels were measured using commercially available ELISA kits (R&D Systems catalog #MOB00 and ALPCO Diagnostics catalog #80-INSMSU-E01, respectively). After the blood was removed from each mouse, the brain was immediately removed and submerged into ice-cold PBS. The hypothalamus was then carefully dissected, snap-frozen in liquid nitrogen, and stored at −80°C until use. For brain Aβ1–42 measurements, SDS-soluble Aβ1–42 were measured in hemisected brains of Tg2576 mice at various ages (n = 2 or 3 per group) by ELISA as previously described (Park et al., 2008).
Food intake and fasting studies.
Adult mice were individually housed and acclimated for over a week before food intake measurements (n = 9–12 per group). Each day of the experiment, standard rodent chow (#5053, LabDiet) was carefully measured and checked for food spillage to obtain a daily food intake per animal. The average food intake over seven consecutive days was calculated and recorded for each animal. For fasting studies, all mice were group-housed. Food was removed from the cages at 10 AM for the next 48 h. Water was freely available; otherwise, cage conditions were identical to normal “fed” conditions. Mice were weighed daily and checked for overt signs of distress or health problems throughout the fasting period. None of the mice showed evidence of any significant health problems during the fast. All mice were killed 48 h after the fast was started.
Metabolic rate analysis.
Metabolic rate was measured using a commercial indirect calorimeter system with metabolic cages (Oxymax system, Columbus Instruments) as previously described (Ishii et al., 2003). All mice (n = 5 per group) were acclimated for at least 2 d in the metabolic cages before recording and had free access to food and water. O2 levels from each cage were continually recorded at 8 min intervals and compared with the reference room air. Resting O2 consumption was defined as all measurements when no locomotor activity (beam breaks) was detected in the metabolic cage.
Body composition analysis.
All mice (n = 5 or 6 per group) were anesthetized with 2%–3% isoflurane for induction and 1%–2% for maintenance and carefully immobilized on a 7.0 Tesla 70/30 MRI small animal scanner (Bruker). A T1-Weighted Rapid Acquisition with Refocused Echoes (RARE) sequence was acquired with repetition (TR) and echo (TE) times of 1975 and 10 ms, respectively. This yielded a total of 60 slices with an isotropic voxel resolution of 0.4 mm × 0.4 mm × 0.4 mm and 4 averages. Whole-body MR spectroscopy was acquired using a single pulse sequence with a 25,000 Hz sweep width, 2048 points, 32 averages, and a 5000 ms repetition time. Data were read into the in-house written XSOS Spectroscopy Analysis Package (D. Shungu and X. Mao) for analysis. Spectra were Fourier transformed, phased, and a baseline correction performed. Peak areas of both water and lipid were integrated within fixed frequency windows as previously described (Mystkowski et al., 2000). The resulting peak area of water and lipid was used to calculate the whole-body lipid and water fractions. Per previously validated MR spectra analysis for body composition in mice (Mystkowski et al., 2000), lean mass was calculated according to the equation, lean mass = 0.38 × peak area of water. Because total mass = total fat mass + total water mass + total lean mass, percent fat was calculated by %fat = 100 × peak area lipid/(peak area water + peak area lipid + 0.38 × peak area of water). Total fat mass was calculated by multiplying percent fat by the body weight at the time of MR analysis. Lean and water (total and percent) masses for each mouse were calculated in a similar fashion.
Quantitative PCR.
Quantitative PCR was conducted as previously described (Jackman et al., 2013). Briefly, total RNA was extracted from the tissue by Trizol reagent (Invitrogen) and dissolved in DEPC-treated nuclease free water. A total of 1 μg of total RNA was reverse-transcribed to cDNA using oligo dT primers (Thermo Scientific). Quantitative determination of gene expression was performed on a Chromo 4 detector (Peltier thermal cycler, MJ Research) using a two-step cycling protocol. Primers are listed in Table 1. A total of 3 μl of diluted cDNA (1:10) was amplified by Maxima SYBR green qPCR supermix UDG (Thermo Scientific). The reactions were incubated at 50°C for 2 min and then 95°C for 10 min. A PCR cycling protocol consisting of 15 s at 95°C and 1 min at 60°C for 45 cycles was required for quantification. Relative expression levels were calculated by the ΔΔCT method (Livak and Schmittgen, 2001). Quantities of all targets in test samples were normalized to the mouse housekeeping hypoxanthine-guanine phophoribosyltransferase gene, and values were correlated to WT samples or WT fed samples for fasting studies as appropriate.
PCR primers used in the studya
Immunohistochemistry.
Mice were deeply anesthetized with sodium pentobarbital and transcardially perfused with 0.1 m phosphate buffer (PB) followed by fresh ice-cold 4% PFA. Brains were removed and postfixed in same fixative overnight at 4°C. The 40 μm coronal brain sections were cut using a Leica VT1000s vibratome (Leica Microsystems) and stored in storage solution (30% sucrose and 30% ethylene glycol in 0.1 m PB) at −20°C until analysis. For immunohistochemistry studies (n = 2–3 per group), free-floating brain sections were removed from storage solution, washed in PBS, incubated in 70% formic acid at room temperature for 15 min, washed in PBS, and then treated with H2O2 to quench endogenous peroxidase activity. Sections were then washed in PBS and blocked in M.O.M. blocking reagent (Vector, catalog #PK-2200) diluted in 0.3% Triton X-100 in PBS at room temperature for 1 h, followed by incubation in mouse monoclonal Aβ 4G8 antibody (1:2000, Covance, catalog #SIG-39220-200, RRID:AB_10174824) overnight at 4°C with gentle shaking. Sections were washed and then incubated in donkey biotinylated anti-mouse secondary antibody (1:400, Jackson ImmunoResearch Laboratories, catalog #715-065-150) at room temperature for 1 h, washed, incubated in ABC (Vector, catalog #PK-2200) for 30 min, washed, and then developed with DAB (Sigma-Aldrich) for 6 min. Stained sections were mounted on gelatin coated slides, dried, and dehydrated with increasing concentration of ethanol then xylene, and finally coverslipped with DPX mounting reagent (Sigma-Aldrich) before visualization under a light microscope (Eclipse e200, Nikon) equipped with a digital camera (Optixcam Summit, Microscope Store).
Preparation of hypothalamic slices and whole-cell patch-clamp studies.
Three- to 5-week-old NPY-GFP hemizygous mice with or without a copy of the APPswe transgene were used in all electrophysiology experiments (n = 4–9 per group). The mice were anesthetized with 2% isoflurane, and their brains were rapidly removed and immersed into ice-cold sucrose (s)-ACSF composed of (in mm) the following: 248 sucrose, 26 NaHCO3, 1 NaH2PO4, 3 KCl, 5 MgSO4, 0.5 CaCl2, 10 glucose, gassed with 95% O2 and 5% CO2, pH 7.3. Coronal slices (200 μm thickness) containing the hypothalamic arcuate nuclei were cut using a Leica VT1000s vibratome (Leica Microsystems) and stored in a self-designed chamber containing lactic acid (l)-ACSF composed of (in mm) the following: 124 NaCl, 26 NaHCO3, 5 KCl, 1 NaH2PO4, 2 MgSO4, 2 CaCl2, 10 glucose, 4.5 lactic acid, gassed with 95% O2 and 5% CO2 and pH 7.4, at 32°C for 1 h. After 1–2 h recovery, the hypothalamic slice was transferred to a glass-bottom recording chamber (P-27; Warner Instrument) mounted on an E600 epifluorescence microscope (Nikon). The slices were continuously perfused with the oxygenated l-ACSF at 2 ml/min at room temperature (24°C-28°C). Under the microscope equipped with 40× water-immersion lens and the FITC filter (Chroma Technology), the arcuate nuclei were identified in the ventromedial portion near the base of the third ventricle with GFP-labeled arcuate NPY neurons in slices consistently displaying intense green fluorescence and the visualized whole-cell recordings were performed on GFP-labeled neurons (Wang et al., 2013). The patch glass electrode was pulled using borosilicate capillaries (OD 1.5 mm/ID 0.86 mm; World Precision Instruments) and P-80 micropipette puller (Sutter Instruments). The resistance of the pipette was 5–7 mΩ when filled with an intracellular solution containing (in mm) the following: 130 K-gluconate, 10 NaCl, 1.6 MgCl2, 0.1 EGTA, 10 HEPES, and 2 Mg-ATP, adjusted to pH 7.3. The current-clamp recordings were performed in GFP-positive arcuate neurons using an Axopatch 200A amplifier (filtered at 2 kHz, digitized at 10 kHz) and Digidata 1320A (Molecular Devices). After a gigaΩ seal formation, brief negative pressure was further applied to obtain the whole-cell configuration. The recording began with the membrane test for monitoring the access resistance and the membrane, which was continuously monitored through the recording. Only those cells in which access resistance was stable (change <10%) were included in data analysis. Stable baseline recordings were achieved before local application of vehicle (PBS or RPMI-1640 media buffer, Sigma-Aldrich), leptin (100 nm, Sigma-Aldrich, Cat #L3772), or octanoylated (active) ghrelin (100 nm, Phoenix Pharmaceuticals, Cat #031-31) to the bath. For Aβ experiments, stable baseline recordings were achieved then oligomeric Aβ1–42 (10, 30, and 100 nm, rPeptide, catalog #A-1002) was locally applied to the bath and allowed to incubate for 15 min before subsequent application of leptin (100 nm) or ghrelin (100 nm). The membrane potential and the frequency of spontaneous spikes were analyzed offline using a Window pClamp 8 (Molecular Devices) and MiniAnalysis (Synaptosoft), separately. The liquid junction potentials were corrected during offline analysis.
Preparation of oligomeric Aβ1–42.
Soluble oligomeric Aβ1–42 was freshly prepared from lyophilized solid human synthetic Aβ1–42 (rPeptide, catalog #A-1002) as previously described with minor modifications (Ryan et al., 2010). Briefly, lyophilized Aβ1–42 was suspended in 1,1,1,3,3,3 hexafluoro-2-propanol (Sigma-Aldrich) to 1 mm using a gas-tight syringe. The peptide solution was aliquoted and lyophilized using a Speed-Vac. Dried peptide was stored at −80°C until additional processing. Before the electrophysiology experiments, dried peptide was resuspended in anhydrous DMSO (Sigma-Aldrich), bath-sonicated for 10 min, diluted to 100 μm with PBS or RPMI-1640 media (Sigma-Aldrich), and allowed to oligomerize by incubation at 4°C for 24 h. After incubation, the peptide solution was centrifuged to remove insoluble aggregates. The supernatant containing the soluble oligomeric Aβ1–42 was removed and used for the electrophysiology experiments.
Statistics.
All data are presented as mean ± SEM and analyzed using Prism version 5 (GraphPad Software). Two-group comparisons were analyzed by the two-tailed t test. Multiple comparisons were evaluated by ANOVA followed by post hoc Tukey comparison. Differences were considered statistically significant for p values <0.05.
Results
Transgenic mice overexpressing APP have decreased adiposity and low plasma leptin before amyloid plaque formation
We used Tg2576 mice because they slowly accumulate Aβ and require several (6+) months before behavioral abnormalities and amyloid plaques develop (Hsiao et al., 1995; Kawarabayashi et al., 2001). This allowed us to study adult mice in the earliest presymptomatic stages of Aβ pathology. Consistent with previous reports (Kawarabayashi et al., 2001), Tg2576 mice had no visible plaques at 3 months of age, sporadic small plaques at 7 months of age, and widespread, markedly larger amyloid plaques by 14 months of age (Fig. 1). We next evaluated whether Tg2576 mice with elevated levels of APP and Aβ have body weight and metabolic deficits. Compared with WT mice, Tg2576 mice had a mild but significant 10%–15% decrease in body weight until 3 months of age corresponding to a time when there was no amyloid plaque formation (Fig. 2A). The body weight deficits were noted to progressively worsen as Tg2576 mice aged and the brain amyloid burden increased. The greatest body weight difference was found at ∼10 months of age when brain amyloid levels rapidly increased and amyloid plaques developed (Fig. 2A,B). Because we wanted to investigate the metabolic deficits before amyloid plaque formation, in subsequent studies, we used Tg2576 mice at 3 months of age Next, we assessed the body composition of these mice by MRI to determine whether the difference in body weight was mainly from decreases in fat or lean mass. In 3-month-old Tg2576 mice, total lean mass was slightly reduced, but there was a profound reduction in body adiposity, the total fat mass being less than half of that of WT mice (Fig. 2C–E). The decreased adiposity in 3-month-old Tg2576 mice was associated with markedly reduced plasma leptin levels, but normal glucose and insulin levels (Fig. 2F–H). Male Tg2576 mice of the same age (3 months) showed body weight deficits (WT: 26.4 ± 0.8 g; Tg2576: 23.6 ± 0.7 g, n = 12–14 per group, p = 0.03) and low plasma leptin levels (WT: 1.96 ± 0.34 ng/ml; Tg2576: 0.92 ± 0.14 ng/ml, n = 7–9 per group, p = 0.02) similar to those of female mice, suggesting that sex differences did not play a significant role in the observed metabolic deficits. Because both male and female Tg2576 mice had a similar metabolic phenotype associated with a low leptin state, subsequent studies were conducted in female mice. By using females in our studies, we could avoid single-cage housing, needed for male Tg2576 mice because of their aggressive behavior. Thus, using group-housed females minimizes confounding effects of prolonged social isolation, which can influence body weight, metabolic and neuroendocrine factors (Bartolomucci et al., 2009; Sakakibara et al., 2012).

Tg2576 mice develop amyloid plaques as the mice age. Representative immunohistochemistry staining of coronal mouse brain sections using a mouse monoclonal antibody against Aβ (4G8, 1:2000). The 3-month-old (3M) Tg2576 mice have no visible amyloid plaques. The 7-month-old (7M) Tg2576 mice have rare, sporadic amyloid plaques. The 14-month-old (14M) Tg2576 mice have widespread, markedly larger amyloid plaques. No amyloid plaques were visible throughout the brain of 14-month-old (14M) WT mice. Scale bar, all images: 100 μm.

Tg2576 mice have decreased adiposity and low plasma leptin levels before amyloid plaque formation. A, Body weight curve showing significantly lower body weights in female Tg2576 mice compared with WT mice (n = 4–10 per group). B, Increasing brain Aβ1–42 burden correlates with worsening body weight deficits (% body weight of age-matched WT littermates) in Tg2576 mice (n = 2 or 3 per group for brain amyloid measurements; n = 4–10 per age for body weight measurements). C, Representative T1-weighted MR image showing decreased adipose tissue mass (bright, hyperintense signal) in 3-month-old female Tg2576 mice compared with WT mice. D, E, Markedly decreased adiposity in 3-month-old Tg2576 mice as demonstrated by MR spectroscopy body composition analysis (n = 5 per group). F, Tg2576 mice have significantly decreased plasma leptin levels (n = 12–14 per group). G, H, Basal plasma glucose and insulin levels are comparable in Tg2576 and WT mice (n = 5–18 per group). *p < 0.05, from respective WT by ANOVA for repeated measurements (body weight) or t test for two group comparisons. **p < 0.01, from respective WT by t test for two group comparisons.
Transgenic mice overexpressing APP have increased metabolic rate but normal feeding behavior
To investigate the physiological bases of the decrease in body weight and adiposity in 3-month-old Tg2576 mice, we measured energy input by quantitating food intake and energy expenditure by indirect calorimetry using metabolic cages. Daily food intake did not differ between Tg2576 and WT mice (Fig. 3A). However, Tg2576 mice had increased energy expenditure as measured by O2 consumption throughout both the light and dark cycle (Fig. 3B), particularly at rest (Fig. 3C). Thus, the decrease in body weight and adiposity observed in Tg2576 mice is associated with increases in energy expenditure rather than alterations in feeding behavior.

Low body weight in Tg2576 mice is not caused by alterations in feeding behavior but by increased energy expenditure. A, Daily food intake in 3-month-old Tg2576 mice was the same as WT mice (n = 6 or 7 per group). B, Energy expenditure was increased in Tg2576 mice throughout the light and dark cycle as measured by increased oxygen consumption (VO2) in an indirect calorimetry system (Oxymax, Columbus Instruments) (n = 5 per group). C, Resting metabolic rate, as measured by VO2 when the mice were not moving, was significantly increased in Tg2576 mice (n = 5 per group). **p < 0.01, from respective WT mice by t test.
Transgenic mice overexpressing APP have abnormal hypothalamic responses to low plasma leptin
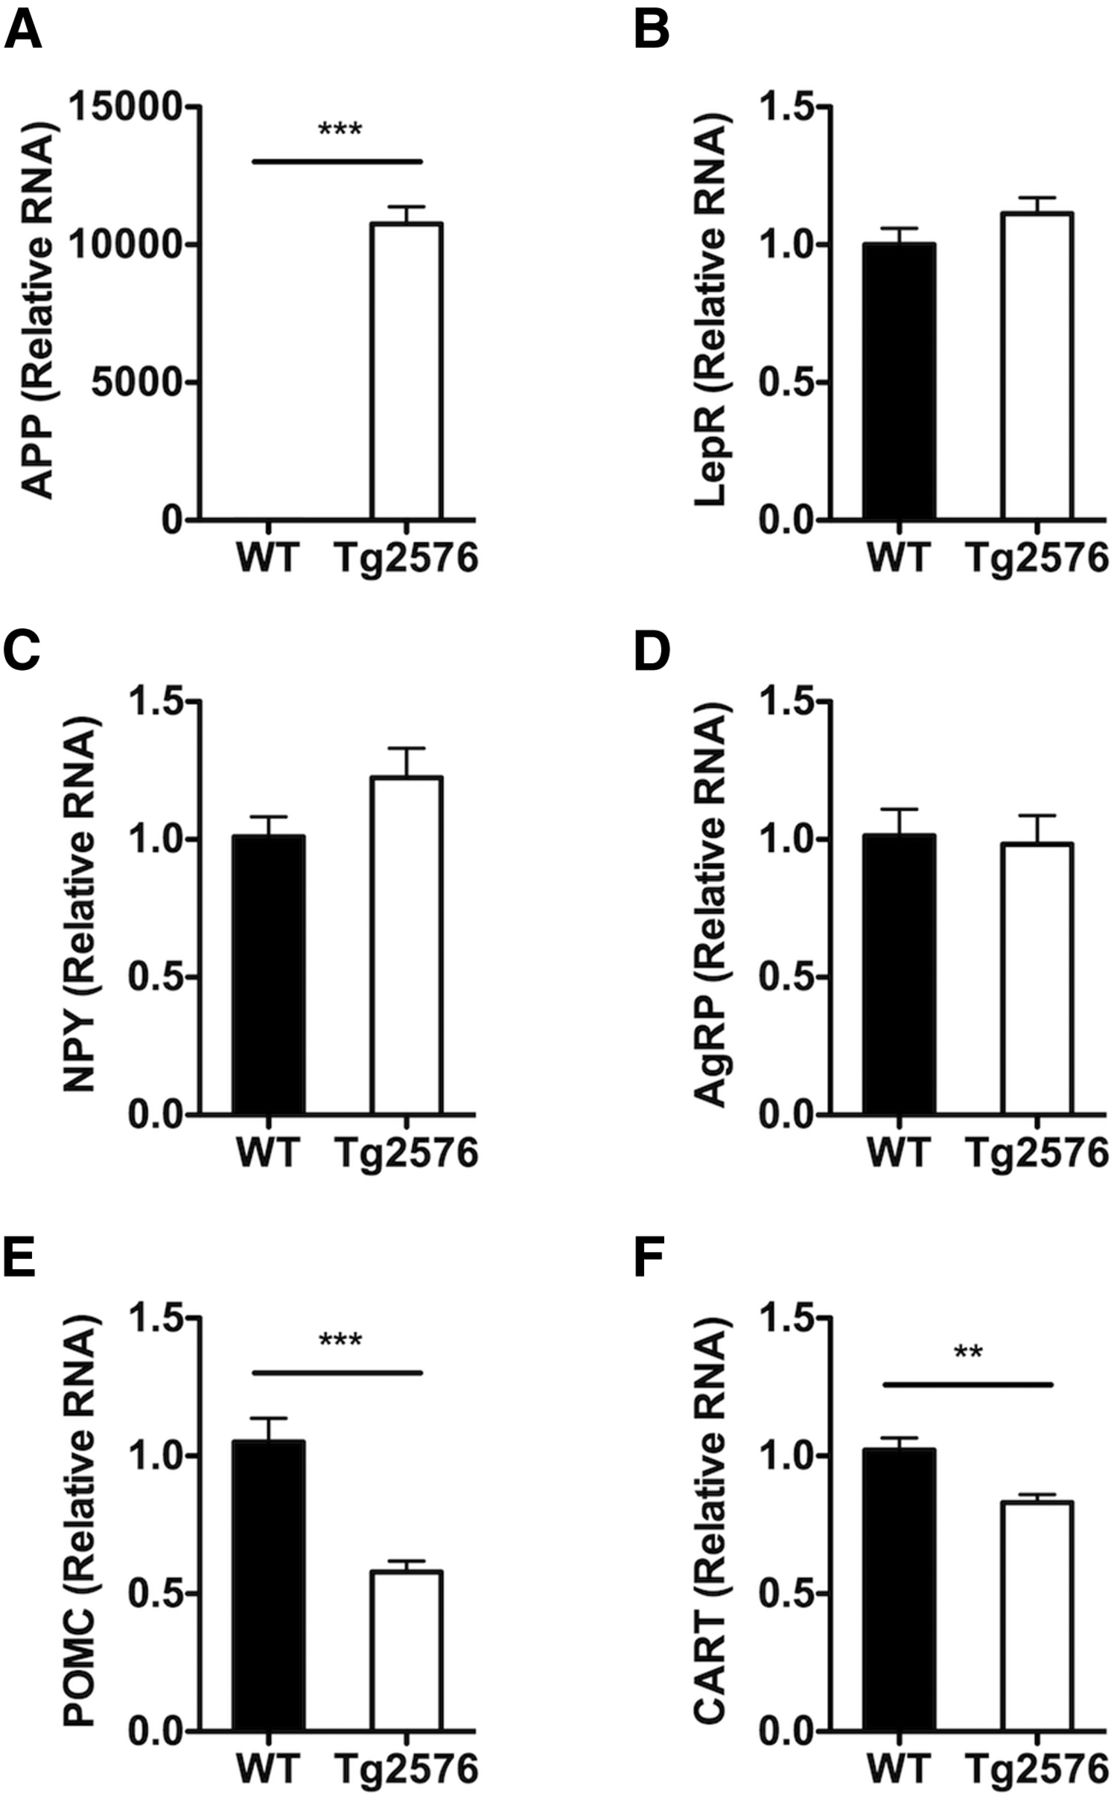
Circulating leptin binds to its receptors on first-order neurons in the arcuate nucleus of the hypothalamus to regulate body weight and adiposity (Gautron and Elmquist, 2011). In the normal response to low adiposity and concomitant low plasma leptin levels, orexigenic arcuate NPY neurons coexpressing agouti-related peptide (AgRP) neurons are activated leading to an increase in transcription of NPY and AgRP genes, whereas the anorexigenic arcuate POMC neurons coexpressing cocaine-amphetamine-related transcript (CART) are suppressed leading to a decrease in the expression of POMC and CART genes. The coordinated changes in these hypothalamic and other neural circuits lead to increase in food intake and decrease in energy expenditure resulting in restoration of body fat and plasma leptin levels. Because of the abnormal metabolic response to low plasma leptin, we investigated whether Tg2576 mice had an altered hypothalamic response to the low leptin state. To this end, first, we studied whether the expression of leptin receptor in the hypothalamus of Tg2576 mice was altered because of the overexpression of APP. However, no alterations in leptin receptor RNA levels were observed (Fig. 4). Next, we examined the expression levels of the leptin-regulated hypothalamic genes in the Tg2576 mice. Despite the low circulating plasma leptin levels, NPY and AgRP RNA levels in Tg2576 mice were not significantly different from WT levels, suggesting an abnormal response to the low leptin in NPY neurons (Fig. 4). Interestingly, POMC and CART levels were appropriately decreased in Tg2576 mice (Fig. 4), suggesting that the dysfunction was selective for NPY neurons.

Tg2576 mice have abnormal hypothalamic responses to the low basal plasma leptin levels. A, In the hypothalamus of 3-month-old Tg2576 mice, high levels of human APPswe RNA are present. B, No changes in hypothalamic leptin receptor (LepR) RNA expression in Tg2576 mice were seen. C, D, Unchanged hypothalamic NPY and AgRP RNA levels despite the low plasma leptin levels. E, F, An appropriate decrease in hypothalamic POMC and CART RNA levels was observed. All values were normalized with hypoxanthine-guanine phophoribosyltransferase RNA levels and expressed as relative values compared with WT mice. For all, n = 13 per group. **p < 0.01, from respective WT mice by t test. ***p < 0.001, from respective WT mice by t test.
Transgenic mice overexpressing APP have abnormal hypothalamic responses to fasting
Leptin is thought to be essential for the neuroendocrine response to starvation (Ahima et al., 1996). Therefore, in light of their low leptin levels, we investigated whether Tg2576 mice have an abnormal response to starvation. Mice were fasted for 48 h to induce a physiological low leptin state. Both fasted Tg2576 and WT mice had similar changes in body weight, blood glucose, and plasma insulin levels (Fig. 5A,B,D,E). However, although WT mice had appropriately decreased plasma leptin levels after fasting, plasma leptin levels in Tg2576 mice were not significantly changed from the already low basal levels (Fig. 5C). Furthermore, fasted Tg2576 mice had markedly blunted hypothalamic response in NPY and AgRP RNA levels (Fig. 5G,H), but a normal response in POMC and CART RNA levels (Fig. 5I,J). Thus, whereas fasting induced similar changes in body weight, plasma insulin, and blood glucose in WT and Tg2576 mice, fasted Tg2576 mice continued to have abnormal responses in hypothalamic NPY and AgRP RNA levels.

Tg2576 mice have abnormal hypothalamic responses to fasting. A, B, Comparable rate of body weight loss after a 48 h fast was seen in 3-month-old Tg2576 and WT mice. C, The 48 h fast caused an appropriate lowering of plasma leptin levels in WT mice, but Tg2576 mice had persistently low plasma leptin levels that remained unchanged after the fast. D, E, Comparable responses in blood glucose and plasma insulin levels were seen in WT and Tg2576 mice after a 48 h fast. F, Persistently elevated human APPswe RNA levels in Tg2576 mice were unchanged after a 48 h fast. G–J, Markedly attenuated hypothalamic NPY (G) and AgRP (H) transcriptional responses, but relatively intact POMC (I) and CART (J) transcriptional responses were found in Tg2576 mice after a 48 h fast. For all, n = 9–12 per group. *p < 0.05, from respective WT mice by t test for two group comparison or ANOVA followed by Tukey post hoc test for multigroup comparisons. **p < 0.01, from respective WT mice by t test for two group comparison or ANOVA followed by Tukey post hoc test for multigroup comparisons. ***p < 0.001, from respective WT mice by t test for two group comparison or ANOVA followed by Tukey post hoc test for multigroup comparisons.
Aβ suppresses leptin-mediated electrophysiological responses in hypothalamic NPY neurons
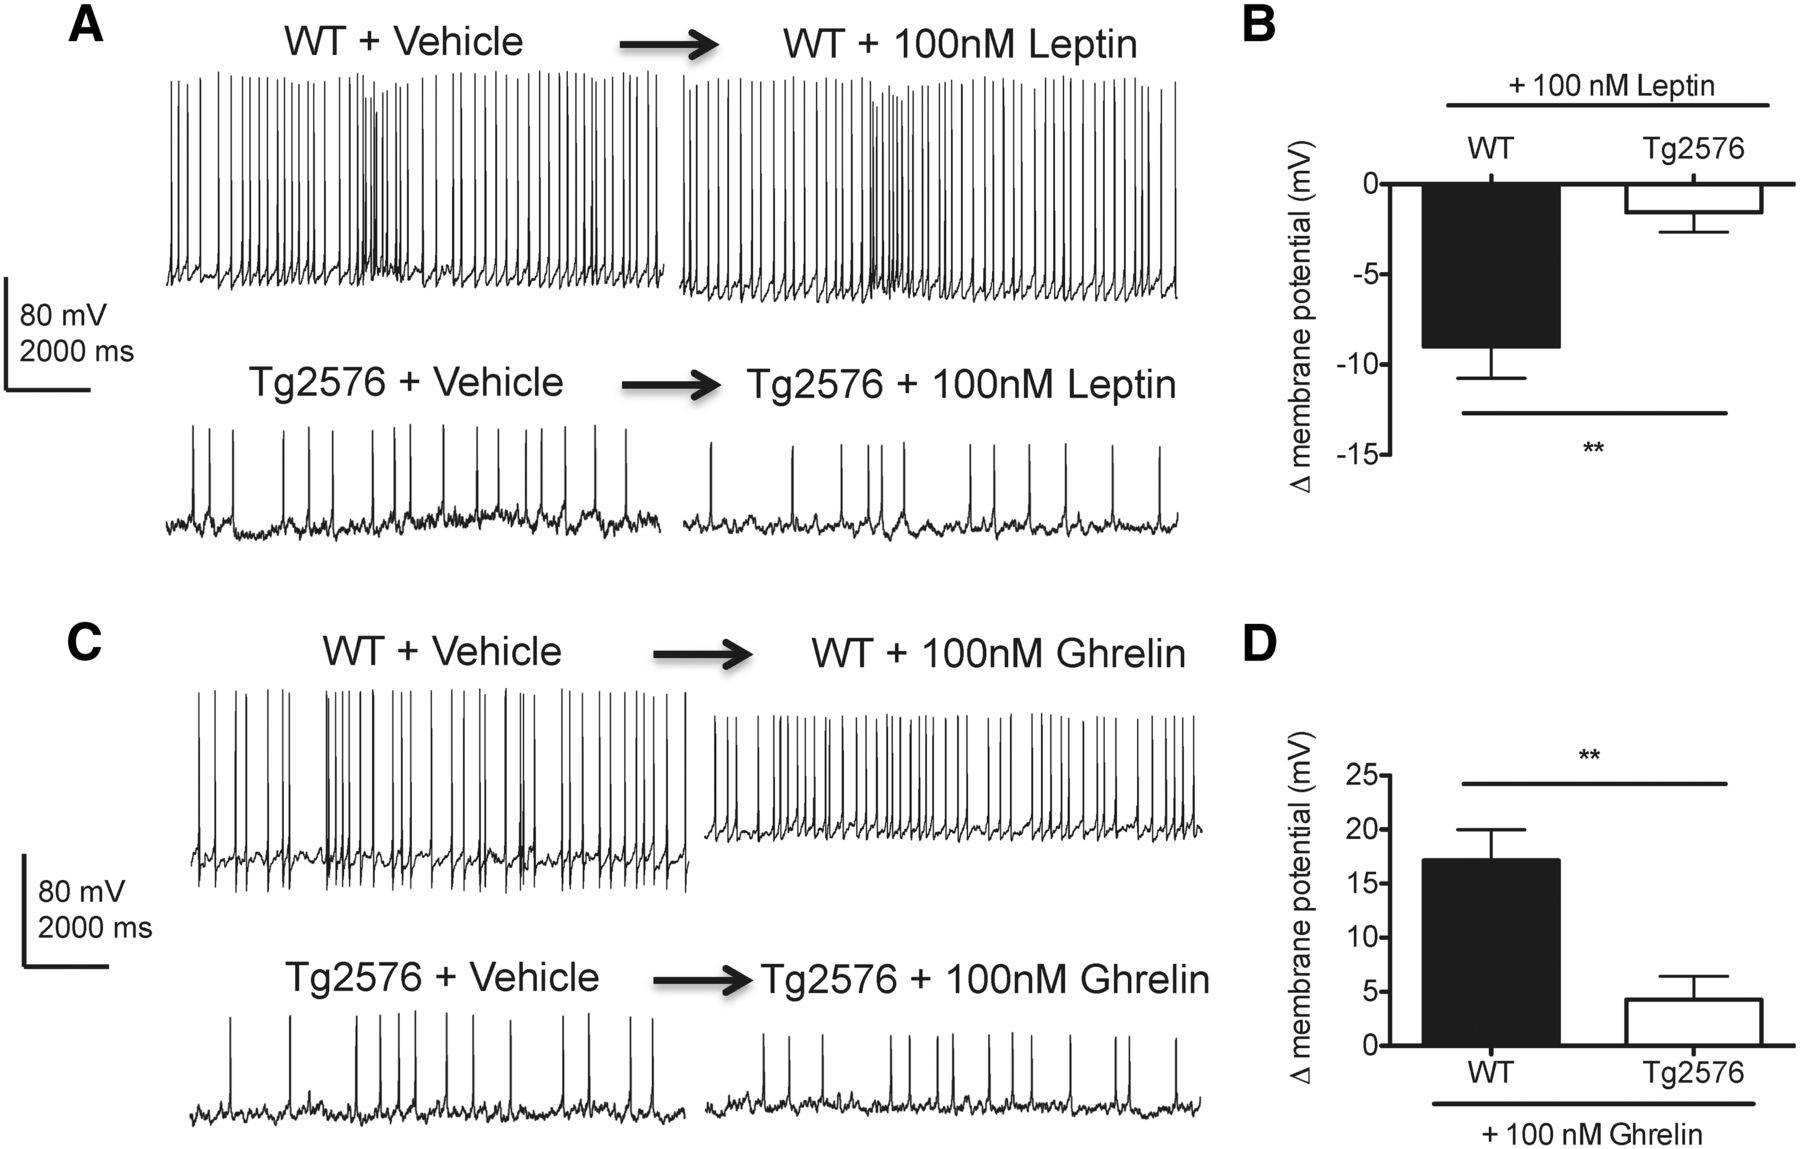
Because the transcriptional responses to low plasma leptin for NPY and AgRP were abnormal in the hypothalamus of Tg2576 mice, we examined whether the electrophysiological responses to leptin were also disrupted in hypothalamic arcuate neurons expressing NPY and AgRP. To selectively identify arcuate NPY neurons that coexpress AgRP, BAC transgenic NPY-hrGFP (NPY-GFP) mice were bred to Tg2576 mice to generate Tg2576 mice with GFP labeling specifically in NPY neurons. Consistent with previous studies (van den Pol et al., 2009), hemizygous NPY-GFP mice with and without the Tg2576 transgene were both found to have strong GFP labeling in arcuate neurons. Using whole-cell current-clamp recording, we first characterized the membrane properties of GFP-expressing arcuate NPY neurons in WT and Tg2576 hypothalamic slices. Compared with WT hypothalamic slices, arcuate NPY neurons in Tg2576 hypothalamic slices have a less negative resting membrane potential (WT: −73.2 ± 2.0 mV, Tg2576: −63.1 ± 4.5 mV, p = 0.0271, n = 10–17 cells per group) and overall decreased spontaneous spike frequency (WT: 8.5 ± 0.1 Hz, Tg2576: 2.4 ± 0.2 Hz, p < 0.0001, n = 6 cells per group). Then, we tested the response of the arcuate NPY neurons to leptin in both WT and Tg2576 brain slices. Leptin has been shown to hyperpolarize and inhibit hypothalamic NPY neurons (van den Top et al., 2004; Ghamari-Langroudi, 2012). Accordingly, acute application of leptin (100 nm) resulted in hyperpolarization of arcuate NPY neurons in WT hypothalamic slices (Fig. 6A,B). However, this effect of leptin was absent in arcuate NPY neurons in Tg2576 hypothalamic slices (Fig. 6A,B). We also tested ghrelin (100 nm), an orexigenic peptide that depolarizes and activates arcuate NPY neurons (Cowley et al., 2003; Kohno et al., 2003; Ghamari-Langroudi, 2012). Consistent with previous reports (Cowley et al., 2003), ghrelin induced depolarization and transiently increased spike frequency in arcuate NPY neurons in WT hypothalamic slices (Fig. 6C,D), a response markedly attenuated in Tg2576 slices (Fig. 6C,D). Thus, arcuate NPY neurons in Tg2576 mice have an abnormal response to both leptin and ghrelin.

Leptin-mediated hyperpolarization of hypothalamic arcuate NPY neurons is absent in Tg2576 mice. A, Leptin (100 nm) hyperpolarized arcuate NPY neurons in WT but not in Tg2576 hypothalamic slices. Arcuate nucleus from hypothalamic slices of NPY-GFP mice (3–5 weeks old) with or without the APPswe transgene were used for whole-cell patch-clamp recordings. Representative traces are shown 5 min after leptin application. B, Changes in membrane potentials determined from the recordings of arcuate NPY neurons after application of leptin (100 nm) in WT and Tg2576 hypothalamic slices. n = 8–10 cells recorded. Spontaneous spike frequency in arcuate NPY neurons after acute application of leptin remained unchanged in both WT (WT + Vehicle: 8.4 0.3 Hz, WT + leptin: 7.9 ± 0.6 Hz, p = 0.52, n = 3 cells per group) and Tg2576 hypothalamic slices (Tg2576 + Vehicle: 1.9 ± 0.1 Hz, Tg2576 + leptin: 2.6 ± 0.3 Hz, p = 0.1015, n = 3 cells per group). C, Ghrelin (100 nm) strongly depolarized arcuate NPY neurons in WT but not in Tg2576 hypothalamic slices. Representative traces are shown 5 min after ghrelin application. The increase in resting potential is associated with a reduction in the amplitude of the action potentials. D, Changes in membrane potentials determined from the recordings of arcuate NPY neurons after application of ghrelin (100 nm) in WT and Tg2576 hypothalamic slices. n = 7 or 8 cells recorded. Ghrelin (100 nm) transiently increased spontaneous spike frequencies in the first 15 s after acute application of ghrelin (WT + Vehicle: 6.1 ± 0.8 Hz, WT + ghrelin: 14 ± 0.6 Hz, p < 0.05, n = 5 cells each), whereas no effects on spike frequencies were seen in Tg2576 hypothalamic slices (Tg2576 + Vehicle: 2.8 ± 0.3 Hz, Tg2576 + ghrelin: 2.5 ± 0.1 Hz, p = 0.373, n = 6 cells each). **p < 0.01, from WT cells by t test.
To determine whether Aβ could be responsible for the neurophysiological alterations in arcuate NPY neurons observed in Tg2576 hypothalamic slices, we examined whether exogenous Aβ could reproduce such dysfunction in WT hypothalamic slices. Because Aβ oligomers may be involved in the neuronal dysfunction seen in AD (Iversen et al., 1995; Querfurth and LaFerla, 2010), we next tested whether oligomeric Aβ1–42 could inhibit the response to leptin in arcuate NPY neurons. Application of oligomeric Aβ1–42 (10–100 nm, n = 7–12 cells per group) in WT hypothalamic slices depolarized arcuate NPY neurons in a dose-dependent manner (EC50 = 29.7 nm) (Fig. 7A,B). A reduction in the amplitude of the action potentials was also noticed, but the mechanisms remain unclear. Oligomeric Aβ1–42 blocked the responses to ghrelin (100 nm) in arcuate NPY neurons dose-dependently (Fig. 7D,F,G; IC50 = 10.2 nm, n = 4–7 cells per group). Furthermore, oligomeric Aβ1–42 also inhibited the leptin-mediated hyperpolarization of arcuate NY neurons (Fig. 7C,E). Thus, the overall effects of Aβ1–42 on resting membrane potential and the electrophysiological responses to leptin and ghrelin in hypothalamic arcuate NPY neurons were similar to those seen in Tg2576 brain slices.

Leptin-mediated hyperpolarization of hypothalamic arcuate NPY neurons is absent after application of oligomeric Aβ1–42. A, Application of oligomeric Aβ1–42 (100 nm) to WT hypothalamic slices depolarized arcuate NPY neurons. The increase in resting potential is associated with a reduction in the amplitude of the action potentials. Brain slices containing the hypothalamic arcuate nucleus from NPY-GFP mice (3–5 weeks old) were used for whole-cell patch-clamp recordings. The recordings show the duration before and after oligomeric Aβ1–42 application. B, Oligomeric Aβ1–42 (10, 30, and 100 nm) depolarized arcuate NPY neurons in a dose-dependent fashion (n = 7–25 cells recorded). C, D, Exposure to oligomeric Aβ1–42 (100 nm) inhibited the electrophysiological responses to both leptin (100 nm) (C) and ghrelin (100 nm) (D) in arcuate NPY neurons. Representative traces are shown. E–G, Changes in membrane potentials determined from the recordings of arcuate NPY neurons after leptin (100 nm) (E) and ghrelin (100 nm) (F, G) application to WT hypothalamic slices treated with oligomeric Aβ1–42 (100 nm). n = 4–8 cells recorded. Although membrane potentials in arcuate NPY neurons were readily affected by oligomeric Aβ1–42, spontaneous spike frequency remained unchanged under all conditions tested (WT + Vehicle: 8.4 ± 0.5 Hz, WT + Aβ1–42: 7.6 ± 0.2 Hz, WT + Aβ1–42 + Leptin: 8.1 ± 0.3 Hz, WT + Aβ1–42 + Ghrelin: 7.9 ± 0.2 Hz, p > 0.05 for all; n = 3–5 cells per group). **p < 0.01, from WT cells by t test.
Increased amyloid burden in the brain aggravates leptin-associated metabolic dysfunction
Our studies have thus far focused on young Tg2576 mice before amyloid plaque formation. However, in AD patients, the weight loss progressively worsens and correlates with disease severity and increased mortality (White et al., 1998). Therefore, we analyzed the metabolic deficits of Tg2576 mice at 14 months of age when there are prominent amyloid plaques. By 14 months of age, Tg2576 mice had an even more profound body weight deficit compared with preamyloid plaque 3-month-old Tg2576 mice and continued to have low adiposity (Figs. 1A,B and 8A,B). Furthermore, this pronounced weight deficit and decreased adiposity in the 14-month-old Tg2576 mice correlated with significantly lower relative plasma leptin levels (13.4 ± 3.2% of WT levels at 14 months of age compared with 52.5 ± 7.1% of WT levels at 3 months of age, n = 4–15 per group, p = 0.01) (Fig. 8C). Of note, in contrast to 3-month-old mice, significantly lower plasma insulin levels were seen in 14-month-old Tg2576 mice (Fig. 8D). Furthermore, unlike younger 3-month-old Tg2576 mice, 14-month-old Tg2576 mice had significantly decreased food intake (WT: 3.59 ± 0.09 g/d, Tg2576: 3.03 ± 0.08 g/d, p = 0.01, n = 6 per group), which likely contributed to the worsening body weight disparity between aged Tg2576 and WT mice. Thus, in Tg2576 mice, as in AD patients, the body weight and metabolic alterations associated with the low leptin state are seen early in the disease process and worsen as the brain amyloid burden increases.

Aged Tg2576 mice with prominent amyloid plaques have worsening leptin-associated metabolic deficits compared with young Tg2576 mice with no amyloid plaques. A, Representative T1-weighted MR images showing an increase in adipose tissue (bright, hyperintense signal) as WT mice age from 3 months (3M) to 14 months (14M), whereas aged Tg2576 mice continue to have markedly lower overall body adiposity. B, The 14-month-old Tg2576 mice continue to have low adiposity compared with similarly aged WT mice as demonstrated by quantitative body composition analysis by MR spectroscopy (n = 6 per group). C, Increasing relative disparity in plasma leptin levels in 14-month-old (14M) Tg2576 mice to 14-month-old WT mice compared with plasma leptin levels in 3-month-old mice. D, The 14-month-old Tg2576 mice have significantly lower plasma insulin levels compared with 14-month-old WT mice. No significant difference in insulin levels was seen at 3 months of age. For all, n = 4–15 per group. *p < 0.05, from respective WT or group comparison by t test for two group comparisons or ANOVA followed by Tukey post hoc test for multigroup comparisons. **p < 0.01, from respective WT or group comparison by t test for two group comparisons or ANOVA followed by Tukey post hoc test for multigroup comparisons. ***p < 0.001, from respective WT or group comparison by t test for two group comparisons or ANOVA followed by Tukey post hoc test for multigroup comparisons.
Discussion
We set out to elucidate the pathogenic mechanisms leading to the accelerated early weight loss seen in preclinical AD (Johnson et al., 2006). We hypothesized that the weight loss was the result of excess Aβ causing hypothalamic leptin signaling dysfunction. We found that Tg2576 mice have early body weight deficits characterized by markedly decreased adiposity and abnormally low plasma leptin levels occurring before amyloid plaque formation and abnormalities in feeding behavior. Importantly, Tg2576 mice allowed us to investigate the molecular and cellular mechanisms underlying the weight deficits resulting from increased amyloid burden before amyloid plaque formation. Our studies suggest that the low leptin state arises from excess Aβ causing dysfunction in arcuate NPY neurons. This was supported by two findings: (1) in vivo studies in Tg2576 mice showing abnormal hypothalamic NPY and AgRP transcriptional responses in basal and fasting conditions; and (2) ex vivo electrophysiology studies showing abnormal responses to leptin and grehlin in arcuate NPY neurons from Tg2576 hypothalamic slices with endogenous Aβ and WT hypothalamic slices exposed to exogenous Aβ1–42. Finally, consistent with the progressive nature of AD, the body weight and associated metabolic deficits worsened as the amyloid burden increased. Collectively, these observations provide novel evidence that APP overexpression and/or excess Aβ can cause hypothalamic dysfunction in leptin-responsive neurons that could contribute to body weight loss and a pathologically low leptin state.
Leptin signaling in AD
Low levels of plasma leptin have been recently linked with AD. Epidemiological studies have demonstrated that low plasma leptin levels correlate with increased risk of developing AD and age-related cognitive deficits (Power et al., 2001; Holden et al., 2009; Lieb et al., 2009). Low plasma leptin levels were also found in humans diagnosed with mild cognitive impairment (Johnston et al., 2014). Therefore, low plasma leptin levels may serve as an early biomarker for AD. In this context, our studies suggest that the low leptin state seen early in AD reflects hypothalamic dysfunction caused by Aβ. We propose that, early in AD pathogenesis, Aβ has the potential of inhibiting key hypothalamic neurons necessary for leptin signaling to maintain proper regulation of body weight (Fig. 9). In this model, excess Aβ early in the disease disrupts the efferent arm in the central regulation of body weight to cause low body weight and a pathologically low leptin state.

Schematic demonstrating a proposed pathophysiological mechanism for the early weight loss and low plasma leptin levels in young preamyloid plaque Tg2576 mice. In this model, excess Aβ causes dysfunction in hypothalamic arcuate NPY neurons and possibly other leptin-responsive neurons to disrupt the efferent signal regulating body weight. This ultimately results in decreased adiposity and a state of pathologically low levels of plasma leptin, which may decrease leptin's potential procognitive and neuroprotective effects against Aβ toxicity in the cortex and hippocampus. The mouse brain figure was adapted from a mouse brain atlas (Paxinos and Franklin, 2004).
Although our findings suggest that overexpression of APP leads to a low leptin state, it does not directly link leptin to cognitive dysfunction in AD. However, several lines of evidence suggest that leptin may serve important roles in cognition, memory, and neuroprotection from the toxic effects of Aβ. Genetically leptin-deficient mice have, in addition to the obesity and metabolic deficits, lower brain weight, cognitive deficiency, and evidence of hippocampal synaptic dysfunction (Ahima et al., 1999; Harvey, 2013). Administration of leptin to these leptin-deficient mice improves not only the obesity but also cognitive function and synaptic plasticity and function (Harvey, 2013). Similarly, a child with congenital leptin deficiency had abnormal neurocognitive development that was substantially improved after leptin replacement therapy (Paz-Filho et al., 2008). Furthermore, in vitro studies have shown that leptin can enhance long-term potentiation and also protects against Aβ toxicity in hippocampal neurons (Doherty et al., 2013; Harvey, 2013), whereas in vivo studies demonstrate that exogenous leptin can reverse amyloid-related pathology and cognitive decline in transgenic mice models overexpressing APP (Greco et al., 2010). These studies collectively indicate that leptin may regulate neurocognitive function and support a “protective role” of leptin against AD; however, additional studies are needed to confirm and support these findings.
Hypothalamic dysfunction in AD
Although the emphasis in AD is often placed on the hippocampus and other brain structures directly involved in cognition and memory, the hypothalamus is clearly involved in AD. Significant atrophy has been identified in the hypothalamus of AD subjects by MR volumetric analysis (Callen et al., 2001). Also, pathological changes consistent with AD, including neurofibrillary tangles and amyloid plaques, have been found in the hypothalamus of postmortem AD brains (McDuff and Sumi, 1985; Saper and German, 1987; Braak and Braak, 1991). Furthermore, deep brain stimulation in the hypothalamus, introduced as a treatment for obesity, improved memory in AD subjects (Laxton et al., 2010). Therefore, understanding how the hypothalamus is affected early in AD may offer new insights into the metabolic and cognitive dysfunction associated with AD.
NPY dysfunction in AD
We focused our studies on the first-order leptin-responsive arcuate NPY neurons coexpressing AgRP, an essential site of action for leptin to regulate body weight (Gautron and Elmquist, 2011). To our knowledge, there have been no reports linking these arcuate neurons or AgRP to AD. Interestingly, there have been sporadic reports associating forebrain NPY to AD. Plasma and CSF NPY levels as well as NPY immunoreactivity in cerebral cortex have all been found to be lower in AD (Beal et al., 1986; Alom et al., 1990; Koide et al., 1995). Furthermore, in a mouse model overexpressing APP, abnormalities in hippocampal NPY network function were associated with the increased seizure activity seen in this mouse model and in AD patients (Palop et al., 2007). In addition, central administration of NPY improved learning and memory behavior in a colchicine-induced rat model of AD (Rangani et al., 2012), whereas proteolytic fragments of NPY derived from neprilysin processing were found to be neuroprotective in a mouse model overexpressing APP (Rose et al., 2009). Our findings that Aβ profoundly downregulates arcuate NPY signaling are overall consistent with these clinical and animal studies.
We showed, for the first time, that Aβ can affect the electrophysiological properties of hypothalamic neurons at low concentrations. This finding was demonstrated in arcuate NPY neurons from Tg2576 and Aβ1–42 treated WT hypothalamic slices. Although we believe that oligomeric Aβ1–42 is the probable pathogenic agent acting on the hypothalamus, we cannot exclude that APP and/or other proteolytic fragments of APP could also contribute to hypothalamic dysfunction (see Limitations of the mouse model). Furthermore, because the neurophysiological responses to both leptin and ghrelin were affected, the hypothalamic dysfunction caused by Aβ is not specific to the leptin pathway. Additional studies are needed to further investigate the possible pathophysiological mechanisms underlying the hypothalamic dysfunction caused by Aβ. In particular, the effects of Aβ on the ion channels responsible for the alterations in leptin and ghrelin-mediated electrophysiological responses in NPY neurons need to be investigated. Future studies will also need to determine the exact nature of the involvement of NPY and/or AgRP signaling in AD and whether increasing NPY and/or AgRP signaling would be therapeutically beneficial in AD. Finally, the role of other leptin-responsive hypothalamic and extra-hypothalamic neurons needs to be elucidated.
Limitations of the mouse model
Mouse models leading to Aβ accumulation have limitations concerning how accurately they recapitulate AD (Chin, 2011). In Tg2576 mice, overexpression of APP itself or APP fragments other than Aβ may contribute to the phenotype. APP knock-in mice or transgenic mice that generate only Aβ1–42 will help address this problem (McGowan et al., 2005; Saito et al., 2014). In addition, Aβ levels are increased not only in brain but also in plasma (Kawarabayashi et al., 2001). Therefore, circulating Aβ may play a role in the metabolic deficits seen in Tg2576 mice. The contribution of plasma Aβ to AD remains controversial, but plasma Aβ levels are elevated at least in early phases of AD and in carriers of familial AD mutations (Schupf et al., 2008; Bateman et al., 2012). A recent study found that WT mice receiving chronic peripheral administration of exogenous Aβ1–42 in concentrations that elevated plasma Aβ1–42 levels similar to those in Tg2576 mice induced hepatic insulin resistance, but there was no alteration in body weight in these mice (Zhang et al., 2013). Therefore, it is unlikely that our findings in Tg2576 mice are entirely attributable to peripheral effects. However, future studies will have to address this issue in mouse models with elevated Aβ levels restricted to the brain.
Conclusion
In conclusion, we have demonstrated that Tg2576 mice have decreased body weight and adiposity, leading to a state of pathologically low plasma leptin at an age before amyloid plaque formation or alterations in feeding behavior. This low leptin state was associated with hypothalamic dysfunction in arcuate NPY neurons as demonstrated by abnormal transcriptional responses to the low plasma leptin levels in basal and fasting conditions, as well as in abnormal electrophysiological responses to leptin and ghrelin. We also established that the body weight deficits worsened as the amyloid burden increased in Tg2576 mice. These novel findings provide evidence that the weight loss associated with AD could be an intrinsic feature of the disease caused by Aβ-related dysfunction of arcuate NPY neurons. The data raise the possibility that restoring leptin signaling in arcuate NPY neurons and other brain regions could lead to novel therapies for AD. Furthermore, plasma leptin and related molecules could also be biomarkers for early AD, further enhancing the ability to diagnose AD during the preclinical stage and enabling earlier therapeutic options.
Footnotes
This work was supported by the Feil Family Foundation, National Institutes of Health Grant NS37853 to C.I., a Zenith Fellow Award from the Alzheimer's Association to C.I., and the Leon Levy Foundation to M.I. M.I. holds a Leon Levy Neuroscience Fellowship. We thank Dr. Jeffrey Friedman for helpful discussions and use of facilities and equipment; Dr. Steven Paul for helpful discussions; Dr. Henning Voss and Mr. Eric Aronowitz for assistance with MRI studies; Dr. Ping Zhou and Ms. Huihong Li for maintenance of mouse colonies; Mr. Corey Anderson for assistance with generating soluble oligomeric Ab1–42; and Ms. Alicia Savage-Nieves, Sophy Aguilar, and Karen Carter for administrative support.
The authors declare no competing financial interests.
- Correspondence should be addressed to Dr. Costantino Iadecola, Feil Family Brain and Mind Research Institute, Weill Cornell Medical College, 407 E. 61st Street, RR-303, New York, NY 10065. coi2001{at}med.cornell.edu


