

Article Figures & Data
Figures
- Figure 1.
Hig localizes in the synaptic clefts of cholinergic synapses in the brain. A, Distribution of Hig in the brain. Frontal sections of the anterior and posterior brain regions are shown. Hig was observed in the entire synaptic region labeled with Brp in the WT brain, whereas Hig signals disappeared in higdd37. al, Antennal lobe; cx, calyx of the MB. B–E, Double labeling of synapses in the antennal lobe with antibodies against synaptic proteins and Hig. Hig was closely associated with ChAT (B) but not VGLUT (C), Rdl (D), or GABAbRII (E). Single glomeruli surrounded by dotted squares are magnified in the three right panels. F, G, High-resolution images of synapses in the antennal-lobe glomerulus obtained by structured illumination microscopy. Each Hig-positive synapse in focus is colabeled with Dα7-GFP, driven by Dα7-GAL4 (F). In most synapses, Hig (red at the top, gray at the bottom) localizes between Brp (blue) and Dα7-GFP (green) (G). Serial optical images were obtained at Z intervals of 0.3 μm. Scale bar, 100 nm. H, Schematic model for the distribution of Brp, Hig, and Dα7 in a microglomerulus formed by a single presynaptic bouton (pb) of olfactory projection neurons and the dendrites (d) of MB Kenyon cells (for the structure of the microglomerulus and distribution of synaptic markers, see Kremer et al., 2010). I–K, Distribution pattern of Hig in microglomeruli of the calyx. The single microglomerulus in a dotted square is enlarged in the three lower panels. Most Hig-positive microglomeruli were associated with ChAT (I). Discrete signals of Hig in microglomeruli were juxtaposed with Dα7 (J) and the active-zone marker Brp (K). K, Arrowheads indicate synapses without Hig, which are not cholinergic.
- Figure 2.
Secreted Hig-GFP is captured by the cholinergic synapses. A, Rescue of the hig phenotype by ectopic expression of Hig-GFP. The indicated GAL4 lines were used to drive Hig-GFP expression in cholinergic, glutamatergic, or dopaminergic neurons, or glia, in the hig mutant background. The genotype of the control is higdd37; UAS-hig-GFP/ +. UAS-hig-GFP on the third chromosome was used for most of the experiments, unless otherwise stated. Ddc + 1st: UAS-hig-GFP/ Y; Ddc-Gal4, higdd37/ higdd37; +/+. Ddc + 3rd: +/ Y; Ddc-Gal4, higdd37/ higdd37; UAS-hig-GFP/+. Ddc + 1st 3rd: UAS-hig-GFP/ Y; Ddc-Gal4, higdd37/ higdd37; UAS-hig-GFP/+. Error bars indicate ± SEM. B, Expression of endogenous Hig in cholinergic and glutamatergic neurons. Cholinergic and glutamatergic neurons were labeled with nuclear GFP driven by Cha-Gal4 and VGlut-Gal4, respectively. Filled and open arrowheads indicate Hig-expressing neurons with and without GFP signals, respectively. C, Synaptic localization of Hig-GFP ectopically expressed in the glia. Eaat1-GAL4 was used for glial expression of membrane-bound mCD8-GFP and Hig-GFP. Hig-GFP is detected in most synaptic regions labeled with Brp in both the anterior (ant) and posterior (post) brain sections, whereas mCD8-GFP labels glial membranes (yellow arrowheads). In MB calyx of the posterior section, Hig-GFP was detected in cholinergic microglomeruli (arrows) but excluded from noncholinergic synapses outside microglomeruli (inset, arrowheads). Scale bar: C, inset, 5 μm. D, Microglomerulus-specific localization of endogenous Hig and pan-neuronally expressed Hig-GFP. As in C, inset, endogenous Hig (top) and Hig-GFP driven by elav-Gal4 (bottom) were only detected in cholinergic microglomeruli, but not in other synapses (arrowheads). mCD8-GFP driven by elav-Gal4 labeled the whole synaptic region of the calyx (middle).
- Figure 3.
Dα7 and Dα6 levels decreases, but DLG level increases in the synaptic regions of adult higdd37 brain. A, Reduction of Dα7 localization at synapses of the optic lobe (top) and calyx microglomeruli (bottom) in higdd37. Hig was well colocalized with Dα7. B, Decrease of Dα6 localization at subsets of synapses in the optic lobe of higdd37. Magnified views of dotted areas of the medulla are shown in the middle panels for WT, and in the bottom center panel for higdd37. Strong Hig staining is found in specific layers of synapses that also contain Dα6 signals (arrowheads). Dα6 in these synapses (bracket) is significantly decreased in higdd37. Dα6 signals disappeared in Dα6DAS1 mutant brains, confirming the specificity of the anti-Dα6 antibody. C, Reduction in Dα6 signals at the synapses of the calyx microglomeruli in higdd37. D–F, Abnormal accumulation of DLG in higdd37. D, Frontal optical sections of WT and higdd37 brains stained for DLG, which labels synapses. The dotted square in the synaptic region is enlarged in E. E, Abnormal accumulation of DLG at cholinergic synapses in higdd37. Strong DLG signals (arrowheads) are adjacent to the presynaptic marker Syt-GFP, expressed under the control of cha-Gal4 (dotted squares, and insets for magnified views). Scale bar: E, inset, 1 μm. F, Abnormal accumulation of DLG in the calyx of higdd37. The intensity of DN-cadherin in higdd37 is comparable with that in the WT. G, Quantitative analyses of synaptic proteins Dα7, Dα6, DLG, and DN-cadherin in the calyx of WT, higdd37, and rescued flies (elav-Gal4/Y; higdd37; UAS-hig-GFP/+). Intensity of fluorescence in higdd37 is normalized to the WT values. Error bars indicate ± SEM. **p < 0.01, compared with WT (ANOVA followed by Bonferroni's post hoc test). NS, Not significantly different.
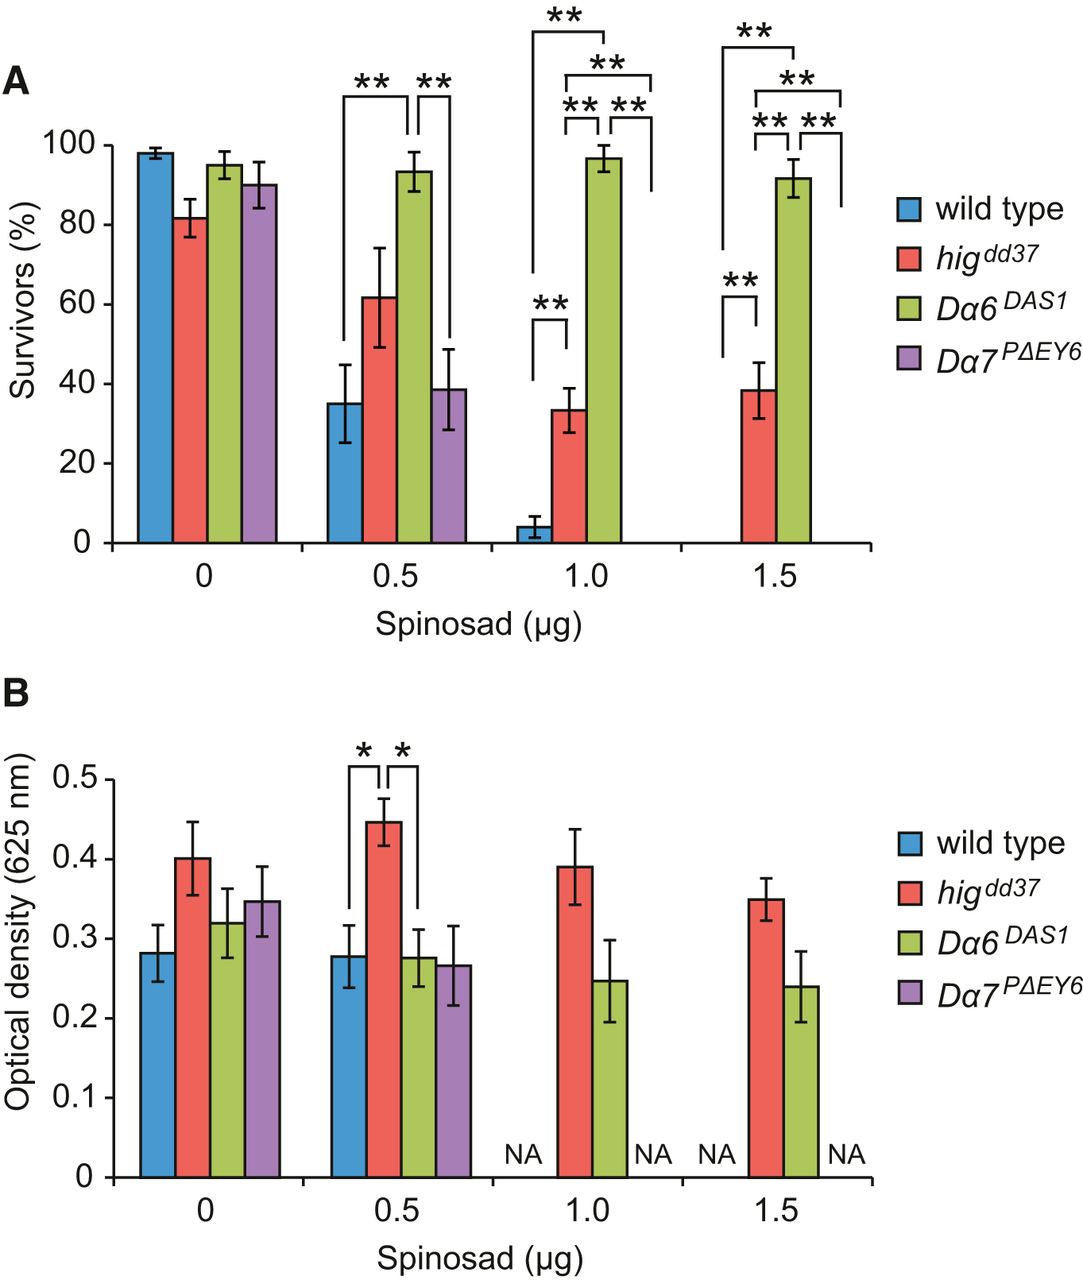
- Figure 4.
higdd37 flies exhibit partial resistance to spinosad. A, Test for spinosad resistance. Flies (3- to 5-d-old) were reared on media with the indicated amount of spinosad for 24 h, and surviving flies were counted for each genotype. B, Feeding activity was estimated by measuring the optical absorbance of the dye in extracts from surviving flies. NA, Not applicable. Error bars indicate ± SEM. The resistance test was performed at least five times (50 flies) for each genotype. *p < 0.05 (ANOVA followed by Bonferroni's post hoc test). **p < 0.01 (ANOVA followed by Bonferroni's post hoc test).


