

Article Figures & Data
Figures
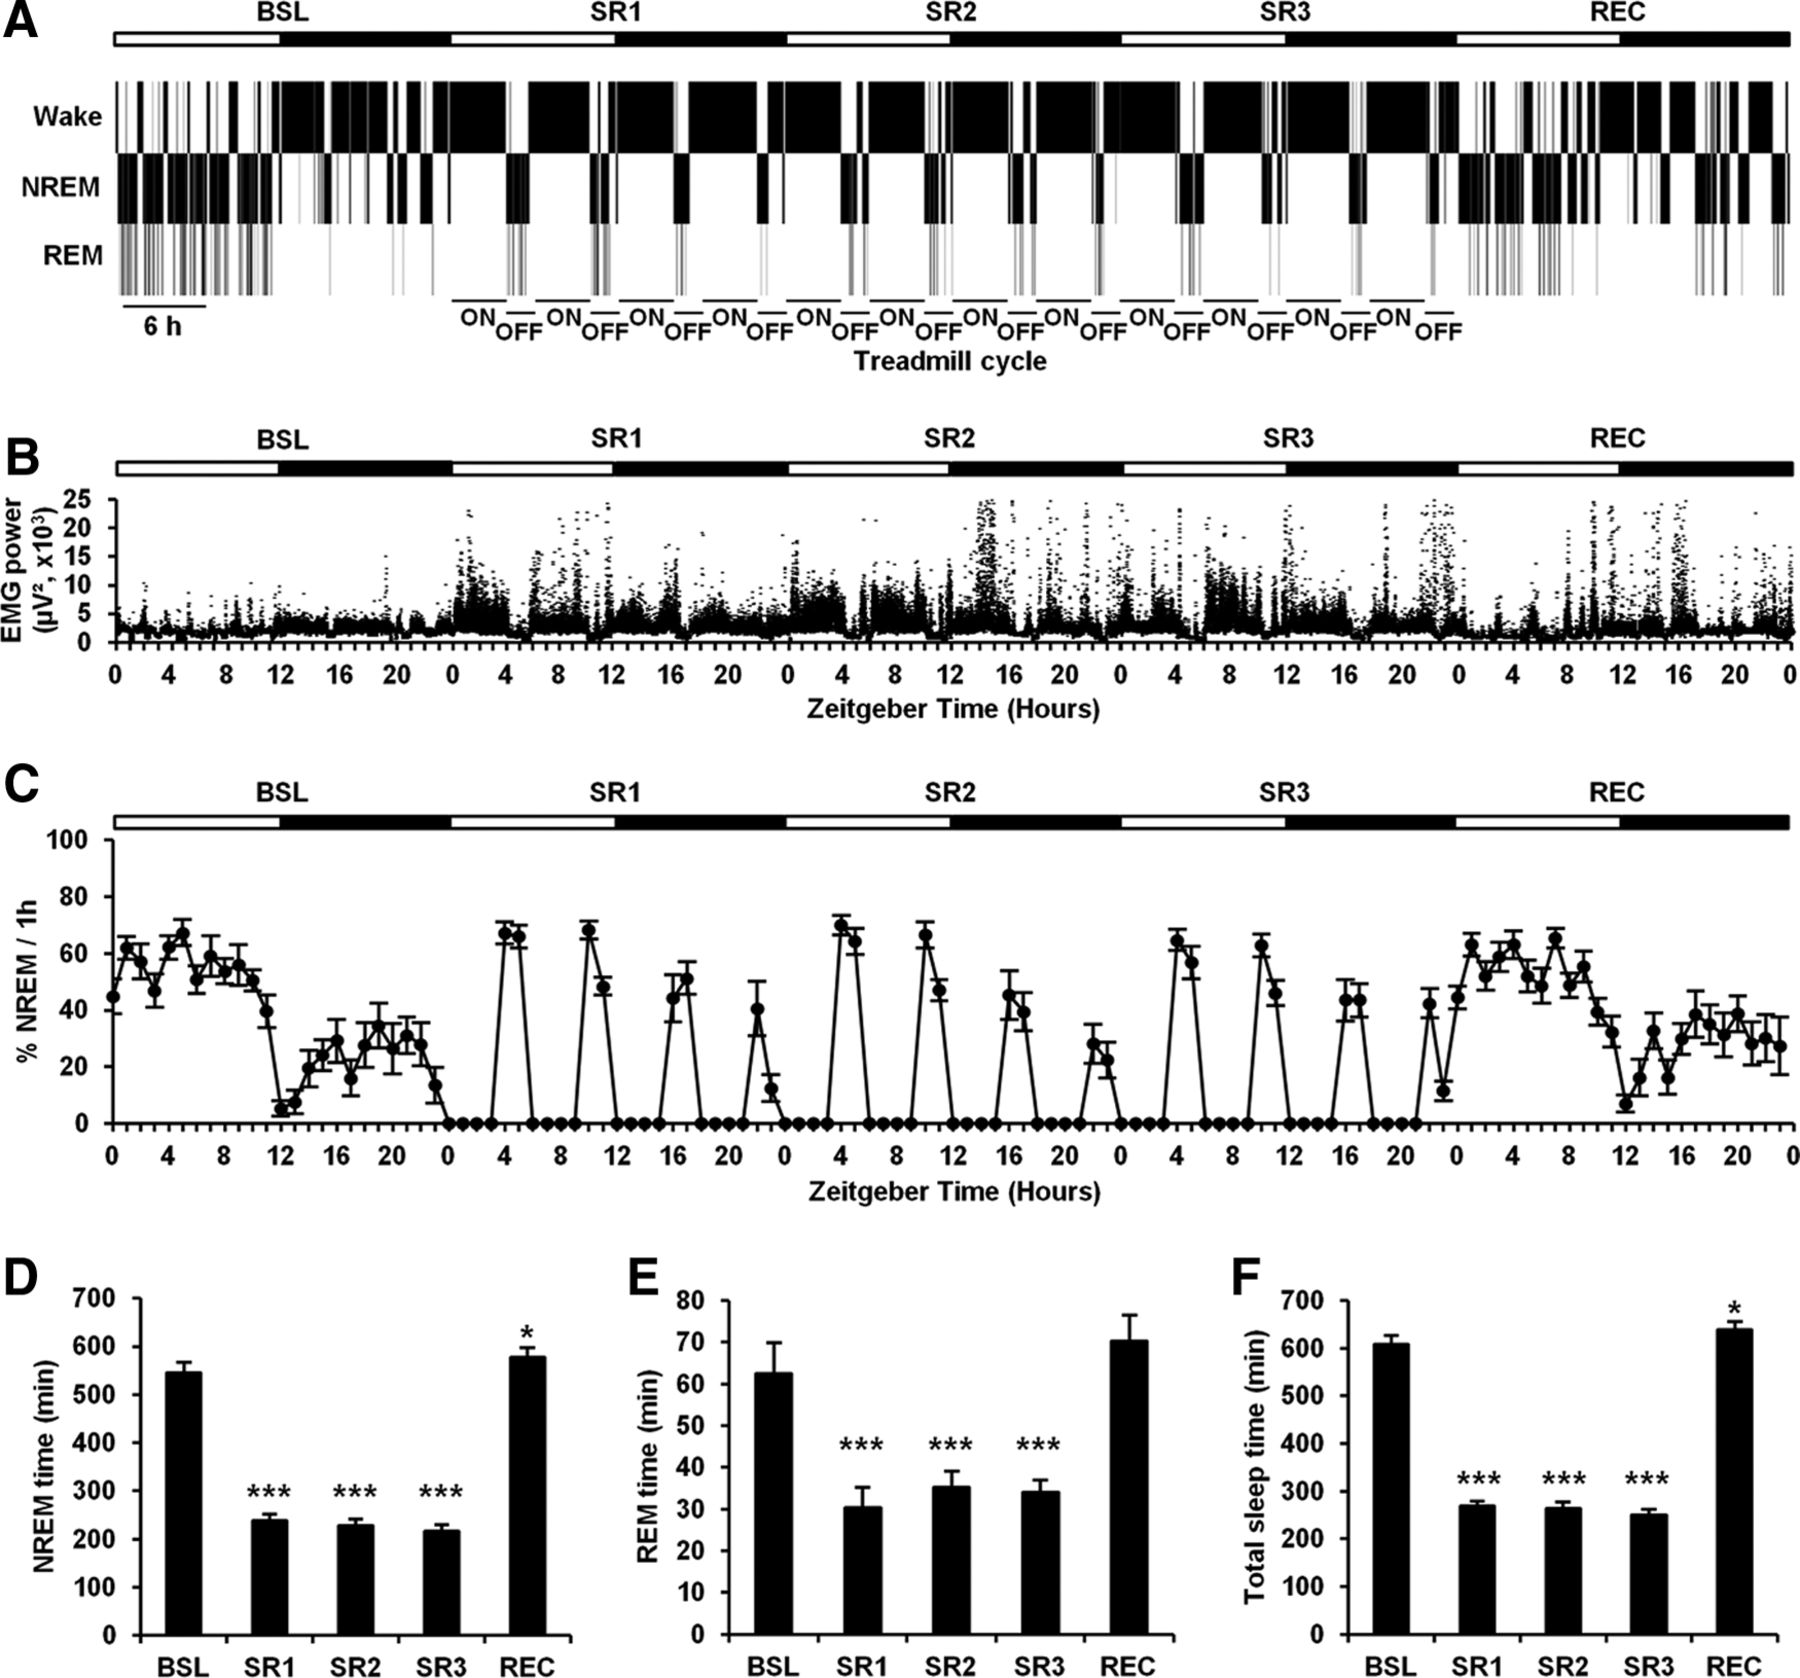
- Figure 1.
Chronic sleep restriction affects sleep architecture. A, Representative hypnogram of a mouse housed on a treadmill during baseline day (BSL), three consecutive days of sleep restriction (SR1, SR2, and SR3) and recovery day (REC). The slow-moving treadmill was on for 4 h (ON) and off for 2 h (OFF) for a total of 12 complete 6 h cycles. Mice were maintained on a 12 h light (open 12 h horizontal bar)/dark (filled 12 h horizontal bar). Note the disruption of the diurnal pattern of the NREM sleep during the three consecutive days of sleep restriction compared with the BSL and REC days. B, Analysis of EMG power from the mouse presented in A. Note the increase in EMG power during the corresponding periods of spontaneous and enforced wakefulness. C, Percentage average of the time spent in NREM sleep per hour during the 5 d of the experiment on the treadmill (n = 11 animals). D, E, Averaged amount of time spent in NREM sleep (D) and REM sleep (E) during each 24 h of the experiment (D, one-way repeated-measures ANOVA, F = 295.81, p < 0.001, SNK post hoc test, *p < 0.05, ***p < 0.001 compared with BSL, n = 11 animals; E: one-way repeated-measures ANOVA, F = 30.08, p < 0.001, SNK post hoc test, ***p < 0.001 compared with BSL, n = 11 animals). F, The averaged amount of total sleep time (NREM + REM) during each 24 h of the experiment was significantly decreased during the 3 d period of chronic sleep restriction (one-way repeated-measures ANOVA, F = 350.06, p < 0.001; SNK post hoc test, *p < 0.05, ***p < 0.001 compared with BSL; n = 11 animals). Error bars represent SEM.
- Figure 2.
Effect of chronic sleep restriction on SWA. A, EEG power of SWA (0.5–4 Hz) during NREM sleep for each hour of the 5 d of the experiment on the treadmill plotted as percentage of 24 h mean values of the BSL day (n = 11 animals). B, NREM sleep EEG power during the total 8 h TM-off periods for each day of the experiment on the treadmill plotted as percentage of 24 h mean values of the BSL day (two-way repeated-measures ANOVA: day, F = 6.84, p < 0.001; frequency, F = 6.28, p < 0.001; day × frequency, F = 4.60, p < 0.001; n = 11 animals). Squares and circles at the bottom indicate frequencies that significantly differ from the BSL (SNK post hoc test, p < 0.05). C, EEG power of SWA (percentage change from 24 h BSL) in NREM sleep during the total 8 h TM-off periods for each day of the experiment on the treadmill. SWA during the BSL and REC days were averaged over the corresponding total 8 h TM-off periods of each day of sleep restriction. Note the progressive attenuation in the increase of SWA over the 3 d of sleep restriction (one-way repeated-measures ANOVA, F = 17.69, p < 0.001; SNK test, *p < 0.05, ***p < 0.001; n = 11 animals; n.s., nonsignificant). D, Wake EEG power during the total 8 h TM-off periods for each day of the experiment on the treadmill plotted as percentage of 24 h mean values of the BSL day (two-way repeated-measures ANOVA: day, F = 0.93, p > 0.05; frequency, F = 2.42, p < 0.001; day × frequency, F = 2.47, p < 0.001; n = 6 animals). Squares and circles at the bottom indicate frequencies that significantly differ from the BSL (SNK post hoc test, p < 0.05). E, EEG power of SWA (percentage change from 24 h BSL) in wakefulness during the total 8 h TM-off periods for each day of the experiment on the treadmill. SWA during the BSL and REC days were averaged over the corresponding total 8 h TM-off periods of each day of sleep restriction (one-way repeated-measures ANOVA, F = 0.96, p > 0.05, n = 6 animals). F, Wake EEG power during the total 16 h TM-on periods for each day of the experiment on the treadmill plotted as percentage of 24 h mean values of the BSL day (two-way repeated-measures ANOVA: day, F = 0.97, p > 0.05; frequency, F = 2.91, p < 0.001; day × frequency, F = 3.34, p < 0.001; n = 6 animals). Squares at the bottom indicate frequencies that significantly differ from the BSL (SNK post hoc test, p < 0.05). G, EEG power of SWA (percentage change from 24 h BSL) in wakefulness during the total 16 h TM-on periods for each day of the experiment on the treadmill. SWA during the BSL and REC days were averaged over the corresponding total 16 h TM-on periods of each day of sleep restriction (one-way repeated-measures ANOVA, F = 2.87, p > 0.05, n = 6 animals). Error bars represent SEM.
- Figure 3.
Cumulative loss of integrated SWA does not fully recover after chronic sleep restriction. A–C, Time course of integrated SWA over each 24 h period is shown in wake (A), NREM (B), and all vigilance states (C). EEG power of SWA was cumulatively summed in 1 h bins over a 24 h period during the BSL, SR1, SR2, SR3, and REC days. A–C, Asterisks indicate cumulative curves that significantly differ between days (two-way repeated-measures ANOVA followed by SNK post hoc test: *p < 0.05, **p < 0.01, ***p < 0.001; n = 11 animals). D–F, Time course of integrated SWA over the entire experiment in wake (D), NREM (E), and all vigilance states (F). EEG power of SWA was cumulatively summed in 1 h bins over the 5 d of the chronic sleep restriction experiment (SR curve). The accumulation of integrated SWA over all days in the absence of chronic sleep restriction (BSL curve) represents an extrapolation of the empirical curves obtained on the BSL day. Note that the cumulative loss of integrated SWA during NREM (E) and all vigilance states (F) did not recover at the end of the REC day (D–F, two-way repeated-measures ANOVA followed by SNK post hoc test: *p < 0.05, ***p < 0.001, n = 11 animals per condition; n.s., nonsignificant). Error bars represent SEM.
- Figure 4.
Effect of chronic sleep restriction on sleep homeostasis. A, Schematic showing the protocol for sleep deprivation (SD) after sleep restriction: mice were housed on a treadmill (TM) and monitored with cortical EEG. In the nonsleep-restricted (Non-SR) group, mice were left undisturbed on the TM while in the sleep-restricted (SR) group, mice were subjected to 3 d (72 h) of restricted sleep. Assessment of sleep homeostasis was successively conducted on days 6 and 19 of the experiment for the non-SR group and after 24 h and 2 weeks of recovery for the SR group. Both non-SR and SR mice were sleep deprived for 6 h on the TM starting at ZT0 and then allowed to recover for the following 18 h. B–E, Assessment of sleep homeostasis on day 6. B, Following SD, the increase in SWA power during NREM sleep, expressed as percentage of last 4 h of the light phase during day 5 was significantly smaller in the SR animals compared with the non-SR animals (two-way repeated-measures ANOVA: condition, F = 13.50, p < 0.001; time, F = 41.45, p < 0.001; condition × time, F = 8.02, p < 0.001; SNK post hoc test, *p < 0.05, **p < 0.01, ***p < 0.001; n = 16 animals per condition). C, Average latency to NREM sleep after SD in non-SR and SR animals (Mann–Whitney U test: U = 98.50, p > 0.05, n = 16 animals per condition; n.s., nonsignificant). D–E, SD increased both the amount of time spent in NREM sleep (D) and duration of NREM episodes (E) in non-SR group but not in SR group during the 18 h recovery period compared with the corresponding 18 h of day 5 (D: non-SR group, paired Student's t test, t = −4.58, ***p < 0.001; SR group, paired Student's t test, t = 0.80, p > 0.05, n = 16 mice per group; E: non-SR group, paired Student's t test, t = −4.29, ***p < 0.001; SR group, paired Student's t test, t = −0.56, p > 0.05, n = 16 animals per group; n.s., nonsignificant). F–I, Assessment of sleep homeostasis on day 19. F, Following SD, the increase in SWA power during NREM sleep, expressed as percentage of last 4 h of the light phase during day 18 was significantly smaller in the SR animals compared with the non-SR animals (two-way repeated-measures ANOVA: condition, F = 1.34, p > 0.05; time, F = 16.78, p < 0.001; condition × time, F = 2.46, p < 0.05; SNK post hoc test, **p < 0.01; n = 6 animals per condition). G, Average latency to NREM sleep after SD in non-SR and SR animals (unpaired Student's t test: t = −0.91, p > 0.05, n = 6 animals per condition). H–I, SD increased both the amount of time spent in NREM sleep (H) and duration of NREM episodes (I) in non-SR group but not in SR group during the 18 h recovery period compared with the corresponding 18 h of day 18 (H: non-SR group, paired Student's t test, t = −2.86, *p < 0.05; SR group, paired Student's t test, t = −1.55, p > 0.05, n = 6 mice per group; I: non-SR group, paired Student's t test, t = −3.33, *p < 0.05; SR group, paired Student's t test, t = −1.60, p > 0.05, n = 6 animals per group). Error bars represent SEM.
- Figure 5.
Sleep restriction inactivates wakefulness-dependent elevation of extracellular adenosine. A, Adenosine tone was significantly higher in hippocampal slices taken from mice that had been sleep deprived for 4 h (SD) on the treadmill compared with slices taken from undisturbed controls (Mann–Whitney U test: U = 0.00, *p < 0.05; n = 5 per group). B, Compared with slices taken from nonsleep-restricted control mice (BSL) (n = 6), 3 consecutive days of sleep restriction (SR1, n = 4; SR2, n = 4; SR3, n = 4) produced a progressive reduction in the level of adenosine tone, measured after each day of sleep restriction at ZT0. This reduced adenosine tone persisted after a recovery period of 24 h (REC, n = 6) and 2 weeks (2 week REC, n = 6; group comparison of sleep restriction/recovery with baseline: p < 0.01, Kruskal–Wallis ANOVA, H = 10.51; Mann–Whitney post hoc test, *p < 0.05, **p < 0.01). C, Top, The synaptic input/output response measured at ZT0 was reduced in slices from BSL mice compared with those from the REC group. In response to increasing stimulation, the fEPSP slope relative to presynaptic volley showed a greater response to similar axonal input (linear fit across recordings during BSL: y = 0.92x, r2 = 0.63; linear fit across recordings during REC: 2.19x, r2 = 0.34; n = 6 per group). Bottom, The slopes estimated from individual linear fits of input/output curves were significantly increased in REC mice relative to BSL controls (unpaired Student's t test, t = −2.48, *p < 0.05, n = 6 per group). D, Sensitivity to presynaptic inhibition by A1Rs was assessed using increasing concentrations of the agonist CCPA (from 0.1 to 300 nm). Sensitivity was not reduced in slices taken from REC mice compared with slices taken from BSL mice. Sleep-restricted and control mice show similar levels of paired pulse facilitation (top, two-way repeated-measures ANOVA, condition, F = 0.06, p > 0.05, concentration, F = 9.92, p < 0.001; condition × concentration, F = 0.30, p > 0.05, n = 5 for each group) and synaptic inhibition (bottom; Hill plot fit of reduction in fEPSP slope relative to baseline; REC: IC50 = 4 nm; BSL: IC50 = 10 nm; n = 5 for each group) for all concentrations of CCPA. The n value indicates the number of animals (1 slice per animal). Error bars represent SEM.
- Figure 6.
Prior sleep restriction significantly suppresses the sleep deprivation-dependent increase in adenosine-mediated inhibition. A, Significantly lower adenosine tone is observed in previously SR mice compared with Non-SR controls following 6 h of SD (Mann–Whitney U test, U = 0.00: **p < 0.01, n = 5 per group). Insets, The average of fEPSPs before (baseline) and during application of 200 nm CPT in non-SR (left) and SR mice (right) after 6 h SD. Scale bars, 0.2 mV, 2.5 ms. B, Left, Following SD, the input–output curve in SR mice shows an apparent increase compared with non-SR mice. In response to increasing stimulation, the fEPSP slope relative to presynaptic volley showed a greater response to similar axonal input in slices from SR mice (linear fit across recordings in non-SR mice: y = 0.94x, r2 = 0.80; linear fit across recordings in SR mice: y = 3.26x, r2 = 0.72; n = 6 per group). Insets, The average of fEPSPs in response to currents of increasing intensity in non-SR (left) and SR mice (right) after 6 h SD. Scale bars, 0.2 mV, 2.5 ms. Right, The slopes estimated from individual linear fits of input/output curves were significantly increased in SR mice relative to non-SR controls (Tukey's HSD test, q = 3.61, **p < 0.01, n = 6 per group). The n value indicates the number of animals (1 slice per animal). Error bars represent SEM.
- Figure 7.
Passive reuptake of adenosine is reduced following sleep restriction. A, Blocking passive transport of adenosine through ENT1 with NBMPR (100 nm) produces a marked reduction in fEPSP slope in control slices from non-SR mice (top graph) which was not evident in SR mice (bottom graph). Insets, The average of fEPSPs before (black trace) and during application of 100 nm NBMPR (gray trace) in non-SR (top graph) and SR mice (bottom graph). Scale bars, 0.2 mV, 5 ms. B, Average percentage change of the fEPSP slope in response to NBMPR calculated during the last 5 min of the application period. A significantly greater change in synaptic inhibition was observed in slices from the non-SR group compared with those from the SR group (Tukey's HSD test, q = 4.27 *p < 0.05, n = 5 per group). The n value indicates the number of animals (1 slice per animal). Error bars represent SEM.
- Figure 8.
Sensitivity to the motor-impairing effects of alcohol is decreased following chronic sleep restriction, an effect mimicked by blocking A1Rs. A, SR mice were significantly less impaired on the rotarod after alcohol injection (2 g/kg) compared with non-SR when tested 24 h after termination of sleep restriction (two-way repeated-measures ANOVA: condition, F = 7.00, p < 0.05; time, F = 51.61, p < 0.001; condition × time, F = 2.40, p < 0.05; Bonferonni post hoc test, *p < 0.05, **p < 0.01). B, C, The effect persisted when mice were tested 2 weeks later (B, two-way repeated-measures ANOVA: condition, F = 13.20, p < 0.001; time, F = 117.97, p < 0.001; condition × time, F = 3.11, p < 0.01; Bonferonni post hoc test, *p < 0.05, ***p < 0.001) and 4 weeks later (C, two-way repeated-measures ANOVA: condition, F = 4.91, p < 0.05; time, F = 72.37, p < 0.001; Bonferonni post hoc test, ***p < 0.001). D, Compared with non-SR mice, the time required for mice to reach 50% recovery rate is significantly less in SR mice (two-way repeated-measures ANOVA: condition, F = 15.30, ***p < 0.001). E, The effect of chronic sleep restriction was mimicked in mice receiving continuous intracerebroventricular infusion of DPCPX (100 μm), which were less sensitive to the motor-impairing effects of alcohol compared with vehicle (Veh)-treated mice (two-way repeated-measures ANOVA: condition, F = 1.74, p > 0.05; time, F = 39.95, p < 0.001; condition × time, F = 2.44, p < 0.05; Bonferonni post hoc test, *p < 0.05; **p < 0.01). F, In SR mice, continuous intracerebroventricular infusion of DPCPX (100 μm) did not further reduce sensitivity to the motor-impairing effects of alcohol compared with vehicle (Veh)-treated mice (two-way repeated-measures ANOVA: condition, F = 0.88, p > 0.05; time, F = 33.36, p < 0.001; condition × time, F = 0.89, p > 0.05). The n value depicted in this figure indicates the number of animals. Error bars represent SEM.


