

Article Figures & Data
Figures
- Figure 1.
Experimental task, behavioral data, and topographic mapping. A, Trial schematics of memory-guided prosaccade and antisaccade tasks. The dashed square depicted during the delay epochs represent the saccade goal, but were not visible during the task. B, Neither SRTs nor saccade errors differed significantly between the tasks. Error bars show SEM across subjects. C, Definition of retinotopic visual areas projected onto flattened occipital-parietal patches from an example subject. The colors depict the phase estimates from the localizer task that mapped the polar angle within a ring 9–11° in the periphery where saccades were planned in the saccade tasks. LH, Left hemisphere; RH, right hemisphere; UVM, upper visual meridian; LVM, lower visual meridian; LHM, left horizontal meridian. D, Delay period data extracted from retinotopic ROIs mapping quadrant bands were sorted into four trial types according to the quadrant into which the saccade was planned. We compared trials in which the saccade plan was directed into the part of the visual field mapped by the topographic ROI (In, green) with trials in which it was directed into other visual field quadrants [i.e., the mirror image location in the opposite hemifield (red), the adjacent quadrant in the same hemifield (magenta), and the diagonal quadrant (blue)]. The example shown depicts a left hemisphere ROI that maps the contralateral upper visual field quadrant.
- Figure 2.
Trial averaged time courses during the maintenance of planned prosaccades. A, Following a transient visual response to the brief visual target (triangle), activity persisted in early visual areas in the part of the retinotopic map that represented the location of the visual target and matching saccade goal (saccade plan into RF, green) but not in a control area that mapped the mirror location in the opposite hemifield (saccade plan away from RF, mirror, red). B, In the dorsal stream retinotopic ROIs, V3A/B and IPS0, spatially specific activity persisted when the visual target and planned saccade fell within the ROI's mapped RF quadrant. C, Similarly, activity persisted in ventral stream ROIs, hV4 and VO1, when the visual target and saccade goal matched the ROI's mapped RF quadrant. Shaded area bounds the delay-period activity. Open circles represent the mean fMRI response across trials and subjects. Error bars represent SEM. The solid line and error ribbon represent the mean and SEM from the model fits (see Materials and Methods). Model fits the observed data well; r2IN = 0.85; r2MIRROR = 0.80.
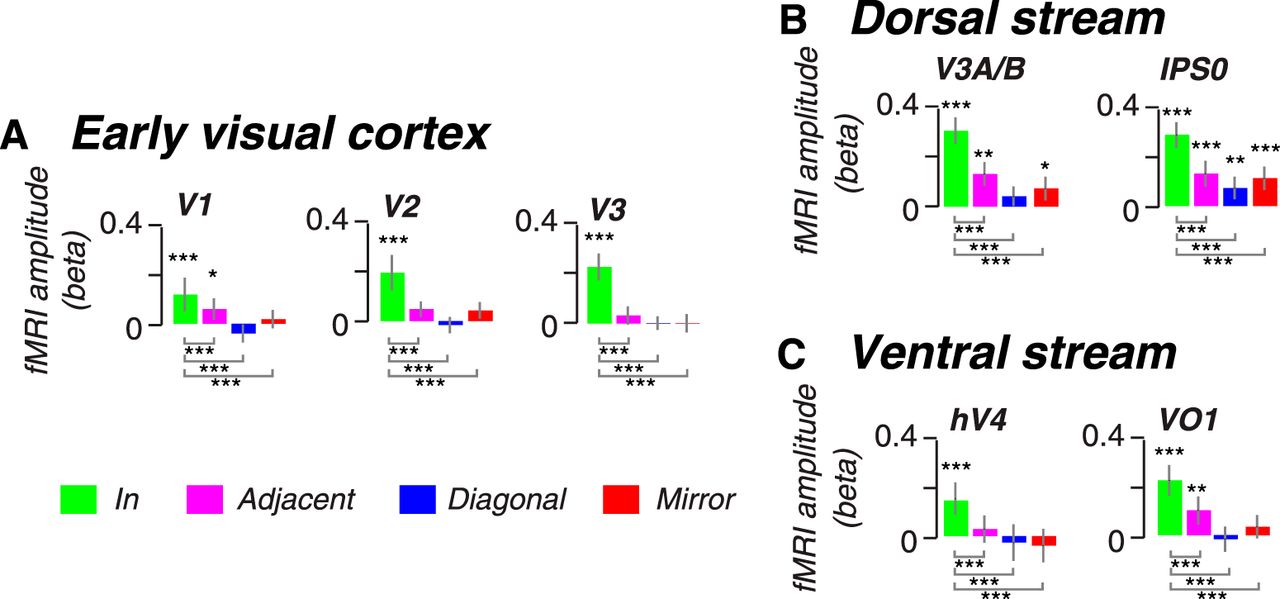
- Figure 3.
Cortical responses during the maintenance of planned prosaccades. Memory-guided saccade responses in (A) early visual cortex, (B) the dorsal stream, and (C) the ventral stream. Each panel depicts modeled amplitude of delay period activity for prosaccades for each visual area. Responses are ordered by trial type according to the location of the topographic map matching the planned saccade (Fig. 1 D). Green bars (In) show responses from voxels that map the goal of the planned saccade. Red bars (Mirror) show responses that map the mirror quadrant of the goal of the planned saccade. Magenta and blue bars show responses from the adjacent and diagonal quadrants, respectively, of the planned saccade. Each bar represents the mean amplitude of the fitted delay period response across subjects (±SEM). Asterisks indicate significant delay period activity more than zero (above bars) and significant activity differences between when the saccade plan was into the RF versus the other locations (below bars), where *p < 0.05, **p < 0.01, and ***p < 0.005, determined by permutation tests.
- Figure 4.
Trial averaged time courses during the maintenance of planned antisaccades. A, First, the brief visual target (triangle) evoked a transient response in early visual areas in the part of the retinotopic map that represented the location of the visual target similar to planned prosaccades (Mirror RF to the saccade plan, red). Then, activity ramped up and persisted in the part of the retinotopic map that represented the saccade goal (saccade plan into RF, green). B, In the dorsal stream retinotopic ROIs, V3A/B and IPS0, spatially specific activity persisted when the planned saccade fell within the ROI's mapped RF quadrant. C, Similarly, activity persisted in ventral stream ROIs, hV4 and VO1, when the saccade goal matched the ROI's mapped RF quadrant. Shaded area bounds the delay-period activity. Open circles represent the mean fMRI response across trials and subjects. Error bars represent SEM. The solid line and error ribbon represents the mean and SEM from the model fits (see Materials and Methods). Model fits the observed data well; r2IN = 0.85; r2MIRROR = 0.87.
- Figure 5.
Cortical responses during the maintenance of planned antisaccades. Memory-guided saccade responses in (A) early visual cortex, (B) the dorsal stream, and (C) the ventral stream. Each panel depicts modeled amplitude of delay period activity for antisaccades for each visual area. Responses are ordered by trial type according to the location of the topographic map matching the planned saccade (Fig. 1 D). Green bars (In) show responses from voxels that map the goal of the planned saccade. Red bars (Mirror) show responses that map the mirror quadrant of the goal of the planned saccade, which also correspond to the visual saccade target's location. Magenta and blue bars show responses from the adjacent and diagonal quadrants, respectively, of the planned saccade. Each bar represents the mean amplitude of the fitted delay period response across subjects (±SEM). Asterisks indicate significant delay period activity more than zero (above bars) and significant activity differences between when the saccade plan was into the RF versus the other locations (below bars), where *p < 0.05, **p < 0.01, and ***p < 0.005, determined by permutation tests.


