

Abstract
Brain function can be conceived as a hierarchy of generative models that optimizes predictions of sensory inputs and minimizes “surprise.” Each level of the hierarchy makes predictions of neural events at a lower level in the hierarchy, which returns a prediction error when these expectations are violated. We tested the generalization of this hypothesis to multiple sequential deviations, and we identified the most likely organization of the network that accommodates deviations in temporal structure of stimuli. Magnetoencephalography of healthy human participants during an auditory paradigm identified prediction error responses in bilateral primary auditory cortex, superior temporal gyrus, and lateral prefrontal cortex for deviation by frequency, intensity, location, duration, and silent gap. We examined the connectivity between cortical sources using a set of 21 generative models that embedded alternate hypotheses of frontotemporal network dynamics. Bayesian model selection provided evidence for two new features of functional network organization. First, an expectancy signal provided input to the prefrontal cortex bilaterally, related to the temporal structure of stimuli. Second, there are functionally significant lateral connections between superior temporal and/or prefrontal cortex. The results support a predictive coding hypothesis but go beyond previous work in demonstrating the generalization to multiple concurrent stimulus dimensions and the evidence for a temporal expectancy input at the higher level of the frontotemporal hierarchy. We propose that this framework for studying the brain's response to unexpected events is not limited to simple sensory tasks but may also apply to the neurocognitive mechanisms of higher cognitive functions and their disorders.
Introduction
Brain function can be conceived as a hierarchy of generative models that optimizes predictions of sensory inputs and prediction errors (Friston and Kiebel, 2009). Under this generalized prediction hypothesis, top-down predictions are compared with bottom-up sensory inputs and return prediction errors when unexpected stimuli occur (Rao and Ballard, 1999; Kiebel et al., 2008; Friston, 2009; Chennu et al., 2013; Lieder et al., 2013b). Prediction errors underlie the event-related potential (ERP) response to sensory stimuli that violate learned regularities, such as the mismatch negativity (MMN) in oddball tasks (Näätänen et al., 1993; Garrido et al., 2009a; Kimura et al., 2011) and rule sequences (Bekinschtein et al., 2009; Wacongne et al., 2011; El Karoui et al., 2014).
Evidence for hierarchical prediction in human frontotemporal cortex comes from functional brain imaging. Deviant auditory stimuli evoke neural responses in bilateral auditory cortex, superior temporal gyri, and prefrontal cortex (Giard et al., 1990; Doeller et al., 2003; Molholm et al., 2005; Rinne et al., 2005; Cheng et al., 2013; Chennu et al., 2013) from which Garrido et al. (2008) found clear evidence for a frontotemporal hierarchy of prediction and prediction error message passing. The core features of this model have been replicated (Garrido et al., 2007a,b, 2009b; Dietz et al., 2014) and studied in the context of coma (Boly et al., 2011), drug treatment (Schmidt et al., 2013), and aging (Cooray et al., 2014; Moran et al., 2014). However, previous approaches lacked a mechanism to explain neural responses to absent stimuli or subtler differences in their temporal structure. Temporal regularities over multiple events are associated with high-order representations of environment and action in the prefrontal cortex (Zhang and Rowe, 2015), whereas frontostriatal interactions have been associated with learning and prediction of temporal regularities (Grahn and Rowe, 2013). We therefore proposed that internally generated inputs to prefrontal cortex are a feature of the generative models for MMN tasks with temporal regularities.
Previous imaging studies of human predictive coding in the context of MMN tasks have focused on a narrow set of deviant stimuli dimensions. However, Näätänen et al. (2004) and Hughes and Rowe (2013) observed differences in MMN amplitudes in EEG sensors and MEG dipoles for tones that deviated by frequency, intensity, location, duration, or silent gap (Näätänen et al., 2004). The latter two deviants differed significantly from the others in their distinct temporal structure. Thus, a hierarchical model should encompass multiple stimulus characteristics.
We therefore explored whether different violations of sensory regularities are associated with different interactions in a frontotemporal hierarchy. We also tested the hypothesis that there are internally generated temporal predictions, revealed in response to deviations of temporal structure. We used a Bayesian approach to compare alternate hierarchical neural networks for auditory predictive coding with multiple deviant types. We identified the optimal connectivity pattern from a set of 21 generative network models, including a subset of models with top-down expectations that influence the prefrontal cortex to implement high-level predictions of events.
Materials and Methods
Participants.
Eleven healthy adults participated in the study (seven males; mean age, 26 years, range, 18–37 years). Normal binaural hearing was confirmed immediately before the main experiment, and stimuli were presented at 60 dB above hearing threshold. Participants gave informed written consent, and the study was approved by the local research ethics committee.
Auditory paradigm.
The “Optimum-1” multi-MMN paradigm of Näätänen et al. (2004) was used to investigate MMN responses to multiple deviant types (Fig. 1). This is a time-efficient variant of the classic oddball task, alternating standard tones with one of several different deviant tones, evoking equivalent MMN amplitude responses to each type of deviant equivalent to a classic task with low-frequency oddball events (Näätänen et al., 2004). Standard tones (75 ms in duration, with 7 ms ramp up and ramp down) contained three sinusoidal partials of 500, 100, and 1500 Hz. These alternated with deviant tones that differed in one of five dimensions: shortened duration (25 ms), frequency (550, 1100, and 1650 Hz or 450, 900, and 1350 Hz), intensity (±6 dB), location of sound source (right or left instead of binaural), or the presence of a silent gap of the middle 25 ms.
MMN Optimum-1 paradigm (Näätänen et al., 2004). Standard tones (S) alternate with different deviant tones (D#).
Tones were presented every 500 ms using E-Prime software (Psychology Software Tools) via plastic tubes and earpieces. Deviant tones were presented in a pseudo-random order such that a deviant type never appeared twice in a row and each deviant type would appear at least once in a sequence of 10 tones. A total of 900 standard and 900 deviant tones were played in three blocks of 5 min. Fifteen standard tones were played at the beginning of each block.
MEG data acquisition and processing.
Data were collected with a 306-channel Vectorview system in a magnetically shielded room (Elekta Neuromag), including a magnetometer and two orthogonal planar gradiometers at each of the 102 positions. Paired EOG electrodes recorded vertical and horizontal eye movements, and five head-position indicator coils monitored head position. The three-dimensional locations of the coils and three anatomical fiducials (nasion and left and right preauricular points) were recorded using a 3D digitizer (Fastrak; Polhemus). Movement compensation and downsampling from 1 kHz to 250 Hz was completed using Maxfilter software (Elekta Neuromag). The remaining preprocessing steps were completed using SPM8 software (Wellcome Trust Centre for Neuroimaging, University College London). This included high-pass filtering at 1 Hz and low-pass filtering at 40 Hz using Butterworth filters in forward and reverse directions and epoching −100 to 400 ms around each tone onset with baseline correction of the −100 to 0 ms period. Automatic artifact rejection used thresholding of EOG electrodes at 200 μV. Trials were averaged using robust averaging (Wager et al., 2005), followed by an additional low-pass filter at 40 Hz to remove high-frequency noise that can be introduced by robust averaging.
Source space analysis.
Source reconstruction of the ERPs to standard and deviant tones was completed for the gradiometer data using SPM8. The forward model (leadfield) was estimated from a single shell template cortical mesh of each participant's anatomical T1-weighted MR image (3D MPRAGE sequence; TR, 2250 ms; TE, 2.99 ms; flip angle, 9°; field of view, 240 × 256 × 160; 1 mm slice thickness; collected on a 3T Siemens Tim Trio scanner), coregistered by digitized fiducial markers and >60 scalp points. Source waveforms of standard and deviant tones were extracted for each participant by applying the inverted leadfield matrix to estimate the six equivalent current dipoles (ECDs) of the anatomically defined sources of the MMN. The six sources approximated previously published work with the auditory oddball task (Garrido et al., 2009b; Moran et al., 2014; see Fig. 3): bilateral primary auditory cortex (A1; MNI coordinates: [−42, −22, 7], [46, −14, 8]), superior temporal gyri (STG; [−61, −32, 8], [59, −25, 8]), and inferior frontal gyri (IFG; [±46, 20, 8]). Source locations were fixed, allowing orientation of the dipoles to vary.
Group differences between standard and deviant waveform mean amplitudes were assessed over the characteristic MMN time window of 100–200 ms using paired t tests (p < 0.05) at each MMN source location. The false discovery rate (FDR) was used to correct for multiple comparisons. We also present the effect size, r. To support our hypothesis that different deviant tones are associated with different networks in the frontotemporal hierarchy, we tested the differences between individual deviants: here we used source reconstruction for each deviant MMN waveform (the difference between standard tone and each deviant tone). We then used a repeated-measures ANOVA with two factors, deviant type (duration, frequency, gap, intensity, and location) and source location (bilateral A1, STG, and IFG). This used the peak amplitudes and latencies of the MMN waveforms. Mauchly's test was used to indicate which statistics required correction using Greenhouse–Geisser estimates caused by sphericity assumption violations. Finally, each deviant mean MMN amplitude was tested for significance at the six locations using a one-sample t test to be sure significant differences found in the ANOVA were not attributable to a lack of a MMN response in some deviant types (p < 0.05 threshold for significance, FDR correction for multiple comparisons).
Network analysis.
We used dynamic causal modeling (DCM) of the effective connectivity between the six specified sources. The models included standard and deviant tones, together with their modulation by deviance, and are not restricted to modeling the mismatch response. Sources of standard and individual deviant tones were reconstructed separately using the forward modeling described above and inverted using the SPM8 DCM10 standard algorithm with default settings.
With biophysically constrained neural mass models, DCM makes inferences about the mechanisms behind observed ERPs, the coupling between ECD sources, and how experimental stimuli changes this coupling (David et al., 2006; Kiebel et al., 2006, 2009). Twenty-one generative models (Fig. 2) were used to model alternative hypotheses of the mechanism underlying the MMN, based on the anatomically motivated networks (Giard et al., 1990; Rinne et al., 2000; Optiz et al., 2002; Doeller et al., 2003; Molholm et al., 2005, Garrido et al., 2008). These described the effective connectivity between temporal and frontal sources for the time window of 0–250 ms from the onset of each stimulus, encompassing the MMN interval. All connections between MMN sources were bidirectional and modulated after Garrido et al. (2007b). DCM is agnostic as to the direct or indirect route of connections via monosynaptic or polysynaptic pathways.

The 21 DCM models used to compare frontotemporal networks associated with predictive coding. The first six models replicate the model space of Garrido et al. (2008). Models 7 and 8 add left IFG nodes, models 9–13 add lateral connections, and models 14–21 add expectation driving inputs for event onsets onto the IFG.
The first six models were a conceptual replication of Garrido et al. (2008). They begin with driving inputs into bilateral primary auditory cortex, with or without intrinsic connections within these sources (models 1 and 2), followed by the presence of bidirectional connections to bilateral STG (models 3 and 4) and bidirectional connections to right IFG (models 5 and 6). These models have been examined using oddball and roving MMN paradigms (Garrido et al., 2008, 2009b). Model 6 had the highest model evidence using Bayesian model selection (BMS; Penny et al., 2004).
We began by examining these six models to test whether the Optimum-1 MMN paradigm replicates this result for all deviant types together and separately. Then our model space was extended to include further cortical areas, inputs, and connections as follows.
First, we added bidirectional connections between left STG and left IFG and bilateral connections to both IFGs (Garrido et al., 2009b) to create models 7 and 8, respectively. These models were motivated from the debate in the literature to determine whether the left IFG is a source of the MMN (Giard et al., 1990; Alho et al., 1994; Rinne et al., 2000, 2005; Jemel et al., 2002; Opitz et al., 2002; Cheng et al., 2013).
Second, bidirectional modulated lateral connections were added between STG sources and IFG sources (models 9–13). Lateral connections are used in several DCM studies (Boly et al., 2011; Schmidt et al., 2013; Cooray et al., 2014), although only Boly et al. (2011) performed comparisons between models with and without these connections, finding that models with lateral connections had the greatest evidence in healthy adults.
Finally, we added event expectation driving inputs into the IFG sources (models 14–21), motivated by our hypothesis that with regular stimuli, there will be internally generated expectations of when a stimulus would occur (without specifying its properties).
Bayesian model selection.
BMS was used to compare the generative models (Penny et al., 2004) and discover which best explains the neural responses. BMS compares the free-energy estimate (F) of the bound on the log of model evidence of each model, lnp(y|m) (the probability of the data y given each model m). This measure of model evidence adjusts model fit for model complexity to reduce overfitting (Kiebel et al., 2009; Stephan et al., 2010). In the main analysis, we used a fixed-effects (FFX) approach, assuming our population of healthy participants use the same network architecture but have connection strength variation (Stephan et al., 2010; Dietz et al., 2014). In addition, we repeated the model and family analyses using a random-effects (RFX) approach to consider possible bias on FFX results attributable to participant outliers.
The model with the highest model evidence is often referred to as the “winning” model. A difference in model evidence between the winning and “second place” models (ΔF) of three units or more is comparable with a Bayes factor of 20, and by convention, this is regarded as strong evidence for one model over another (Kass and Raftery, 1995; Stephan et al., 2010). We also calculated the posterior probability of each model to demonstrate the probability of that model given the neural responses within the current model space. BMS was first used to compare model evidence for the first six models to replicate the model of Garrido et al. (2007a). Then we used BMS for the complete model space.
Finally, we performed a post hoc comparison of model families to assess the significance of connections required by individual deviant types by removing uncertainty about other model structural aspects (Penny et al., 2010). Specifically looking at lateral connections and prefrontal expectancy inputs, we split the model space into five families: (1) the original models of Garrido et al. (2007a; G; models 1–5); (2) models without lateral connections or prefrontal expectancy inputs (lp; models 6–8); (3) models with lateral connections (Lp; models 9–13); (4) models with prefrontal expectancy inputs (lP; models 14–16); and (5) models with both lateral connections and prefrontal expectancy inputs (LP; models 17–21). DCM and BMS were completed using SPM8.
Results
MMN source waveforms
The source waveforms were reconstructed (Fig. 3) using ECDs for each of the six MMN source locations to be used in the following DCM analysis. From these, the mean waveform amplitudes were calculated over the MMN characteristic time window of 100–200 ms for standard and all deviant tones and were compared using paired sample t tests. Each source location had a significant difference between standard and deviant tones (right A1: t = 6.28, p = 0.0001; left A1: t = 4.11, p = 0.0021; right STG: t = 4.54, p = 0.0011; left STG: t = 2.58, p = 0.0274; right IFG: t = 7.75, p < 0.0001; left IFG: t = 4.22, p = 0.0018) and remained significant after FDR correction for multiple comparisons. All comparisons achieved r > 0.5 indicative of large effect sizes.
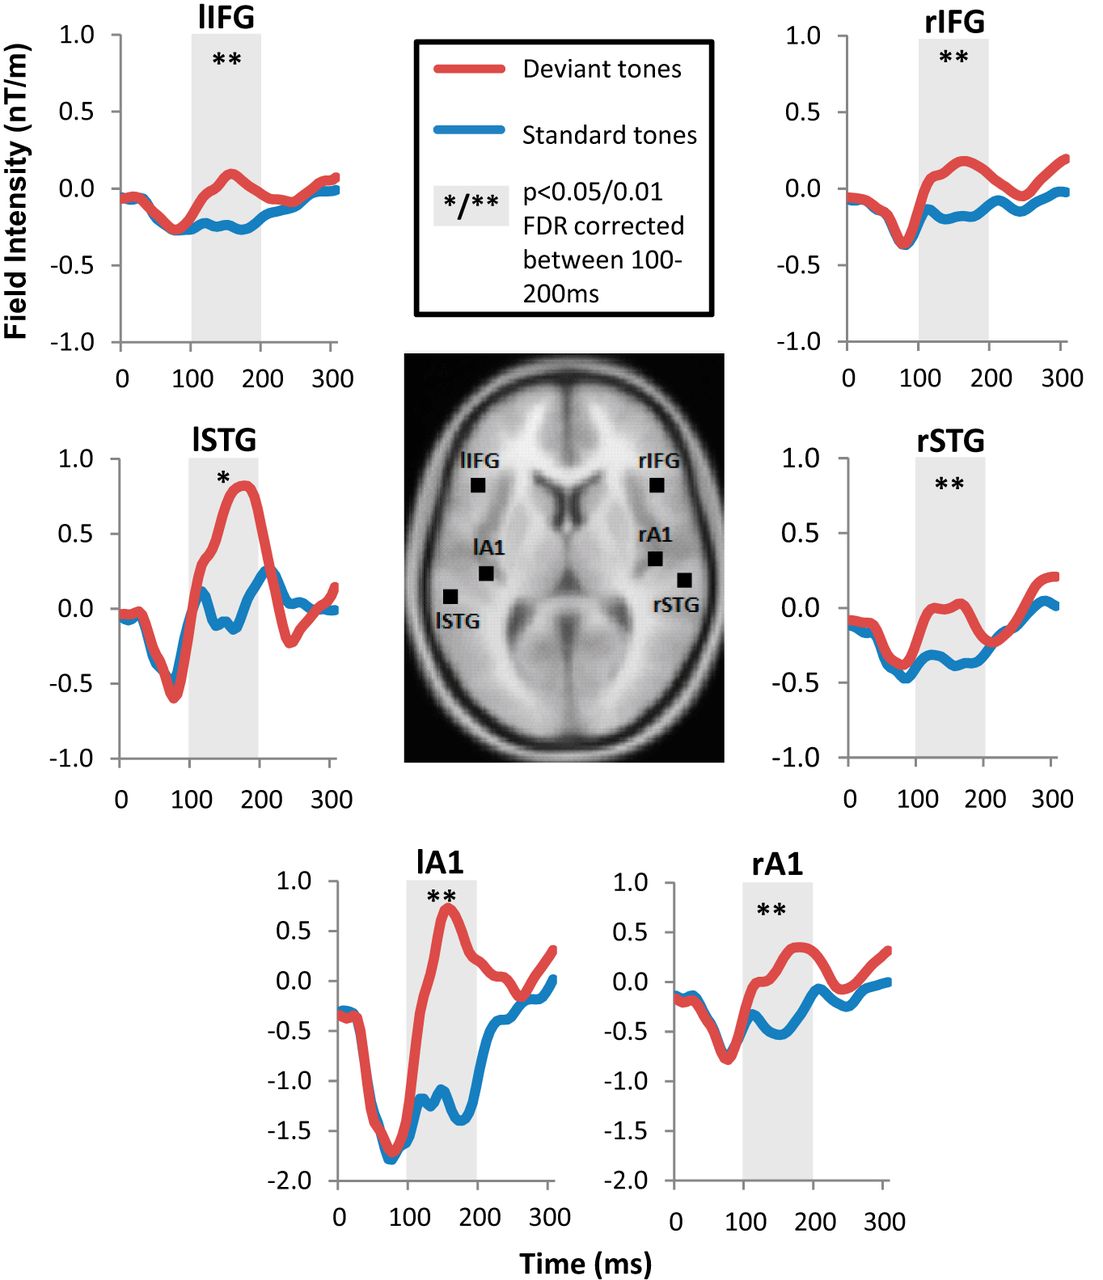
Mean source waveforms to standard (blue) and all deviant (red) events in bilateral A1, STG, and IFG MMN sources, with anatomical locations illustrated in the center. The shaded areas indicate the 100–200 ms period of the characteristic MMN-evoked response. Significant differences between standard and deviant tones using paired t tests were evident at each location as indicated (*p < 0.05 and **p < 0.01), with FDR correction for multiple comparisons. rA1, Right A1; lA1, left A1; rSTG, right STG; lSTG, left STG; rIFG, right IFG; lIFG, left IFG.
Individual deviant tone MMN waveforms are shown in Figure 4. Differences in MMN peak amplitudes and latencies were assessed using separate repeated-measure ANOVAs with two factors, ECD locations and deviant type. The main effects of deviant type and ECD location violated the sphericity assumption for peak amplitudes [χ2(9) = 19.48 and χ2(14) = 57.85, respectively] as well as the main effect of location for peak latency [χ2(9) = 19.48]. Thus the degrees of freedom were corrected by the Greenhouse–Geisser method. For peak amplitudes, there was a significant main effect of ECD location (F(1.85,18.5) = 9.84, p = 0.001) and of deviant type (F(2.05,20.5) = 7.79, p = 0.003). For peak latency, there was a significant main effect of deviant type (F(4,40) = 6.16, p = 0.001), but not of ECD location. For both peak amplitudes and peak latencies, there was not a significant interaction between ECD location and deviant type (p > 0.05). To test whether these effects may be attributable to a lack of a MMN response, the mean MMN amplitude of each deviant type at each location was tested for significance using a one-sample t test. Using FDR correction for multiple comparisons, we found all mean MMN amplitudes to be significant (p < 0.05).

MMN dipole waveforms for each deviant type, for each MMN source location. The gray area highlights the characteristic MMN period (100–200 ms). At every location, for all deviant types, there is a visible MMN waveform during this characteristic period. The mean amplitude of each waveform over 100–200 ms was tested using a one-sample t test comparison against zero mean, and all were significant (p < 0.05, FDR corrected). Please note that the color used here for each deviant type will be consistent across subsequent figures.
Hierarchical network models
We initially compared the first six models in Figure 2, which conceptually replicate the models used by Garrido et al. (2008) using Bayesian model selection with a FFX approach. Figure 5A shows very strong evidence in favor of model 6 (the winning model) with the highest relative log-evidence (F). ΔF indicates the difference between the winning and second place model evidence. All deviant dimensions achieve ΔF > 3, which is equivalent to a Bayes factor of ∼20 and represents strong evidence in favor of the winning model. The posterior probability for model 6 exceeds 0.99 for each deviant type, demonstrating the high probability of this model given the evidence, within the current model space. Repeating the analysis with a RFX approach to account for possible individual participant bias also reveals model 6 to be the winning model (with the highest model exceedance probability, P) for each deviant type: duration, p = 0.92; gap, p = 0.98; frequency, p = 0.84; intensity, p = 0.92; location, p = 0.61; all deviants together, p = 0.96. Model 6 has bidirectional connections between bilateral A1 and STG and between right STG and right IFG plus intrinsic connections in bilateral A1 as shown in Figure 5B. The winning model 6 for all deviants is equivalent to the winning model of Garrido et al. (2008), though that study used a roving MMN paradigm with frequency deviants only.

Bayesian model selection results for the first six models. A, Top row, Deviant types together and separately consistently show model 6 to win with the highest log-evidence (F) relative to the model with lowest log-evidence, which is set to zero. This is a conceptual replication of the principal result of Garrido et al. (2008), which used a roving MMN paradigm with frequency deviations. The ΔF above each winning model is the difference between the highest model log-evidence and the second place model log-evidence. A ΔF > 3 in favor of the winning model is equivalent to a Bayes factor of 20, and a ΔF > 5 is equivalent to a Bayes factor of 150. For all deviant types, model 6 has a ΔF > 5 over the second place model. Bottom row, Model 6 consistently achieves a posterior probability of >0.99 compared with the other five models. B, The winning model with the highest log-evidence (F) for all deviant types together and individually.
Using BMS with a FFX approach, Figure 6 shows the relative log-evidence (F) and posterior probabilities for the full model space (Fig. 2, models 1–21) along with the winning models for each of the separate deviant types. For each deviant type, the winning model included all the features from model 6 plus bidirectional connections between bilateral STG and/or IFG sources. For duration and gap deviant tones, the models with the highest log-evidence included expectation inputs into IFG sources and bidirectional lateral connections between IFG sources. The gap deviant also included lateral connections between STG sources (model 21) whereas duration did not (model 20). The model with the highest log-evidence for the frequency deviant included lateral connections between IFG sources (model 12), and both the intensity and location deviants' winning models included lateral connections between STG sources (model 11). All winning models exceeded a posterior probability 0.99. The differences (ΔF) between the winning and second place models are shown in Figure 7 below each winning model diagram. This analysis was repeated with a RFX approach, which showed agreement over winning models for frequency, intensity, and location deviants. For the gap deviant, there was equipoise between model 21 (FFX winning model) and model 20. The winning model for the duration deviant changed to model 16, which had the same architecture as the FFX winning model 20, but without interhemispheric connections. Across FFX and RFX findings, only deviants with temporal structure changes required prefrontal inputs, and all deviants required bilateral prefrontal sources.

Bayesian model selection for each deviant type with full model space. For each deviant type, we include the relative log-evidence and model posterior probabilities for every model, a diagram of the winning model, and the difference between winning and second place relative log-evidence (ΔF). In each plot of log-evidence, the first six bars in gray indicate the models used by Garrido et al. (2008). Both duration and gap deviants (left) reveal bilateral prefrontal expectancy inputs into the IFG sources, with lateral connections between IFG sources. The gap deviant also has lateral connections between STG sources. Frequency, intensity, and location deviant winning models do not include expectancy inputs (right). They differ within themselves by lateral connections, where frequency deviants include interhemispheric IFG sources whereas intensity and location deviants include STG interhemispheric connections. For all deviant types, the winning models have a ΔF > 5 and, therefore, are considered to have very strong evidence in favor of those models.

Family-wise model selection for each deviant dimension using both fixed- and random-effects approaches. The following model families were investigated: G, Original model space of Garrido et al. (2007a); lp, models without lateral connections or prefrontal expectancy inputs; Lp, models with lateral connections but not prefrontal expectancy inputs; lP, models with prefrontal expectancy inputs but not lateral connections; LP, models with both lateral connections and prefrontal expectancy inputs. A, FFX analysis. Duration and gap deviants had the highest model evidence (F) for the family of models with prefrontal expectancy inputs with lateral connections (LP). The posterior probability for this family was >0.99, showing strong evidence for this family for duration and gap deviant dimensions. Frequency, intensity, and location deviants instead showed strong evidence for the family of models with lateral connections but without prefrontal inputs (Lp). For these three deviant dimensions, the posterior probability for this family was >0.99. B, RFX analysis. The winning families (with the highest family exceedance probability) for frequency, intensity, location, and gap deviants match the FFX winning families. For the duration deviant, the two model families with prefrontal inputs have almost equal exceedance probabilities, one the same as the FFX result and the other without an interhemispheric connection.
Finally, we used post hoc family-level inference to assess the importance of lateral connections and prefrontal expectancy inputs for the individual deviants. The FFX results in Figure 7 show that deviants that violate temporal tone structure (duration and gap) require prefrontal expectancy inputs (model family LP), whereas the remaining deviant types do not (model family Lp). For all deviant dimensions, the winning model families include lateral connections. The analysis was repeated with a RFX approach for verification that FFX results were not biased by outliers. Figure 7B shows that frequency, intensity, location, and gap deviants have matched winning models across approaches. For the duration deviant, there is equipoise between two models (lP and LP), one the same as the FFX result and the other a nested model within it that lacks an interhemispheric connection. For both models, there is still inclusion of prefrontal expectancy inputs. Thus, there is general agreement between FFX and RFX approaches.
Discussion
This study provides evidence for hierarchical frontotemporal networks supporting the prediction of sensory information and responses to violations of these predictions. There was evidence for the following key features in the most likely network: (1) reciprocal feedforward and feedback connections between auditory cortex and STG, connections between STG and IFG bilaterally, and interhemispheric interactions; and (2) internally generated expectations as driving inputs to prefrontal cortex at the uppermost level of the model's hierarchy present for temporal structure violations.
Whereas previous studies have focused on single dimensions of deviance, we identified differences in the hierarchical frontotemporal networks underlying the response to multiple types of deviants. For all deviants, we replicate previous results from a classic oddball (Garrido et al., 2009b) and a roving (Garrido et al., 2008) paradigm in the context of an equivalent model space (Fig. 5). The results accord with the predictive coding hypothesis in which feedback predictions and feedforward prediction errors pertain to each layer of the hierarchy (Friston and Kiebel, 2009; Carlin et al., 2011). Extending the model space enabled us to test additional hypotheses of the frontotemporal interactions related to sensory prediction and mismatch error signaling. We found that winning models for frequency, intensity, and location differed subtly from each other in terms of the lateral connections between IFG and/or STG sources but were within a family of structurally similar models. Together, these data suggest generalized features in the hierarchical networks for the response to multiple types of sensory deviation.
Some previous studies modeled unilateral prefrontal cortical sources (Garrido et al., 2008; Boly et al., 2011; Schmidt et al., 2013), and others used bilateral sources (Hughes et al., 2013). We formally compared unilateral versus bilateral models and found very strong evidence in favor of bilateral frontal cortical sources, consistent with the bilateral evoked responses (Fig. 6). Moreover, we found evidence for top-down predictions in explaining the data for stimuli that differed in their duration of temporal profile. We term these high-order inputs temporal expectancy predictions. An important corollary of this prefrontal expectancy input is that it enables the network to predict auditory and STG activity even when a stimulus is omitted altogether, as in some forms of the MMN task (Raij et al., 1997; Hughes et al., 2001; Wacongne et al., 2011).
The prefrontal temporal expectancy input was important for explaining the response to duration and gap deviants, which, unlike the other deviants, are defined by a violation in the temporal structure of stimuli. Analogous temporal expectancy has been observed for beat prediction (Zanto et al., 2006; Pecenka and Keller, 2011; Teki et al., 2011a; Fujioka et al., 2012). Teki et al. (2011b) suggesting that a striato–thalamo–cortical circuit, including putamen and prefrontal areas, is involved in relative beat-based timing. Grahn and Rowe (2009, 2013) also found putamenal involvement in the prediction tones in a regular beat pattern, interacting with frontal cortex. Connectivity between the striatum and IFG would be well suited to afferent expectancy projects, and such connections are supported by autoradiographic tracer studies in rhesus monkeys (Yeterian and Pandya, 1991) and diffusion-weighted MR imaging in humans (Croxson et al., 2005), from putamen and caudate (Lehéricy et al., 2004; Novak et al., 2015). Furthermore, Postuma and Dagher (2006) identified functional connectivity between IFG, caudate, and rostral putamen.
Additionally, local context-dependent circuits have been proposed, integrated with a core timing circuit (Merchant et al., 2013). These have been observed in human visual, auditory, and parietal areas (Leon and Shadlen, 2003; van Wassenhove and Nagarajan, 2007; Bueti et al., 2008) and in in vitro recordings (Johnson et al., 2010), suggesting time-dependent cellular properties can allow local circuits to encode specific stimulus timing (Karmarkar and Buonomano, 2007). In contrast, the core timing circuit is observed across multiple stimulus modalities (Merchant et al., 2008), in the basal ganglia (Meck et al., 2008) and prefrontal cortex (Coull et al., 2011), which may have a monitoring role over stimulus durations (Rao et al., 2001) and extended sequences with regularities (Zhang and Rowe, 2015). Thus, our expectancies for temporal deviants may originate from prefrontal cortex itself or inputs from the striatum.
Although duration and gap deviants were distinct from other deviant types in the likely network model, there were important similarities between all deviants (Fig. 6), including the presence of bilateral prefrontal sources and interhemispheric connections. MMN responses to multiple deviant dimensions have been observed in EEG (Giard et al., 1995; Jemel et al., 2002; Näätänen et al., 2004; Petermann et al., 2009; Fisher et al., 2011; Chennu et al., 2013) and MEG (Hughes and Rowe, 2013). Both amplitude and latency differences were observed in auditory cortex. Several mechanisms have been proposed to explain these MMN effects. Under the adaptation and change detection hypotheses, MMNs are produced when deviant tones elicit activity from nonsuppressed neurons (May and Tiitinen, 2010) or differ from a memory trace of standard tones (Schröger and Winkler, 1995), respectively. Both imply different generator locations dependent on deviant dimension. Under the model adjustment hypothesis, MMN reflects the updating of a model of standard tones (Winkler, 2007). In contrast, the predictive coding hypothesis proposes that the MMN reflects prediction errors. In a direct comparison, predictive coding is more likely than the “phenomenological” hypotheses (Garrido et al., 2008; Lieder et al., 2013a).
The frontotemporal network underlying the detection of unexpected sensory events provides a robust framework to study the impact of disease. The auditory MMN paradigm is advantageous in part because it does not require attention or behavioral responses (for review, see Näätänen et al., 2012). For example, Hughes and Rowe (2013) showed reduced β-band frontotemporal coherence in behavioral-variant frontotemporal dementia (bvFTD). Although coherence is not directional (Fries, 2005; Bastos et al., 2012), it has been suggested that β coherence reflects feedback predictions, which in the case of Hughes and Rowe (2013) would likely be from frontal to temporal cortex. In the light of the current findings, we speculate that frontal cortical degeneration in bvFTD could alternatively impair the impact of prefrontal temporal expectancies.
Other disorders have also been investigated. Schizophrenia reduces duration–MMN amplitudes (Michie et al., 2000) in proportion to symptoms (Kärgel et al., 2014). In dyslexia, Kujala et al. (2006) observed reduced frequency deviant amplitudes, which correlated with reading skill (Baldeweg et al., 1999). Additionally, Morlet and Fischer (2014) and Daltrozzo et al. (2007) confirmed that duration deviants are robust for predicting coma outcome. These studies suggest that using the MMN for clinical research could benefit from tailoring deviant types to disorders to achieve maximal decoding ability.
Furthermore, using the MMN to study the neural responses to unexpected events is not limited to simple sensory tasks but also applies to the neurocognitive basis of higher cognitive functions (Clark, 2013). The use of a hierarchy of generative models to predict the sensorium is suggested to be the common framework behind learning (Friston and Stephan, 2007; Fletcher and Frith, 2009; Moran et al., 2013, 2014), recognition (Egner et al., 2010; Muckli, 2010), attention (Clark, 2013), and motor control (Friston et al., 2011). Here we show that even for a simple passive task with small differences in auditory stimuli, the hierarchical generative model is flexible to predict specific deviations. This supports the notion that the brain optimizes connectivity to better predict its environment in both low-level perception and higher cognitive functions (Moran et al., 2014).
There are limitations to this study. Our winning models are selected from a defined model space based on our hypothesis and prior literature, but it could be argued that other networks might be better still. However, DCM is a hypothesis testing framework, rather than an exploratory model-search technique [see Friston et al. (2013) in response to Lohmann et al. (2012)]. This is not because it is computationally intensive but because there is a greater risk of overfitting with large model sets (Friston et al., 2013). Thus, we kept to the recommendation to choose necessary and sufficient model space with which to test hypotheses. Second, we used the same prior source locations for each MMN source regardless of the deviant type examined. Molholm et al. (2005) suggested modest location differences between frequency and deviant types within the auditory and prefrontal cortices, using fMRI. However MEG is tolerant of minor (millimeter) deviations of the site of sources, in part because of its inherently lower spatial resolution. More important is the orientation of the dipole, which remained free (Garrido et al., 2007a). Third, one could potentially model the source of temporal expectancies acting on the prefrontal cortex. We did not do so, in part because striatal sources are not well observed in MEG and because potential prefrontal sources could not be specified a priori. We speculate that the temporal expectancy inputs act as a “pacemaker” prediction of temporal regularities in stimulus trains. But additional studies would be needed to test the hypothesis that expectancy inputs are important for the response to deviations from temporal isochrony. This could be undertaken using deviations from isochrony and omission instead of the qualitative differences in regular stimuli that we used.
In conclusion, the auditory multi-mismatch task reveals the presence of hierarchical frontotemporal networks for the prediction of sensory events and response to sensory deviants. We show the flexibility of this generative model hierarchy to predict multiple variations in auditory dimensions, including the temporal structure of stimuli. Furthermore, we provide new evidence for internally generated temporal expectations that influence prefrontal cortex. The role of these higher-level expectations may be particularly relevant in hierarchical networks that support higher cognitive functions and their disorders.
Footnotes
This work was supported by the Medical Research Council (Grant MC-A060-5PQ30 and a doctoral training award to H.N.P.), the Wellcome Trust (Grants 088324 and 103838 to J.B.R. and L.E.H., Biomedical Research Fellowship WT093811MA to T.A.B.), and the James F. McDonnell Foundation 21st Century Science Initiative: Understanding Human Cognition.
The authors declare no competing financial interests.
This is an Open Access article distributed under the terms of the Creative Commons Attribution License Creative Commons Attribution 4.0 International, which permits unrestricted use, distribution and reproduction in any medium provided that the original work is properly attributed.
- Correspondence should be addressed to Holly N. Phillips, MRC Cognition and Brain Sciences Unit, 15 Chaucer Road, Cambridge CB2 7EF, UK. holly.phillips{at}mrc-cbu.cam.ac.uk
This article is freely available online through the J Neurosci Author Open Choice option.


