

Article Figures & Data
Figures
- Figure 1.
miR-155 is critical for robust LPS-induced IL6 gene induction. A, B, Microglial miR and mRNA expression after LPS stimulation in vitro. Acutely isolated neonatal murine microglia from WT or miR-155−/− (miR-155KO) mice were plated and stimulated with PBS or LPS (20 ng/ml) for 4 h. Total RNA including miRs was extracted and subjected to RT-PCR for IL6, IL-1β, NOS2, and TNFα (A) or miR-155 (left), SHIP1 (middle), and IL6 (right) (B). Graphs show ΔΔCT value of LPS-treated microglia versus PBS-treated microglia. ***p < 0.001, **p < 0.01, and *p < 0.05 versus WT group; ###p < 0.001, ##p < 0.01, and #p < 0.05 versus PBS-treated group as determined by 1-way ANOVA and Tukey post hoc. Data are shown as mean ± SEM. C, IL6 contributes to LPS-induced decrease in neural differentiation in vitro. Top, 4 h LPS stimulation (20 ng/ml) of microglia leads to significant reduction in βIII-Tubulin+ neuron (red) to GFAP+ astrocyte (green) ratio in cocultured NSCs (NSCs; pictured in C and D), corrected by treatment with anti-IL6 antibody (middle) but not isotype control antibody (bottom). D, miR-155 knock-out in microglia rescues LPS-induced decrease in neuron: astrocyte ratio of cocultured NSCs (pictured). For C and D, 20× objective original magnification; scale bars, 100 μm; nuclei shown in blue (DAPI). E, Quantification of neuron: astrocyte ratio as described in C and D. White bars, NSCs cocultured with PBS-treated microglia; red bars, NSCs cocultured with LPS-treated microglia. n = 3–4 wells per group. ***p < 0.001 as determined by 1-way ANOVA and Tukey post hoc. Data are shown as mean ± SEM.
- Figure 2.
Disruption of miR-155 leads to reversal of inflammation-induced decrease in NSC proliferation and neural differentiation in the DG. A, Diagram of the hippocampal DG. ML, Molecular layer; CA, cornu ammonis. B, Timeline of experimental design. C, Representative images of inflammation-induced changes in DCX (green; immature neurons), BrdU (red; proliferating cells), and DAPI (blue; nuclei) expression in the DG of WT and miR-155−/− (155KO) mice treated with saline or LPS (1 μg) intracerebroventricularly at 7 weeks of age. Scale bar, 100 μm. D, Quantification of total BrdU+ cells in the DG. E, DCX fluorescence intensity in the DG (procedure-defined units, p.d.u.). n = at least 10 images counted from 7 animals/ group. ***p < 0.001 by 1-way ANOVA and Tukey post hoc. Data are shown as mean ± SEM.
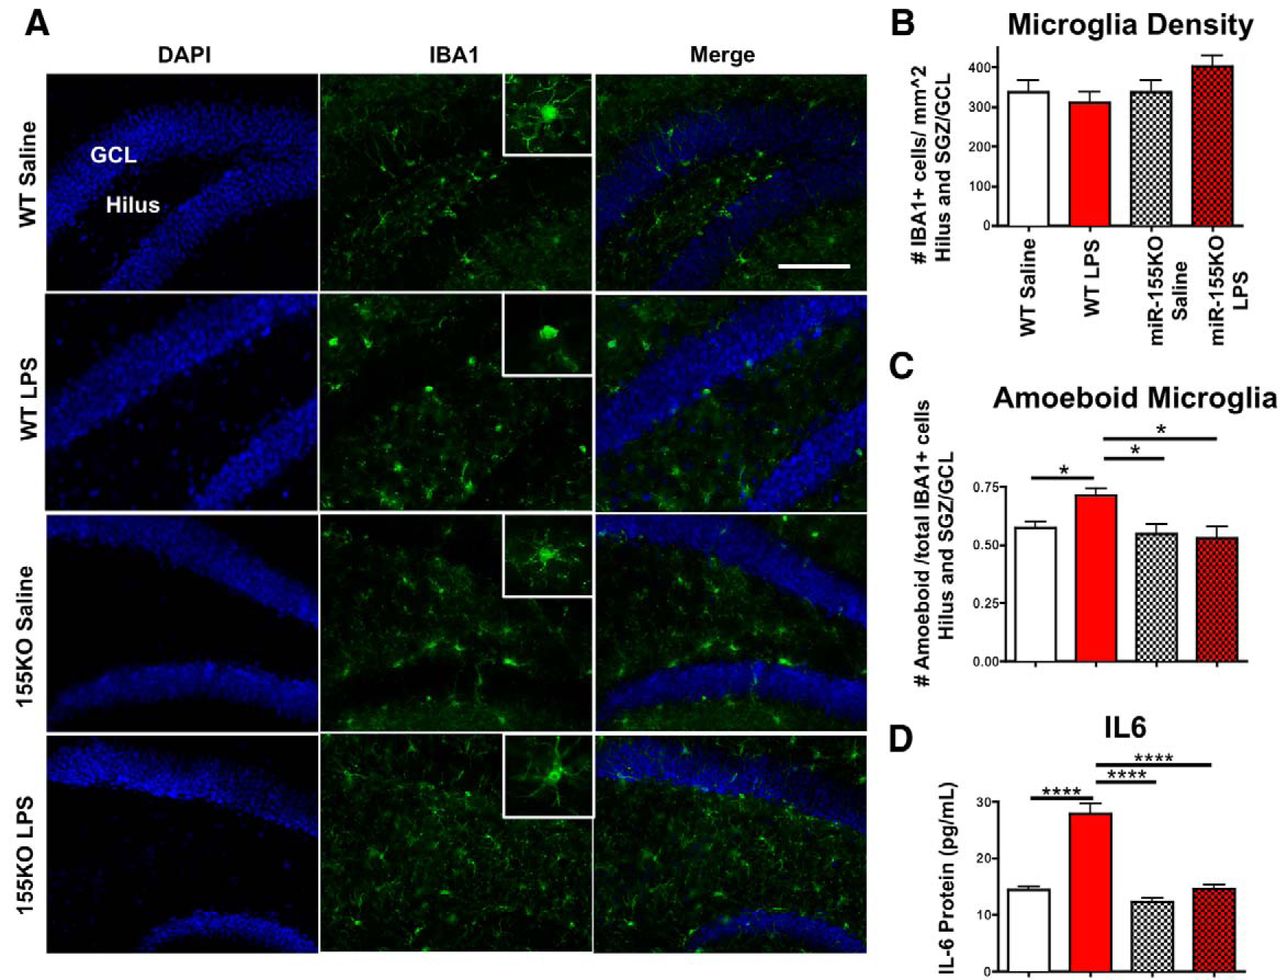
- Figure 3.
miR-155 deletion diminishes LPS-induced microglial activation and IL6 protein levels. A, Representative images of inflammation-induced changes in microglial morphology (ionized calcium binding adaptor protein-1, IBA1, green, microglial marker; DAPI, blue, nuclei marker) in the DG (including GCL, SGZ, and hilus) of WT and miR-155−/− (155KO) mice treated with saline or LPS (1 μg) intracerebroventricular at 7 weeks of age. Top left, Labeling of GCL and hilus; refer to Figure 2A for the diagram of hippocampus. B, Quantification of total IBA1+ cells in DG (including SGZ, GCL, and hilus; Fig. 2A) normalized to the size of area. C, IBA1+ microglial cell morphology shown as proportion of amoeboid out of total IBA1+ cells. D, IL6 protein expression in whole brain measured by ELISA. n = 3 animals per group; ****p < 0.0001 and *p < 0.05 as determined by 1-way ANOVA and Tukey post hoc. Data are shown as mean ± SEM.
- Figure 4.
Elevated miR-155 reduces immature neuron survival and induces their ectopic localization in the GCL. A, miR-155 transgenic mouse experimental groups and study design. Comparison of control versus miR155-hi or miR155-hi versus miR155-lo determines whether embryonic and postnatal expression of miR-155 affects neural development and maturation. Comparison of miR155-lo versus miR155-hi-adult or control versus miR155-hi-adult determines whether expression of miR-155 only in the adult phase affects neurogenesis and microglial activation. In all groups in addition to control (e.g., mice expressing miR-155 transgene), a high level of miR-155 expression is induced by the removal of DOX in any cell previously expressing nestin. B, Representative images of DCX+ immature neurons in control, miR155-hi, miR155-lo, and miR155-hi-adult DG showing their miR-155-induced ectopic localization in the GCL. The SGZ is marked by dotted white line. Left images, 10× objective original magnification; right images, 40× original magnification. Scale bars, 100 μm. C, Quantification of total DCX+ cells in DG. D, Quantification of DCX+ cells in the SGZ per millimeter. E, Quantification of ectopically located DCX+ cells in the GCL per millimeter. n = at least 5 20× original magnification images per animal from 4 to 5 animals per group. ***p < 0.001, **p < 0.01, and *p < 0.05 as determined by 1-way ANOVA and Tukey post hoc. Data are shown as mean ± SEM.
- Figure 5.
Elevated miR-155 leads to ectopic localization of radial-glia-like cells in the DG. A, Representative images of GFAP+ radial-glia-like cells in the SGZ and GCL in control, miR155-hi, miR155-lo, and miR155-hi-adult DG, showing their miR155-induced mislocalization. Original magnification = 40× objective. Scale bar, 100 μm. Arrowheads indicate ectopic GFAP+ radial-glia-like cell bodies. B, Diagram of DG showing radial-glia-like (type 1 progenitor) cells with normal cell body location in the SGZ. C, Total GFAP+ radial-glia-like cells in the SGZ per millimeter revealed no significant differences between groups. D, Ratio of GFAP+ cells in the SGZ versus GCL. n = 10–20 brain sections per group. Scale bar, 100 μm, Original objective = 40×. *p < 0.05 by 1-way ANOVA and Tukey post hoc. Data are shown as mean ± SEM.
- Figure 6.
miR-155 elevation increases proliferation in the DG. A, Representative images of Ki67 staining (a cell proliferation marker) in control, miR155-hi, miR155-lo, and miR155-hi-adult DG, with hematoxylin counterstaining. Arrows indicate Ki67+ proliferating cells. B, Quantification of Ki67+ cells in the DG. Total number of Ki67+ cells per DG was counted in at least 15 sections per group from at least 2 different animals per group and normalized by the area size. Scale bar, 100 μm, Original objective = 10×. ****p < 0.0001, ***p < 0.001, and *p < 0.05 as determined by 1-way ANOVA and Tukey post hoc. Data are shown as mean ± SEM.
- Figure 7.
Transgenic miR-155 expression increases astrocytes in the molecular layer of the DG. A, Representative images of GFAP+ astrocytes in the molecular layer (see Fig. 2A diagram) in control, miR155-hi, miR155-lo, and miR155-hi-adult mice. B, Total number of GFAP+ astrocytes per square millimeter in the molecular layer; n = 3–5 animals per group. Scale bar, 100 μm, Original objective = 10×. **p < 0.01 as determined by 1-way ANOVA and Tukey post hoc. Data are shown as mean ± SEM. C, Representative images of GFAP+ astrocytes in the DG in control, miR155-hi, miR155-lo, and miR155-hi-adult brains. Scale bar, 100 μm. Original objective = 10×. Inset shows magnification of microglia in hilus region. D, Total number of GFAP+ astrocytes per square millimeter in the hilus quantified from n = 3–5 animals per group. There were no significant differences as determined by 1-way ANOVA.
- Figure 8.
Elevated miR-155 increases microglia density in the DG and amoeboid morphology in the SGZ and GCL, but not in the hilus. A, Representative images of miR-155-induced changes in IBA1+ microglia morphology in the DG. Scale bar, 100 μm. Original magnification = 20×. Inset shows high-magnification representative IBA1+ cells. B, Density of IBA1+ cells in the DG, including SGZ, GCL, and hilus (see Fig. 2A diagram). C, Proportion of amoeboid versus total IBA1+ microglia in the hilus (white bars) and the SGZ/GCL regions (black bars) as quantified according to the microglia morphology. Morphology characterization criteria was modified from Lawson et al. (1990). n = 10–20 images counted from at least 2 animals per group. *p < 0.05 as determined by 1-way ANOVA and Tukey post hoc. Data are shown as mean ± SEM.
- Figure 9.
Cell-autonomous effects of miR-155 on NSC proliferation in vitro. A, Representative images of NSCs transfected with mock transfection (lipofectamine only), control Cy3-labeled miR mimic, or pre-miR-155 mimic and cultured for 48 h. Green, Ki67 (proliferating cells); red, nestin (stem cells); blue, DAPI (nuclei). Scale bar, 50 μm. B, Quantification of NSC purity shown as the percentage of nestin+ cells out of total cells. C, Quantification of NSCs in the cell cycle shown as the percentage of Ki67+/nestin+ cells out of total DAPI cells. D, Representative images of NSCs transfected with mock transfection, control Cy3-labeled miR mimic, or pre-miR-155 mimic and cultured for 48 h. BrdU was added to cells 24 h after plating and cells were fixed 24 h later. Green, BrdU (cells in S-phase of cell cycle); blue, DAPI (nuclei). Scale bar, 50 μm. E, Quantification of percentage BrdU+ cells out of total cells in D. For B and D, n = at least 10 20× original magnification images were quantified per group. No significant differences determined by 1-way ANOVA. Data are shown as mean ± SEM.
- Figure 10.
Cell-autonomous effects of miR-155 on neural differentiation, survival, and migration molecules of NSCs in vitro. A, Representative images of NSCs transfected with mock transfection (lipofectamine only), scramble Cy3-labeled miR mimic, or pre-miR-155 mimic and cultured for 72 h in differentiation conditions. Green, DCX; red, GFAP; blue, DAPI. Original magnification = 20×. Scale bar, 50 μm. B, Percentage DCX+ (black bars) and GFAP+ (white bars) cells with whole nuclei (live cells at fixation time) out of total cells. C, Percentage of cells with fragmented nuclei (apoptotic cells) out of total cells. D, Cleaved caspase-3 fluorescence intensity in NSCs transfected with mock, control, or pre-miR-155 mimic (procedure defined units, p.d.u; B–D) at least 10 20× original magnification images counted/ measured per group. **p < 0.01 and *p < 0.05 as determined by 1-way ANOVA and Tukey post hoc. E, Transfection efficiency of Cy3-labeled control miR mimic. Green, Cy3; red, GFAP (astrocytes); blue, DAPI (nuclei). F, RT-PCR target gene expression analysis of NSCs transfected with control or pre-miR-155 mimic. Left, Primer set 1 (see Materials and Methods for sequences), Right, Primer set 2. **ΔΔCT p < 0.01 versus control, mimic-transfected NSCs; ###p < 0.001, ##p < 0.01, and #p < 0.05 versus mock-transfected NSCs as determined by 1-way ANOVA and Tukey post hoc. Data are shown as mean ± SEM.
- Figure 11.
Non-cell-autonomous effect of miR-155 expression in microglia on NSC proliferation. A, Representative images of NSCs (pictured) indirectly cocultured with mock, scramble, or pre-miR-155 mimic-transfected microglia (MG, not pictured) in transwells for 48 h. BrdU was added to NSC medium 2 h before fixation. Red, Ki67; green, BrdU; blue, DAPI. Original magnification = 20×. Scale bar, 200 μm. B, C, Quantification of NSCs pictured in A, percentage of Ki67+ NSCs (B), and percentage of BrdU+ NSCs (C), determined from at least 10 20× original magnification images. ****p < 0.0001, **p < 0.01, and *p < 0.05 as determined by 1-way ANOVA and Tukey post hoc. Data are shown as mean ± SEM.
- Figure 12.
Non-cell-autonomous effect of miR-155 expression in microglia on neural differentiation. A, Representative images of NSCs (pictured) cocultured with mock, scramble, or pre-miR-155 mimic–transfected microglia (in transwells, not pictured) in differentiation conditions. Scale bar, 200 μm. B, Quantification of NSCs pictured in A, percentage of astrocytes (GFAP+ cells, green) out of total cells. C, Representative images of NPCs (pictured) cocultured with mock, scramble, or pre-miR-155 mimic-transfected microglia (in transwells, not pictured) in differentiation conditions for 96 h. Scale bar, 200 μm. D, Quantification of NPCs pictured in C showing percentage neurons (DCX+ cells) out of total cells. For B and D microglia (MG), at least 10 20× magnification images were counted per group. ***p < 0.001, **p < 0.01, and *p < 0.05 as determined by 1-way ANOVA and Tukey post hoc. Data are shown as mean ± SEM.


