

Article Figures & Data
Figures
- Figure 1.
Voltage-dependent properties of the simulated NMDA conductance. A, Steady-state current–voltage relationship of the NMDA conductance recorded from an isopotential model cell. The inset shows the conductance-voltage relationship. B, Relationship between NMDA gEPSP amplitude and holding potential recorded from the nexus of the apical dendritic trunk of layer 5B pyramidal neurons. The inset shows average NMDA gEPSPs recorded at the indicated holding potentials. Pooled data are shown as mean ± SEM.
- Figure 2.
Properties and distribution of HCN channels in the apical dendritic tuft. A, Averaged leak subtracted ensemble HCN channel activity recorded in outside-out patches excised from the indicated primary and secondary apical dendritic tuft sites (distance measured from the nexus of the apical dendritic trunk). The red lines represent single exponential fits to the activation of ensemble HCN channel activity. The lower trace shows the voltage test step. B, Steady-state amplitude of HCN channel activity recorded from patches excised from the nexus (open symbol, mean ± SEM, n = 30) and apical dendritic tuft sites (filled symbols). The continuous line represents the results of linear regression analysis of apical dendritic tuft data. C, A family of ensemble HCN channel currents recorded from a patch excised 159 μm from the nexus generated in response to an incremental series of negative voltage steps (lower overlain traces). The red lines represent single exponential fits to the activation of ensemble HCN channel activity. D, Activation curve of ensemble HCN channel activity measured from tail currents. The red continuous line represents a single Boltzmann function fit to the data. The black line represents a single Boltzmann function fit to data obtained at physiological temperatures. E. Voltage dependence of the kinetics of activation (filled symbols) and deactivation (open symbols) of ensemble HCN channel activity. The gray symbols show the activation kinetics at physiological temperature. Continuous lines represent fits to the data by single exponential functions. F, Reversal potential of HCN tail currents. Data were fit by a second-order polynomial function (continuous line). The drop lines show the reversal potential. The inset shows the voltage dependence of tail currents in a tuft patch excised 220 μm from the nexus. G, Temperature dependence of the steady-state amplitude and activation kinetics of ensemble channel activity evoked in response to the indicated voltage steps at room and physiological temperatures. H, Coexpression of HCN and voltage-activated potassium channels in patches excised from the apical dendritic tuft. The inward HCN current was measured just before the termination of a negative voltage step, and the outward potassium current at peak amplitude. The line is the result of linear regression analysis. The inset shows a representative sequence of ensemble HCN and potassium channel activity in a patch excised 179 μm from the nexus. Pooled data are shown as mean ± SEM.
- Figure 3.
HCN channels control resting conductance and voltage attenuation in the apical dendritic tuft. A, C, HCN channels regulate the amplitude and spread of voltage responses in the apical dendritic tuft. Traces illustrate voltage responses simultaneously recorded from the apical dendritic tuft (red traces, 143 μm from nexus electrode) and the nexus of the apical dendritic trunk (black traces), generated in response to current steps (bottom traces) delivered to either the tuft (A) or nexus (C) under control (top traces) and in ZD7288 (10 μm, middle traces). The inset shows a line reconstruction of the apical dendritic tuft and the placement of recording electrodes. B, D, Pooled data illustrating the steady-state amplitude of voltage responses at the nexus (B) or apical dendritic tuft (D) when 200 pA positive or negative currents steps were delivered to the apical dendritic tuft (B) or nexus sites (D) under control conditions (open symbols) and in ZD7288 (10 μm, filled symbols). The continuous lines represent exponential fits to the data. E, Impact of blocking HCN channels on the decremental transfer of voltage from tuft to nexus (top graph) and nexus to tuft (bottom graph) under control conditions (open symbols) and in ZD7288 (10 μm, filled symbols). Voltage responses were generated in response to −200 pA current steps. F, Impact of blocking HCN channels (ZD) on steady-state input resistance (Rin) at apical dendritic tuft (top graph) and nexus sites (bottom graph). G, Blocking HCN channels unmasks tuft electrogenesis. Traces illustrate simultaneously recorded tuft (159 μm from nexus, red traces) and nexus (black traces) voltage responses evoked by a 400 pA current step injected through the tuft electrode, under control (top traces) and in ZD7288 (10 μm, bottom traces). Note the generation of a local apical dendritic tuft spike in ZD7288, when the resting membrane was repolarized to control values (−61 mV). H, Pooled data demonstrating the augmentation of local apical dendritic spike initiation by blocking HCN channels (ZD) at the tuft site of generation (top graph), and the decremental spread to the nexus (bottom graph).
- Figure 4.
HCN channels inhibit excitatory input in the tuft. A, Simultaneous apical dendritic tuft (155 μm from the nexus electrode, top traces) and nexus (bottom traces) recording of a family of gEPSPs generated at the tuft recording site by AMPA conductance changes (middle traces), under control conditions (black) and in the presence of ZD7288 (10 μm, blue traces). Note the generation of small amplitude apical dendritic tuft spikes in ZD7288. The inset shows a photomicrograph of the recorded neuron and a schematic representation of the dynamic clamp. B, Pooled data illustrating the peak membrane potential (V peak) achieved by gEPSPs generated by AMPA conductance changes at the tuft site of generation (left graph) and the nexus (right graph) under control (black symbols), and ZD7288 (blue symbols). C, Tuft (top traces) and nexus (bottom traces) voltage responses generated by a family of AMPA and NMDA conductance changes (middle traces). Note the generation of both apical dendritic tuft and nexus electrogenesis in ZD7288 (blue traces), same neuron as A. D, Pooled input–output relationships under the indicated conditions generated by AMPA and NMDA conductance changes. Note the crossing of control (black) and ZD7288 (blue) input–output curves, which reflects the generation of tuft and nexus electrogenesis. Pooled data are shown as mean ± SEM.
- Figure 5.
HCN channels regulate the impact of tuft synaptic nonlinearities. A, Photomicrograph of the apical dendritic tuft of a layer 5B pyramidal neuron showing the placement of the recording electrode at the nexus of the apical dendritic trunk and the position of the dendritic tuft branch (yellow box) used for multisite 2-photon glutamate uncaging. The positions of uncaging points (yellow symbols) and the branch line scan (yellow line) are shown at higher magnification in the inset. B, Families of nexus-recorded voltage responses (top traces) and apical dendritic tuft branch Oregon green BAPTA-6F signals (bottom traces) evoked by near synchronous glutamate uncaging to the head of an increasing number of dendritic tuft spines (shown in A, inset) under the indicated conditions. Note the nonlinear increase in the amplitude of voltage and calcium signals. Threshold responses have been illustrated by colored traces, corresponding to the activation of 9 (control, green), 12 (ZD7288, 10 μm, blue) or 9 spines (ZD7288 + nexus membrane repolarization, ZD + DC, red). C, D, Input–output relationship under the indicated conditions measured by nexus voltage recording (C) and apical dendritic tuft branch calcium imaging (D). Data from the neuron illustrated in A and B. E, Summary of the peak amplitude of nexus voltage responses under the indicated conditions, which were accompanied by threshold local calcium signals. F, The number of activated spines required to generate suprathreshold nexus voltage and local apical dendritic tuft branch calcium signals under the indicated conditions.
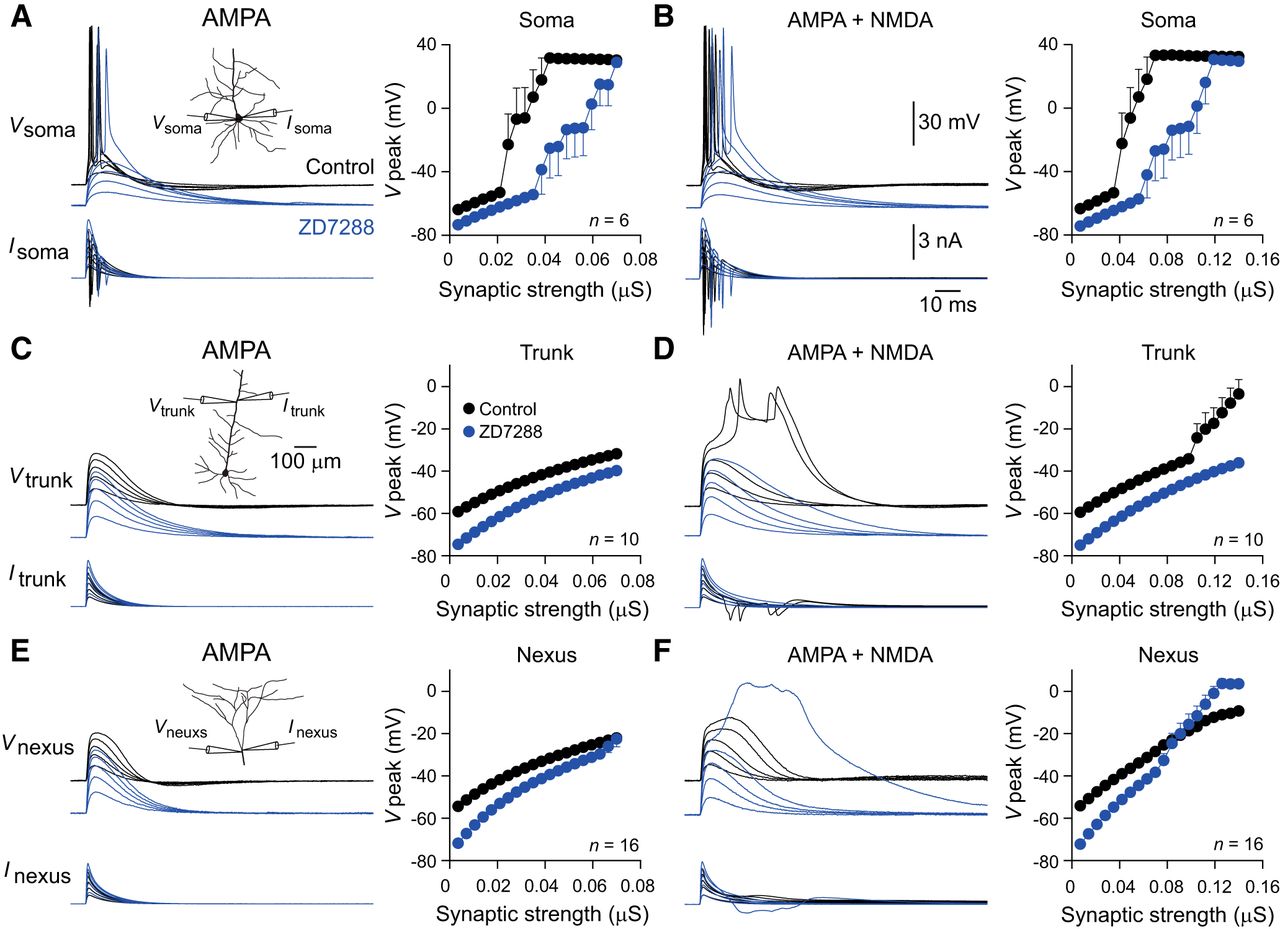
- Figure 6.
Site-dependent control of excitability by HCN channels. A, B, The blockade of HCN channels inhibits somatic excitability. Input–output relationship generated by a family of AMPA (A) and AMPA and NMDA (B) conductance changes generated and recorded from the soma under control (black traces and symbols) and ZD7288 (10 μm, blue traces and symbols). Data have been pooled from n = 6 neurons. Note the input–output relationship is shifted rightwards in ZD7288. The insets in A, C, and E show schematic reconstructions of the recorded neurons. Pooled data are shown as mean ± SEM. C, D, The blockade of HCN channels inhibits apical dendritic trunk excitability. The blockade of HCN channels (ZD7288, 10 μm, blue traces and symbols) decreases the peak potential (V peak) reached by gEPSPs generated by AMPA conductance changes (C) and inhibits action potential firing evoked by AMPA and NMDA conductance changes (D). The illustrated simultaneous recording was made 323 μm from the soma. E, F, The blockade of HCN channels has excitatory actions at the nexus of the apical dendritic trunk. Simultaneous apical dendritic nexus recording (722 μm from the soma) demonstrates that the blockade of HCN channels (ZD7288, 10 μm, blue traces and symbols) decreased the peak potential (V peak) reached by gEPSPs generated by AMPA conductance changes (E), but facilitated the generation of dendritic trunk spikes by AMPA and NMDA conductance changes (F).
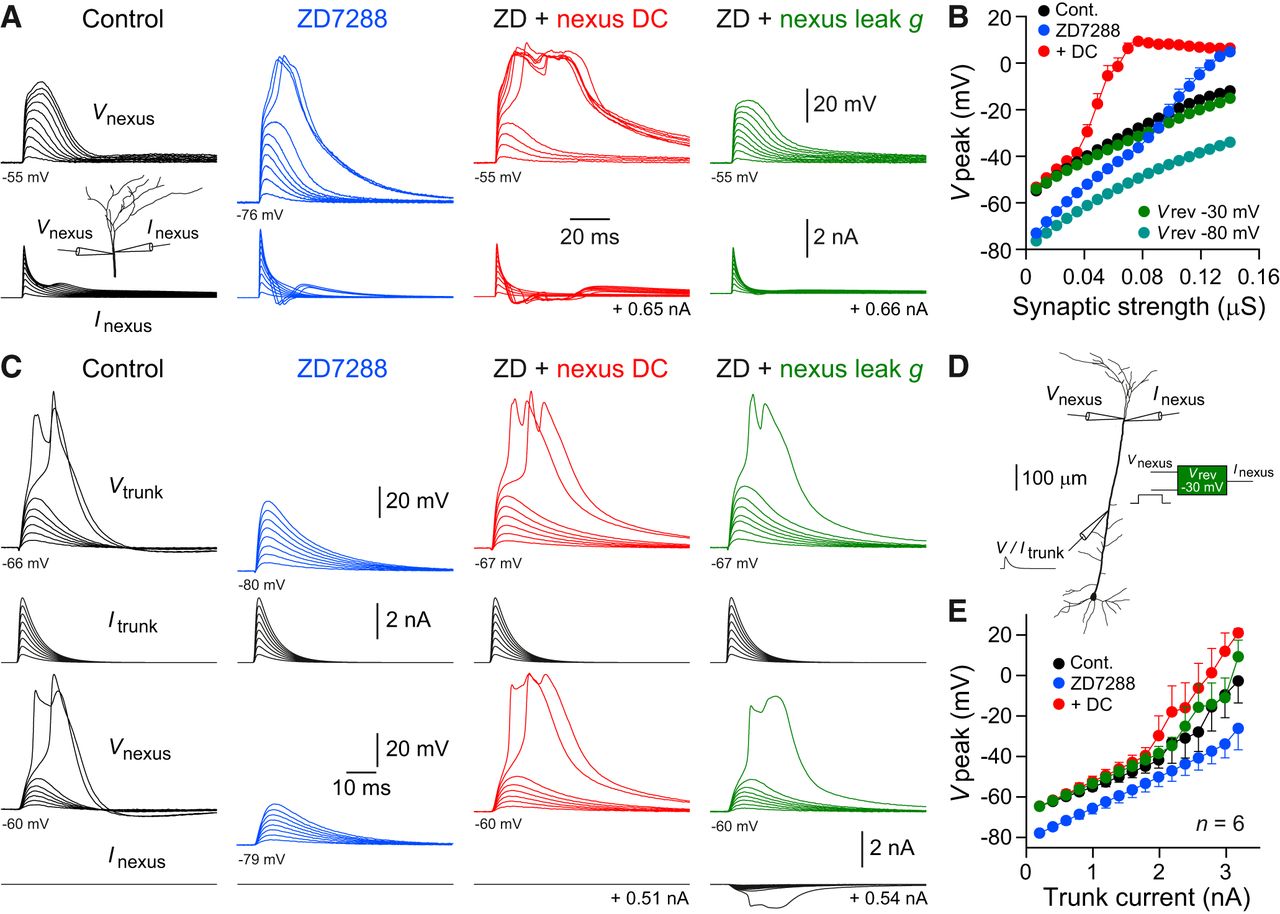
- Figure 7.
The site-dependent control of excitability is replicated by a distal dendritic excitatory leak conductance. A, Simultaneous apical dendritic nexus recording (741 μm from the soma) illustrates families of gEPSPs (top traces) generated by AMPA and NMDA conductance changes (bottom traces, NMDA:AMPA ratio = 1:1) under control conditions, after blockade of HCN channels (ZD7288 10 μm), and when the membrane potential was restored to control values by tonic DC current injection (ZD + nexus DC) or by a simulated excitatory leak conductance (ZD + nexus leak g; reversal = −30 mV). The value of positive current injected through one of the recording electrodes is indicated. The inset shows a schematic reconstruction of the neuron and placement of recording electrodes. B, Pooled input–output relationships show that repolarization of the nexus membrane potential in ZD7288 by the injection of DC current facilitates dendritic spike generation, but repolarization with an excitatory conductance (V reversal = −30 mV) is inhibitory (n = 24). Note the inhibitory actions of the leak conductance when the reversal potential is set to the resting potential in ZD7288 (n = 13). Conditions are delineated by color, pooled data are shown as mean ± SEM. C, D, Simultaneous apical dendritic trunk (top voltage traces, 423 μm from the soma) and nexus (bottom voltage trace, 770 μm from the soma) recordings illustrate input–output relationships generated at the proximal recording site in response to a family of EPSC-shaped current waveforms (top current traces) under the indicated conditions (C). Note the hyperpolarized membrane potential and failure to evoke neuronal output in ZD7288 (10 μm), which was restored by repolarization of the nexus membrane potential by the injection of DC current (ZD + nexus DC) and by a nexus excitatory leak conductance (ZD + nexus leak g; reversal = −30 mV). The experimental arrangement is schematically represented in D. E, Pooled input–output relationships show that repolarization of the nexus membrane potential by the injection of DC current or an excitatory conductance enhances action potential generation in response to the proximal dendritic trunk excitatory input. Conditions are delineated by color as in C, pooled data are shown as mean ± SEM.
- Figure 8.
HCN channels control the invasion of apical dendritic trunk spikes into the tuft. A, Simultaneous nexus voltage recording (top traces) and distal apical dendritic tuft Oregon green BAPTA 6F calcium imaging (bottom traces) demonstrates that the blockade of HCN channels (ZD7288 10 μm, blue traces) enhances dendritic trunk spike-triggered apical dendritic tuft calcium signaling. The position of the recording electrode and line scan used for calcium imaging (yellow bar) are shown in the inset. B, Summary of dendritic trunk spike-evoked distal apical dendritic tuft calcium signaling under control (Cont.), ZD7288 (10 μm, ZD) and after membrane repolarization (+ DC) conditions. Large colored symbols represent mean ± SEM. C, Dual apical dendritic nexus recording (701 μm from the soma) illustrates the decrease in the rheobase current (bottom traces) required to evoke an apical dendritic trunk spike (top traces) when HCN channels were blocked with ZD7288 (10 μm, blue traces), despite dramatic membrane hyperpolarization. The total injected current was not altered when the membrane was repolarized in ZD7288 (red traces). D, Simultaneous apical dendritic nexus (top traces, 782 μm from the soma, Vm = −60 mV) and tuft (bottom traces, 954 μm from the soma, Vm = −59 mV) recording of apical dendritic trunk spikes evoked by rheobase positive current steps under the indicated conditions. Note that coapplication of the voltage-gated potassium channel blocker quinidine (Quin. [25 μm]) dramatically prolonged apical dendritic trunk spikes. The placement of recording electrodes is shown in the inset. E, Pooled data illustrating the integral of apical dendritic tuft voltage responses under the indicated conditions. Large colored symbols represent mean ± SEM.


