

Article Figures & Data
Figures
- Figure 1.
Generation of transgenic mice expressing a fusion protein, either UbG76V-GFP-Syb2 or GFP-Syb2. A , Schematic diagrams of constructs for generating transgenic mice expressing either UbG76V-GFP-Syb2 or GFP-Syb2, directed by a neuron-specific Thy1 promoter. The asterisk (ub*) denotes a point mutation (G76V) at the last residue of the C terminus of the Ub, which prevents the removal of Ub from its substrate. B , Western blot analysis of total brain and spinal cord homogenates prepared from 3-month-old nontransgenic control, GFP-Syb2, and UbG76V-GFP-Syb2 mice, probed with anti-GFP antibodies and then reprobed with antibodies against VCP. Anti-GFP antibodies recognize a single band predicted by the size of the fusion protein, either GFP-Syb2 or UbG76V-GFP-Syb2. C , D , Western blot analysis of spinal cord homogenates prepared from nontransgenic (control), UbG76V-GFP-Syb2 transgenic (line 1), and UbG76V-GFP-Syb2 transgenic (line 2) mice (three mice in each group, 3 months of age) and probed with antibodies against Syb2, which recognizes both endogenous Syb2 and UbG76V-GFP-Syb2. The blot was reprobed with anti-syntaxin1 antibodies. The endogenous Syb2 was abundant in both nontransgenic and transgenic mice, whereas UbG76V-GFP-Syb2 was detected only in the transgenic mice at a level markedly lower than those of the endogenous Syb2. This is quantified by the bar graph on the right comparing the levels of UbG76V-GFP-Syb2 expression relative to the endogenous Syb2 ( D ). E , F , Western blot analysis of spinal cord homogenates from nontransgenic (control), GFP-Syb2 transgenic, and UbG76V-GFP-Syb2 transgenic (line 1) mice (three mice in each group, 3 months of age), probed with antibodies against Syb2. Relative expression levels (compared with endogenous Syb2) are shown in the bar graph ( F ). G , H , Western blot analysis of spinal cord homogenates from nontransgenic control and UbG76V-GFP-Syb2 transgenic mice (3, 6, and 8 months of age, three pairs of mice in each age group). Expression levels of UbG76V-GFP-Syb2 remained at a steady-state level at 3, 6, and 8 months of age ( H ).
- Figure 2.
Localization of UbG76V-GFP-Syb2 or GFP-Syb2 in motor axons and nerve terminals. A , Whole-mount immunofluorescence staining of triangularis sterni muscles in UbG76V-GFP-Syb2 and nontransgenic control mice at P0, viewed under GFP fluorescence (green), anti-Syntaxin1 staining (blue), and Texas-Red-conjugated α-bungarotoxin for AChRs (red). GFP fluorescence is detected along the nerve trunk (arrow) and nerve terminals (arrowheads) in UbG76V-GFP-Syb2 mice. Insets at the top right corner of each panel show high-power views of individual nerve terminals; GFP puncta were readily detectable at the nerve terminal. B , Images of single nerve terminals obtained from teased thigh muscle fibers in UbG76V-GFP-Syb2 mice (5 months of age). Top green panels show GFP fluorescence; middle red panels show nerve terminals labeled by antibodies against Syntaxin1, Syb2, or SV2. Merged images show the localization of GFP fluorescence at the nerve terminals. C , Confocal images of whole-mount triangularis sterni muscle from nontransgenic control, UbG76V-GFP-Syb2, and GFP-Syb2 mice (5 months of age), viewed under GFP fluorescence (green), anti-synaptotagmin-2 (cyan), and Alexa Fluor 647-conjugated α-bungarotoxin for AChR (red). GFP fluorescence is localized along preterminal axons (arrows) and nerve terminals (arrowheads) in both UbG76V-GFP-Syb2 and GFP-Syb2 transgenic mice. Scale bars: A , 100 μm; A , insets, 20 μm; B , 20 μm; C , 50 μm.
- Figure 3.
Expression and localization of UbG76V-GFP-Syb2 and GFP-Syb2 in motor neurons. A–D , Cross sections of the ventral horn of lumbar spinal cords from GFP-Syb2 ( A , 5-month-old) and UbG76V-GFP-Syb2 mice ( B , 1-month-old; C , 5-month-old; D , 8-month-old), counterstained with TO-PRO-3 to label nuclei ( A , arrow). Merged images are shown to illustrate the distribution of GFP fluorescence (green) and nuclei (red; an example is shown by an arrow in A ). In both GFP-Syb2 and UbG76V-GFP-Syb2 mice, GFP-positive labeling is detected in the neuropil (*) surrounding the somata. In addition, GFP-positive puncta (arrowheads in B–D ) are detected within the somata of motor neurons in UbG76V-GFP-Syb2 mice. A similar labeling pattern is observed in UbG76V-GFP-Syb2 mice at 1, 5, and 8 months of age. E–M , Confocal images of spinal motor neurons from non-Tg control (top), GFP-Syb2 (middle), and UbG76V-GFP-Syb2 mice (bottom), immunolabeled with anti-GM130 antibodies (red). Merged image shows that GFP-positive puncta are closely associated with cis-Golgi (labeled by anti-GM130 antibodies). N–S , High-magnification images of motor neurons in the ventral horn of lumbar spinal cord, immunolabeled with anti-Syb2 antibodies (red) that recognize endogenous Syb2 but not the fusion protein UbG76V-GFP-Syb2. In both UbG76V-GFP-Syb2 and non-Tg control mice, Syb2-positive puncta (arrowheads in P and S ) are detected outside of the motor neuron somata. Dashed lines in A–D , G , J , M , P , and S demarcate the boundary of the motor neuron somata. Scale bars: A–D , 50 μm; E–M , 20 μm; N–S , 20 μm.
- Figure 4.
Neuron-specific expression of UbG76V-GFP-Syb2 leads to adult-onset paralysis and progressive degeneration of motor nerve terminals. A , external phenotype of an 8-month-old UbG76V-GFP-Syb2 transgenic mouse, compared with a nontransgenic littermate control mouse. The UbG76V-GFP-Syb2 transgenic mouse is paralyzed at this age. B , Kaplan–Meier survival curve of UbG76V-GFP-Syb2 (N = 131), GFP-Syb2 (N = 118), and nontransgenic control mice (N = 63). The majority of the UbG76V-GFP-Syb2 mice died within 12 months of age. C , Cross sections of ventral spinal cords immunostained with anti-GFAP antibodies. GFAP-positive astrocytes (arrowheads) are markedly increased in UbG76V-GFP-Syb2 mice, compared with GFP-Syb2 or non-Tg control mice. Dashed lines mark the boundary of the ventral horn. D , Quantitative analysis of the NMJs in the fourth lumbrical muscles from hemizygous UbG76V-GFP-Syb2 mice, compared with age-matched littermate control mice. The numbers of the NMJs obtained from three pairs of mice at each age are as follows: 1 month (control, n = 356; UbG76V-GFP-Syb2, n = 420); 3 months (control, n = 411; UbG76V-GFP-Syb2, n = 327); 5 months (control, n = 301; UbG76V-GFP-Syb2, n = 357); 8 months (control, n = 325; UbG76V-GFP-Syb2, n = 320). E , More than 60% of end-plates (EPs) in UbG76V-GFP-Syb2 mice at 5 months of age, and >90% at 8 months of age, are either partially denervated or totally denervated. In contrast, 100% of the NMJs in control mice are fully innervated at 1, 3, 5, and 8 months of age. F , Motor neuron morphology (black arrowheads) revealed by Toluidine Blue-stained semithin (1 μm) sections of the ventral horn of lumbar spinal cord from UbG76V-GFP-Syb2 and nontransgenic littermate control mice (8 months of age). G , Quantification of motor neuron numbers from transverse sections (at 10 μm thickness) of lumbar spinal segments (L3–L5). At 6 months of age, motor neuron numbers (n = 3006 ± 35, N = 3 mice) in UbG76V-GFP-Syb2 mice were similar to non-Tg control mice (n = 2875 ± 120, N = 3 mice). At 8 months of age, motor number numbers were significantly (p = 0.0012) decreased in UbG76V-GFP-Syb2 mice (n = 1933 ± 106, N = 3 mice), compared with age-matched non-Tg control mice (n = 2715 ± 35, N = 3 mice). H , I , Cross section of lumbrical muscles from non-Tg control and UbG76V-GFP-Syb2 mice (8 months of age): black arrowhead in I points to a cluster of atrophic muscle fibers in UbG76V-GFP-Syb2 mice. J–O , The NMJ morphology in homozygous GFP-Syb2 and UbG76V-GFP-Syb2 mice (7 weeks of age). A small bundle of teased thigh muscle fibers ( J , M , phase contrast) from GFP-Syb2 ( J–L ) and UbG76V-GFP-Syb2 mice ( M–O ) were labeled with Texas Red-conjugated α-bungarotoxin ( L , O ). The nerve terminals were identified by the presence of GFP fluorescence ( K , N ). In GFP-Syb2 mice, motor nerve terminals appear in a typical “pretzel-like” shape (arrow in K ). In contrast, in UbG76V-GFP-Syb2 mice, nerve terminals appear shrunken (1 in N ) or swollen (2 and 3 in N ); muscle fibers appear atrophic (* in M ), and two of five muscle fibers are completely denervated (4 and 5 in O ). Scale bars: C , 200 μm; E , 50 μm; F , 20 μm; H , I , 50 μm; J–O , 50 μm.
- Figure 5.
Ultrastructure of motor neuron in UbG76V-GFP-Syb2 mice. A , B , Representative electron micrographs (low-power view) of an example of lumbar spinal motor neuron from nontransgenic control mice ( A ) and UbG76V-GFP-Syb2 mice ( B , 8 months of age); both somata contain a large round-shaped nucleus (N) with a prominent nucleolus and organelle-rich cytoplasm. Blood vessels (BV) are frequently observed. C , D , High-power electron micrographs of motor neuron soma from control ( C ) and UbG76V-GFP-Syb2 mice ( D ), showing subcellular organelles including mitochondria (M), Golgi apparatus (Golgi), rough endoplasmic reticulum (rER), and lysosomes (Ly). E–G , Synapses on motor neuron in UbG76V-GFP-Syb2 mice ( E , G ) and control mice ( F ; 8 months of age). Numerous synapses (arrowheads) are found on the plasma membrane of motor neuron soma in UbG76V-GFP-Syb2 mice ( E , low-power view; G , high-magnification view of the region in E marked by the rectangular area) showing features similar to those of the synapses on motor neuron soma in control mice ( F ). Scale bars: A , B , 10 μm; C , D , 1 μm; E , 1 μm; F , G , 1 μm.
- Figure 6.
Age-dependent impairment of neuromuscular synaptic transmission in UbG76V-GFP-Syb2 mice. A , B , Sample traces of mEPPs ( A ) and EPPs ( B ) from control and UbG76V-GFP-Syb2 mice (1 and 8 months of age). C , D , Quantification of mEPP frequency ( C ) and amplitude ( D ) in control and UbG76V-GFP-Syb2 mice at 1, 3, 5, 8, and 10 months of age. After 3 months of age, mEPP frequency is significantly decreased in UbG76V-GFP-Syb2 mice compared with age-matched controls. p = 0.0218 (3 months of age); p = 0.0144 (5 months of age); p = 0.0382 (8 months of age); p = 0.0035 (10 months of age). In contrast, mEPP amplitudes remained similar between control and UbG76V-GFP-Syb2 mice. E , F , Quantification of EPP amplitudes ( E ) and quantal content ( F ). After 5 months of age, EPP amplitudes are significantly reduced in UbG76V-GFP-Syb2 mice, compared with controls. p = 0.0156 (5 months of age); p = 0.0055 (8 months of age); p = 0.0049 (10 months of age). F , Quantal content is also significantly decreased at 5, 8, and 10 months of age in UbG76V-GFP-Syb2 mice compared with controls. p = 0.0413 (5 months of age); p = 0.0135 (8 months of age); p = 0.0030 (10 months of age). The number of muscle fibers and mice analyzed: control (n = 44 muscle fibers, N = 4 mice); and UbG76V-GFP-Syb2 mice (n = 28 muscle fibers, N = 3 mice).
- Figure 7.
Use-dependent impairment of neuromuscular synaptic transmission in UbG76V-GFP-Syb2 mice. A , B , Sample EPP traces evoked by a 1-s-duration train containing an increasing frequency of stimuli (10, 30, 50, 70, 100, and 150 Hz). Traces in each column are recorded from the same muscle cell. In control mice ( A ), EPPs follow closely with increasing frequency of stimulation from 10–150 Hz. In UbG76V-GFP-Syb2 mice, EPPs fail to follow at high frequencies of stimulation; transmission failure first appears at 30 Hz ( B , arrowheads point to stimulus artifact). C , Quantification of success rates (the percentage of EPP responses as a function of the frequency of stimulation) between control mice (open bar) and UbG76V-GFP-Syb2 transgenic mice (filled bar) at 10, 30, 50, 70, 100, and 150 Hz. With increasing stimulation frequency, the rates of successful synaptic transmission are significantly decreased in UbG76V-GFP-Syb2 mice. Control mice: n = 15 muscle fibers, N = 3 mice; UbG76V-GFP-Syb2 mice: n = 18 muscle fibers, N = 3 mice. p = 0.0107 (30 Hz); p = 0.0135 (50 Hz); p = 0.0132 (70 Hz); p = 0.0014 (100 Hz); and 1.367 × 10⁻⁸ (150 Hz). D , Quantification of success rates as a function of age in response to a 1 s train at 100 Hz (1 s) in control mice (open bar) and UbG76V-GFP-Syb2 mice (filled bars). The number of muscles (n) and the number of mice (N) analyzed at each age group are listed as follows: 1-month-old group: control mice, n = 15, N = 3; UbG76V-GFP-Syb2 mice, n = 15, N = 3; 3-month-old group: control mice, n = 15, N = 3; UbG76V-GFP-Syb2 mice, n = 14, N = 3, p = 0.005; 5-month-old group: control mice, n = 14, N = 3; UbG76V-GFP-Syb2 mice, n = 15, N = 3, p = 0.0089; 8-month-old group: control mice, n = 12, N = 3; UbG76V-GFP-Syb2 mice, n = 12, N = 3, p = 5.493 × 10⁻⁶; 10-month-old group: control mice, n = 15, N = 3; UbG76V-GFP-Syb2 mice, n = 15, N = 3, p = 3.891 × 10⁻⁷; 12-month-old group: control mice, n = 12, N = 3; UbG76V-GFP-Syb2 mice, n = 12, N = 3, p = 7.693 × 10⁻⁸). Calibration: the line underneath the 30 Hz example applies to both the 10 and 30 Hz traces; the line underneath the 150 Hz example applies to 50, 70, 100, and 150 Hz panels (traces represent the first 200 ms of the recording).
- Figure 8.
Analysis of ubiquitin, deubiquitinating enzymes, and proteasome activity. A , Spinal cord homogenates from control and UbG76V-GFP-Syb2 mice (8 months of age) separated by stepping gel (8% and 12%) and probed with anti-polyubiquitin antibodies. B , Proteasome activity, including ChT-L, trypsin-like, and PGPH activity is similar between control and UbG76V-GFP-Syb2 mice (N = 3 pairs, 8 months of age). C , Spinal cord homogenates from control, GFP-Syb2, and UbG76V-GFP-Syb2 mice (8 months of age) were probed with anti-GFP antibodies and then reprobed with anti-UchL1 antibodies (PGP9.5). UchL1 levels are similar among all three genotypes. D , Spinal cord homogenates from control, GFP-Syb2, and UbG76V-GFP-Syb2 mice (8 months of age) were probed using anti-Usp14 antibodies. Both isoforms of Usp14 are expressed at similar levels in all three genotypes. E–P , Teased thigh muscle fibers from control, GFP-Syb2, and UbG76V-GFP-Syb2 mice (5 months of age) were immunostained with anti-UchL1 antibodies and costained with α-bgt. UchL1 is localized at the NMJs in UbG76V-GFP-Syb2 mice ( N ), in a pattern similar to that seen in control mice ( F ) and GFP-Syb2 mice ( J ). Scale bars: (in P ) E–P , 30 μm.
- Figure 9.
Neuromuscular synaptic activity is normal in UbG76V-GFP transgenic mice. A , Sample traces of mEPPs recorded from the lumbrical muscles from control and UbG76V-GFP mice (8 months of age). B , Quantification of mEPP frequencies (UbG76V-GFP mice: 1.39 ± 0.05 Hz, n = 13; control mice: 1.36 ± 0.05 Hz, n = 15). No significant difference is found between UbG76V-GFP and control mice. C , EPPs recorded from the lumbrical muscles from UbG76V-GFP and control mice (8 months of age). D , Quantification of EPP amplitudes. EPP amplitudes are similar between UbG76V-GFP mice (25.82 ± 0.80 mV, n = 13 muscle fibers, N = 3 mice) and control mice (26.76 ± 0.61 mV, n = 15 muscle fibers, N = 3 mice). E , EPPs recorded from the lumbrical muscles in UbG76V-GFP and control mice (8 months of age) in response to a 1 s, 100 Hz train stimulation (only the first 20 EPPs are displayed). Similar responses are detected from UbG76V-GFP and from control mice.
- Figure 10.
Normal synaptic activity at the NMJs in UbG76V-GFP-Syntaxin1 mice. A , A schematic diagram of the design of the construct for generating UbG76V-GFP-Syntaxin1 transgenic mice. Syx1, Syntaxin1. B , Western blot analysis of spinal cord homogenates from three lines of UbG76V-GFP-Syntaxin1 transgenic mice, probed with antibodies against syntaxin1. C , Western blot analysis of spinal cord homogenates, illustrating expression levels of transgene among UbG76V-GFP-Syntaxin1, UbG76V-GFP-Syb2, and GFP-Syb2 mice. D , The NMJ morphology in the triangularis sterni muscle of an 8-month-old UbG76V-GFP-Syntaxin1 transgenic mouse, labeled by anti-Syt2 antibodies and Texas-Red-conjugated α-bungarotoxin. Note that the nerve terminals are intensely labeled by GFP and Syt2. E , Frozen sections (12 μm thickness) of the ventral horn of spinal cords from UbG76V-GFP-Syntaxin1 mice (8 months of age), viewed under epifluorescence. GFP fluorescence is uniformly distributed. F , Sample traces of mEPPs recorded from the lumbrical muscles from UbG76V-GFP-Syntaxin1 and control mice (8 months of age). G , Quantification of mEPP frequency (UbG76V-GFP-Syntaxin1 mice: 1.26 ± 0.11 Hz, n = 22; control mice: 1.31 ± 0.14 Hz, n = 17) and amplitude (UbG76V-GFP-Syntaxin1 mice: 1.07 ± 0.10 mV, n = 22; control mice: 1.15 ± 0.08 mV, n = 17). Both mEPP frequency and amplitude are similar between UbG76V-GFP-Syntaxin1 and control mice. H , Sample traces of EPPs recorded in the lumbrical muscles from UbG76V-GFP-Syntaxin1 and control mice (8 months of age). I , Quantification of EPP amplitude. EPP amplitudes are similar between UbG76V-GFP-Syntaxin1 mice (27.29 ± 0.84 mV, n = 22) and control mice (26.99 ± 1.34 mV, n = 17). J , EPPs recorded from the lumbrical muscles from UbG76V-GFP-Syntaxin1 and control mice (8 months of age) in response to a 1 s, 100 Hz train stimulation (only the first 20 EPPs are displayed). Similar responses were detected from UbG76V-GFP-Syntaxin1 and control mice. Scale bars: D , 30 μm; E , 100 μm.
- Figure 11.
UbG76V-GFP-Syb2 interacts with SNARE protein Syntaxin1 and SNAP-25. A , Quantitative immunoblotting analyses comparing the levels of synaptic protein expression in spinal cord homogenates of UbG76V-GFP-Syb2 and nontransgenic control mice (8 months of age, three pairs of each genotype). Synaptic proteins are expressed at similar levels between UbG76V-GFP-Syb2 and non-Tg control mice. B , Spinal cord homogenates from UbG76V-GFP, GFP-Syb2, UbG76V-GFP-Syb2, and control mice (8 months of age) were immunoprecipitated with anti-GFP antibodies, and then probed with anti-syntaxin1 and anti-SNAP-25 antibodies. Both syntaxin1 and SNAP-25 were coimmunoprecipitated from GFP-Syb2 and UbG76V-GFP-Syb2 mice, but not from UbG76V-GFP or nontransgenic control mice. C , Syntaxin1 immunoblotting detected a high-molecular-weight SNARE core complex in lysate from HEK293 cells that expressed SNAP-25 and Syntxin1A together with UbG76V-GFP-Syb2 (lane 4, unboiled), but not with UbG76V-GFP or a UbG76V-GFP-Syb2 mutant that was mutated in its SNARE motif. The SNARE core complex is sensitive to boiling (lane 3). Lanes 1, 3, 5: boiled; lanes 2, 4, 6: unboiled.
- Figure 12.
Ultrastructure of motor nerve terminals in 3-month-old UbG76V-GFP-Syb2 mice. A , B , Examples of normal NMJs from control mice ( A ) and UbG76V-GFP-Syb2 mice ( B ). The nerve terminal (Nt) appears electron translucent and is filled with an abundance of synaptic vesicles (SVs) and mitochondria (M). C , An example of an impaired motor nerve terminal from UbG76V-GFP-Syb2 mice. The nerve terminal in this NMJ appears amorphous (*) and contains a reduced number of synaptic vesicle. White arrowheads point to junctional folds at the postsynaptic muscle membrane. Scale bar: (in C ) A–C , 1 μm.
- Figure 13.
Ultrastructural defects of motor nerve terminals in UbG76V-GFP-Syb2 mice (8 months of age). A , B , Examples of normal NMJs in control mice ( A ) and UbG76V-GFP-Syb2 mice ( B ). C , An example of an abnormal NMJ from UbG76V-GFP-Syb2 mice. This NMJ contains two nerve terminals (marked by 1 and 2), which are further magnified in D and E . The density of synaptic vesicles is markedly reduced; the axoplasm appears amorphous [denoted by an asterisk (*)] and is characterized by the accumulation of abnormal tubulovesicular structures ( D , white arrow). F–H , Examples of degenerated NMJs: a nerve terminal engulfed by a Schwann cell process ( F , black arrowhead), and synapses devoid of motor nerve terminals ( G , H ). Synaptic sites are marked by the presence of postsynaptic junctional folds ( F–H , black arrow). nt, Nerve terminal; SC, Schwann cell. Scale bars: A–C , E–H , 1 μm; D , 0.5 μm.
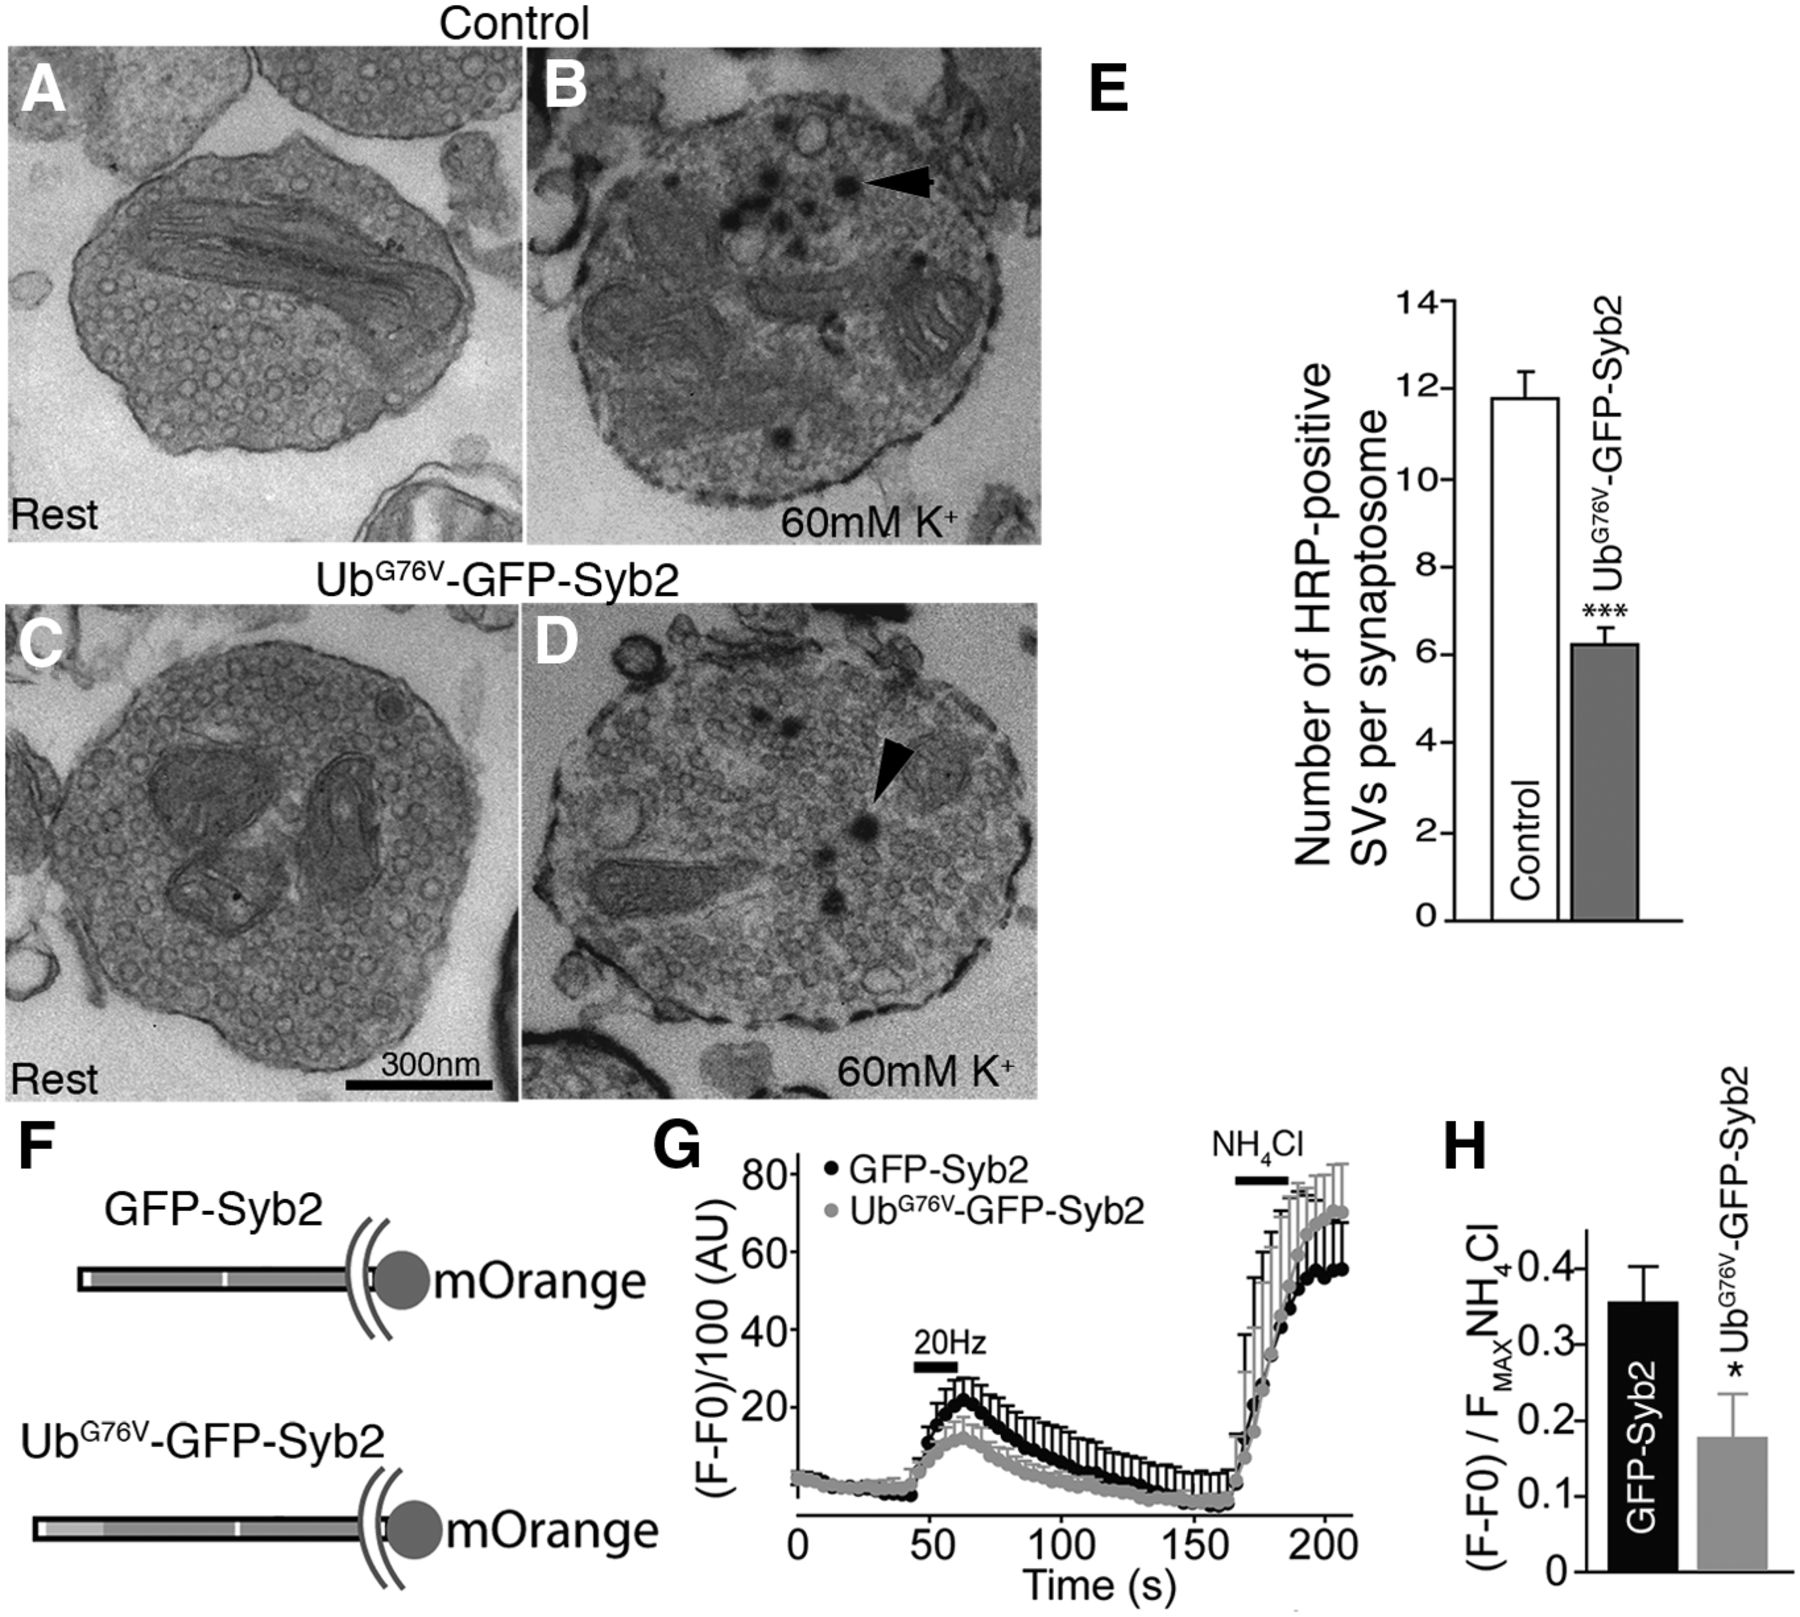
- Figure 14.
Impairments in synaptic vesicle endocytosis and membrane trafficking in UbG76V-GFP-Syb2 mice. A–D , EM images of synaptosomes isolated from control ( A , B ) and UbG76V-GFP-Syb2 mice ( C , D ). A and C show examples of synaptosomes at rest; B and D show examples of synaptosomes containing HRP-labeled SVs (arrowheads) after incubation with 60 mm KCl for 15 min. E , Bar graphs showing the average number of HRP-positive SVs per synaptosome after depolarization with 60 mm KCl for 15 min. A total of 215 synaptosomes from UbG76V-GFP-Syb2 mice (N = 3) and 209 synaptosomes from control mice (N = 3) were analyzed. The average numbers of HRP-positive SVs per synaptosome from UbG76V-GFP-Syb2 mice are significantly (p = 0.0493) reduced in UbG76V-GFP-Syb2 mice (6.24 ± 1.66 vesicles, N = 3 mice) compared with control mice (11.42 ± 1.55 vesicles, N = 3 mice). F , Schematic diagram of GFP-Syb2-mOrange and UbG76V-GFP-Syb2-mOrange. G , Average traces of fluorescence changes in synaptic boutons expressing GFP-Syb2-mOrange (n = 8) and UbG76V-GFP-Syb2-mOrange (n = 9). H , Analysis from the same experiments as in G . The peak fluorescence generated during 20 Hz stimulation is normalized to the peak fluorescence generated after NH4Cl treatment. The average peak values in synaptic boutons expressing UbG76V-GFP-Syb2-mOrange are significantly (p = 0.0067) lower than those expressing GFP-Syb2-mOrange. Scale bar: A – D (in C ), 300 nm.


Tables
Genotype Non-Tg control mice (n = 61, N = 3) UbG76V-GFP-Syb2 mice (n = 55, N = 5) Nerve terminal area (μm2) 2.92 ± 0.29 3.44 ± 0.48 Nerve terminal perimeter (μm) 6.76 ± 0.34 7.81 ± 0.63 Presynaptic contact length (μm) 3.35 ± 0.21 2.93 ± 0.32 Presynaptic/perimeter ratio (%) 48.0 ± 1.3 35.3 ± 2.0 * Synaptic vesicle number (per nerve terminal) 175 ± 14.6 120 ± 17.9 † Synaptic vesicle density (per μm2) 67.6 ± 4.1 41.7 ± 3.9 ‡ -
Values are reported as the mean ± SEM. Synaptic contact ratio and synaptic vesicle density were significantly decreased in UbG76V-GFP-Syb2 mice (8 months of age) compared with littermate control mice. n, Number of nerve terminals; N, number of mice.
-
↵*p = 4.0753 × 10⁻⁷.
-
↵†p = 0.0177.
-
↵‡p = 1.5886 × 10⁻⁵.
-


