

Article Figures & Data
Figures
- Figure 1.
Odd neurons project dendrites to the calyx of the MB. All images show second instar larval brains apart from M and N, which are third instar brains. A, B, and J–M are maximum intensity confocal stacks. C–I are single confocal sections. A, Anatomy of the Odd neurons (green) with nc82 (magenta) as a neuropile marker (dorsal view). Odd neurons (*) project to the calyx (arrow) and arborize medially in the CPM (arrowhead). There are also a few branches extending posteriorly (yellow arrow). B, Lateral view of a projection pattern showing that the CPM arbor (arrowhead) of the Odd neurons (white, asterisks) does not project into the ventral nerve cord (anterior limit dotted line). The arbor in the calyx (arrow) is located anterior to the cell bodies (asterisks), and a small arbor is located at the point of bifurcation (blue arrow). Also visible are the branches that extend posteriorly (yellow arrow). C, Colocalization between an acetylcholine transferase driver line (green) and Odd neurons (white; arrows). All Odd neurons colocalize with the driver line in both hemispheres (each hemisphere marked by dotted lines). D, Green channel only of C. E–I, Odd neurons do not colocalize with the Tdc driver line expressed in octopaminergic neurons (E), the Ddc driver line expressed in dopaminergic and serotonergic neurons (F), the DVGlut-Gal4 line driving expression in glutamatergic neurons (G), the NPF driver line expressed in Neuropeptide F-producing neurons (H), and GABA antibody expression (I). J, Driving the dendtirtic marker DenMark (magenta) and the presynaptic marker synaptotagmin-GFP (green) in the Odd neurons. DenMark localizes to the calyx (arrow) and small arbor at the bifurcation point (blue arrow). Synaptotagmin-GFP localizes to the CPM arbor exclusively (arrowhead). K, Dynein mutant Odd NB clone (green) showing the absence of Odd neural projections in the calyx (arrows). nc82 labels the neuropile (magenta). L, Wild-type Odd NB clone (green) showing projections into the calyx (arrows). nc82 labels the neuropile (magenta). M, Single-cell wild-type Odd clone (green) of one of the Odd neurons that extends projections into the calyx (arrow) and contralaterally into the CPM. This neuron was born 5.5 h after egg laying. nc82 labels the neuropile (magenta). N, Reconstruction of all eight neurons implemented into a standard larval brain in relation to the MB (red) and CPM (yellow). Scale bars, 20 μm. A, anterior; P, posterior; D, dorsal; V, ventral; L, lateral; M, medial.
- Figure 2.
Anatomy of individual Odd neurons. All images are dorsal views of third instar larval brains stained for nc82 (magenta), anterior at the top, lateral to the left. Single MARCM clones (green) induced at different developmental stages. A′–F′ are neural reconstruction implemented in a standard larval brain of each image. A, Clonal induction at 4.5 h after egg laying, which labels an Odd neuron that projects contralateral and ipsilateral arborizing near the CPM (arrow). B, Heat shock induction at 7.5 h after egg laying labeling a cell that projects only ipsilateral. C, Heat shock induction at 9.5 h which labels one of the Odd neurons that project into the calyx and contralaterally to the CPM. D, Heat shock induction at 10.5 h after egg laying labeling the third Odd neuron that projects into the calyx. This cell exclusively projects ipsilaterally. E, Heat shock induction at 12.5 h after egg laying. This Odd neuron has a small arbor close to the cell body (arrow) and projects contralaterally. F, Heat shock induction at 14.5 h after egg laying labeling an ipsilateral projecting cell.
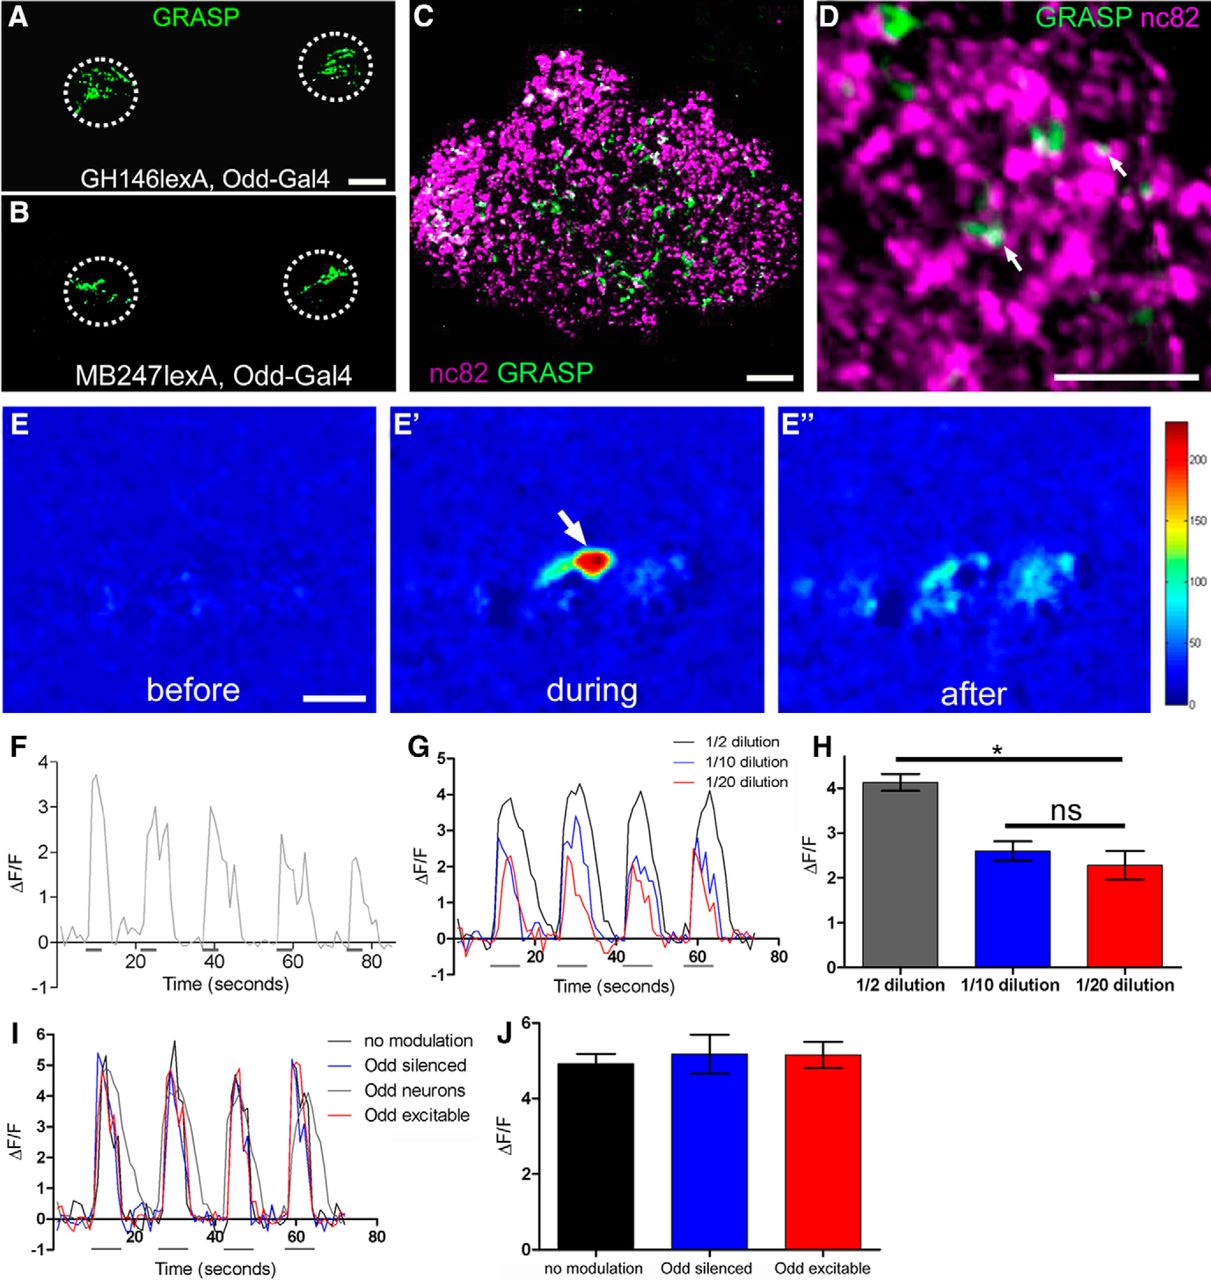
- Figure 3.
Odd neurons receive input from PNs and respond to odor. All images are second instar larval brains. A, Confocal stack of a larval brain expressing the split-GFP (GRASP; green) in PNs (GH146lexA) and Odd neurons (Odd-gal4). Reconstitution of GFP is restricted to the calyx (dotted circles). B, Confocal stack of a larval brain expressing the split-GFP in Kenyon cells (MB247lexA driver) and Odd neurons (Odd-gal4 driver). A few GRASP puncta localize to the calyx (dotted circle). C, Confocal stack, high-magnification (63×) image of the calyx showing split-GFP localization between the PNs and Odd neurons (green) colabeled with nc82, which labels presynaptic densities. GRASP puncta are distributed throughout most of the calyx. D, Single confocal image (63×, 5× zoom) of the calyx showing split-GFP localization between the PNs and Odd neurons (green) in the background of nc82 staining labeling presynaptic sites. Part of the GRASP puncta colocalizes with nc82 (examples labeled by arrows), showing that these puncta are likely synapses. E, Response of Odd neurons expressing GCaMP6 to ACV. E, Before odor stimuli. E′, During odor stimuli. E″, After odor stimuli. Some cells respond to odor (arrow). F, Response of a single cell to repeated cycles of odor presentation. Gray boxes represent odor stimuli. G, Dose–response curve showing the response profile of individual Odd neurons to different concentrations of ACV. Gray boxes represent odor stimuli. H, Lowering the concentration 10-fold significantly decreases the average maximum responses of the Odd neurons to ACV, (Kruskal–Wallis test, Bonferroni post-test, p < 0.05) but responses are similar between 1:10 and 1:20 dilutions of ACV. I, Response profile of PNs in larvae in which the Odd neurons are either silenced using Kir2.1 or made more excitable using NaChBac. Gray boxes represent odor stimuli. J, Neither manipulation affects the average maximum response of PNs (Kruskal–Wallis test, Bonferroni post-test). Scale bars: A, B, F–I, 20 μm; C, E, 10 μm; D, 5 μm.
- Figure 4.
Silencing Odd neurons impairs chemotaxis. A, Schematic representation of the chemotaxis behavior assay showing the labeling of each zone at the top. B, Percentage of larvae that remain on the odor source during the time period of the chemotaxis assay. Between 100% and 96% of all larvae that reach the odor source remain on it until the end of the assay. C, Fourier transform infrared spectroscopic measurements of the odor concentrations in gas phase at the following three locations in the chemotaxis arena: near the odor source (zone +4), in the middle (zone 0), and near the control side (zone −4). Odor concentration is highest near the odor source (zone +4) and lowest at the control side, showing that a gradient of odor concentrations is generated within the assay. D, Behavioral responses to the full concentration of ACV. Odor-evoked behavior is statistically significant for Odd-silenced larvae using Kir2.1 (orange) in zone +4 compared with controls. Odd-silenced larvae behave significantly better than the anosmic Orco control in zones +3, +2, and +1, showing that they do respond to an attractive odor. The RI response is calculated for each zone of the plate (x-axis). Each bar represents the RI ± SEM; n = 10. *p < 0.05, ***p < 0.001. E, Locomotion of larvae in the absence of odor calculated from the speed tracks generated by MWT. Each bar represents average locomotion over a 4 min period (y-axis) ±SEM (n = 7). F, Behavioral responses to full concentration of ACV using TNT to silence the Odd neurons (orange). A similar pattern of behavior is observed as with Kir2.1. G, Behavioral response to 10−1 dilution of ACV. Odor-evoked behavior is significantly different for Odd-silenced larvae in zones +4 and +3. H, Larval behavioral responses to the repellent 1-nonanol. There is no significant behavioral difference between Odd-silenced larvae and controls. I, Odd neural responses to 1-nonanol using functional imaging. None of the larvae (N = 5) respond to this repellent (traces of different shades of gray) compared with the black trace, which is an example of a response to ACV. Gray boxes represent odor stimuli. J, Larval behavioral responses to the repellent geranyl acetate. There is no significant behavioral difference between Odd-silenced larvae and controls. Statistical significance for all the chemotaxis assays was calculated using a two-way ANOVA and Bonferroni post-test to calculate the degree of statistical significance.
- Figure 5.
Behavioral and neural responses to different odors. A, Odor-evoked responses of Odd neurons expressing GCaMP6 using functional imaging to various monomolecular odors (10−1 dilution) and banana mush. Each colored line represents the response of one Odd neuron exposed to multiple cycles of different odors. B, Average maximum response of several larvae (N = 6) showing that all of the seven attractive odors tested generate responses in the Odd neurons, whereas the two repellents 1-nonanol and geranyl acetate both fail to elicit responses in Odd neurons upon odor stimuli. C–H, Behavioral responses to different monomolecular odors at 10−1 dilution and banana mush. In all assays, bars represent the RI ± SEM (n = 10). Statistical significance was calculated using a two-way ANOVA and Bonferroni post-test to calculate the degree of statistical significance. *p < 0.05, **p < 0.01, ***p < 0.001. The silencing of Odd neurons has a similar behavioral effect for all odors tested.
- Figure 6.
Odd-excited larvae show improved odor concentration discrimination. A, Behavioral responses to ACV of Odd-excited larvae using NaChBac (purple). The proportion of Odd-excited larvae in zone +4 is significantly larger compared with controls. B, Behavioral responses to ACV using TrpA1 to excite the Odd neurons. Odd-excited larvae are significantly better (p < 0.001) at locating the odor source in zone +4 compared with controls. The RI response is calculated for each zone of the plate (x-axis). Each bar represents the RI ±SEM (n = 10). A two-way ANOVA was used to calculate statistical significance and Bonferroni post-test to calculate the degree of statistical significance ***p < 0.001. C, Locomotion speed of larvae in the absence of odor calculated from the speed tracks generated by MWT. Each bar represents average locomotion over a 4 min period (y-axis) ±SEM (N = 7) (Kruskal–Wallis test combined with a Bonferroni post-test). D, Comparison between the behavioral responses at full concentration and 10−1 dilution of ACV. Odd-excited larvae still perform better at lower odor concentrations. Kruskal–Wallis test combined with a Bonferroni post-test, p < 0.001. E, Schematic representation of the odor discrimination assay. F, Behavioral responses to a 10-fold difference in odor concentration, showing that larvae can locate the arm containing the higher concentration of odor. G, Behavioral responses to a fourfold difference in odor concentration. The Odd-excited larvae (purple) are statistically better (***p < 0.001) at choosing the higher odor concentration compared with controls. Each bar represents the RI for the higher odor concentration ±SEM (N = 10). Statistical significance was calculated using a one-way ANOVA and Bonferroni post-test. H, Behavioral responses to a fourfold difference in odor concentration of a selection of the monomolecular odorants used in the chemotaxis assay. Regardless of the odor tested, Odd-excited larvae can correctly locate the arm with the higher odor concentration, whereas control larvae cannot differentiate between the fourfold differences in odor concentration between the two arms. Statistical significance was calculated using a one-way ANOVA and Bonferroni post-test. I, Odor concentration discrimination was also tested using an arena similar to that for the chemotaxis assay but replacing the control odor in zone −4 with a fourfold diluted ACV solution. Using Fourier transform infrared spectroscopy, we show that an odor gradient is generated within this arena. However, the addition of diluted odor to the control side increases the overall concentration of odor within the arena and decreases the slope of the gradient between zone +4 and zone 0 compared with the chemotaxis assay. J, K, Using the Odd-excited larvae as a control, we show that we obtain a similar behavioral response in this type of odor arena compared with the Y maze. J, Similar to the Y maze, Odd-excited larvae and control larvae can locate the odor source in the chemotaxis arena when a 10-fold difference in odor concentration is applied to either side of the arena. K, A fourfold difference in odor concentration rendered the control larvae incapable of discriminating between the two odor concentrations, whereas Odd-excited larvae maintained their ability to choose the side containing the higher odor concentration. L, Odd-silenced larvae cannot differentiate between a sixfold concentration difference in ACV, whereas both control larvae choose the side with the higher concentration of ACV. M, All three genotypes can locate the source of the higher odor concentration when larvae are presented with a 10-fold difference in the concentration of ACV. Statistical significance was calculated using a one-way ANOVA and Bonferroni post-test ***p < 0.001.
- Figure 7.
Odd neural modulation does not impair navigation at high odor concentrations. A, Fourier transform infrared spectroscopic measurements of the odor concentration distribution in the gas phase within the hanging drop arena compared with the chemotaxis and odor discrimination arena. Concentration is high near the odor source in the middle of the plate compared with measurements taken at positions similar to those in zones +4 and −4. B–D, Behavioral responses in a hanging drop assay (n = 15). Top, Locomotion tracks. Bottom, Bar plots representing the mean (±SEM) occupancy in respect to the odor source. Bars of lighter shade represent statistically significant occupancy compared with the control. B, Odd-Gal4. C, Odd-excited. D, Odd-silenced larvae. A Wilcoxon signed rank test corrected for multiple comparisons was used to calculate statistical significance.
- Figure 8.
Odd-silenced larvae show increased frequency of lateral head swings and turning during chemotaxis. A, Schematic representation of the area filmed (gray box) during chemotaxis. B–B″, Distribution of head swings of a single larva. FIMtrack values were plotted against time using 4 min film segments. Gray boxes labels double head swings. B′, B″, Odd-silenced larvae perform more single and double head swings compared with the Gal80ts, UAS-Kir2.1 control (B′), and the Odd-gal4 control (B″). C, Quantitative measurement of double head swings. Bar represents double head swings/min ±SEM (N = 15). The number of double head swings/min is significantly higher for Odd-silenced larvae (orange) compared with both parental line controls (p < 0.001). In the absence of odor, there is no difference between Odd-silenced larvae and controls. D, Number of single head swings performed by the Odd-silences larvae in the presence and absence of odor. The number of single head swings is statistically higher in Odd-silenced larvae compared with controls (p < 0.05) in the presence of odor but is not statistically significant compared with the controls in the absence of odor. E, Number of stops in larval locomotion in the presence and absence of odor (p < 0.001). Bar represents the number of stops per minute ±SEM (N = 15). Odd-silenced larvae stop significantly more frequently than both control lines in the presence of odor (p < 0.001). whereas the number of stops per minute is similar among all three genotypes in the absence of odor. F, Average number of turns of larvae in the presence and absence of odor. Odd-silenced larvae turn more frequently compared with controls (p < 0.001). Bar represents the number of turns per minute ±SEM (N = 15). A Kruskal–Wallis test was used for all statistical calculations. G–I, Locomotion tracks from multiple larvae (N = 10) generated from FIMtrack.
- Figure 9.
Odd-excited larvae perform fewer head swings during chemotaxis. A, A′, Number of head swings for the Odd-excited larvae in the presence of odor (A) and in the absence of odor (A′) of single larvae. FIMtrack values were plotted against time using 4 min film segments. Gray boxes label double head swings. B, Quantitative measurement of number of double head sweeps between Odd-excited larvae and controls in the presence and absence of odor. Odd-excited larvae perform statistically fewer double head swings (p < 0.5) compared with controls in the presence of odor, whereas all three genotypes carry out similar numbers of double head swings in the absence of odor. Odd-excited larvae also carry out significantly fewer head swings compared to controls in the absence of odor (p < 0.001). In addition the controls perform fewer head swings in the presence of odor compared to the number of head swings in the absence of odor (p < 0.01). Each bar represents the number of double head swings per minute ±SEM (N = 15). C, Number of single head swings of Odd-excited larvae compared with Odd-silenced larvae and controls in the presence and absence of odor. There is a statistical difference between Odd-excited larvae and controls (p < 0.05) in the presence of odor, as well as significant difference between Odd-excited larvae in the presence of odor, and between Odd-excited larvae and controls in the absence of odor (p < 0.01). The number of single head swings between Odd-excited larvae and controls in the absence of odor is not significantly different. Each bar represents the number of single head swings per minute ±SEM (N = 15). D, Average number of stops in forward locomotion per minute. Bar represents the number of stops per minute ±SEM (N = 15). Odd-excited larvae stop significantly fewer times compared with control larvae (p < 0.05) in the presence of odor but not in the absence of odor. E, Average number of turns of larvae in the presence and absence of odor. Bar represents the number of turns per minute ±SEM (N = 15). The average turn rate is similar between Odd-excited larvae and controls both in the presence and absence of odor. F, Odd-excited larval locomotion tracks from multiple larvae (N = 10). Kruskal–Wallis test was used for all statistical calculations.
- Figure 10.
Chemotaxis circuit model. Odd neurons (green) receive input from PNs (purple) and Kenyon cells (light blue) at the level of the calyx. In turn, Odd neurons synapse onto and provide background excitation to a parallel circuit (orange) required for chemotaxis. These neurons could either directly or indirectly synapse onto motor output (black) neurons.


