

Article Figures & Data
Figures
- Figure 1.
Left, Diffusion models with fixed (dashed) or collapsing (solid) decision boundaries. A model with collapsing boundaries can terminate the evidence accumulation process earlier than a model with fixed boundaries, resulting in faster decisions. Right, Graph showing how the models lead to different predictions for response time distributions.
- Figure 2.
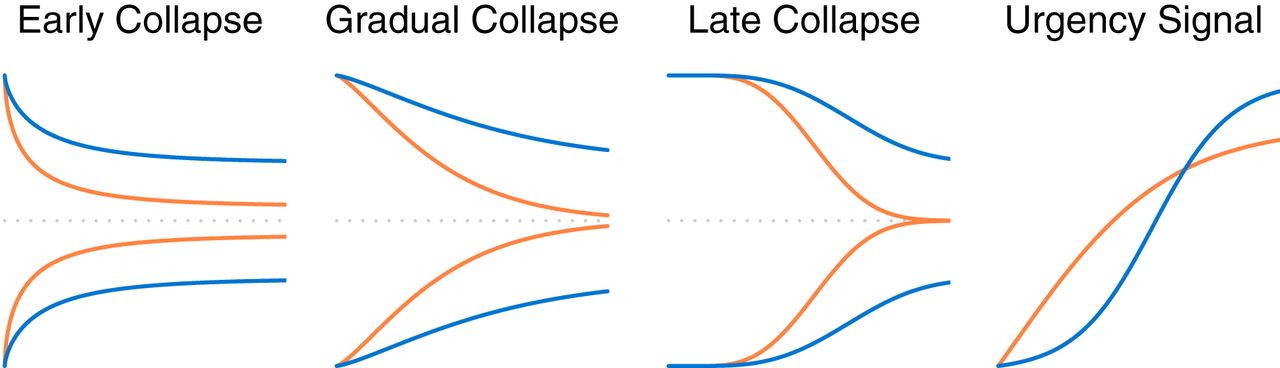
Various forms of dynamic diffusion models. The Weibull cumulative distribution function can generate decision boundaries that collapse at early (left) or late (middle right) stages of processing or gradually throughout processing (middle left). Orange lines indicate strong (left) and complete (middle left, middle right) collapse of the upper and lower boundaries, which imposes a hard deadline on processing. Blue lines represent a milder form of collapsing boundary that do not meet at the midpoint
 . Right, Two illustrative urgency signal paths, which are applied as a gain (i.e., multiplicative) function on drift rates according to Equation 2. The orange and blue paths show rapid and delayed urgency signals, respectively, which are functionally similar to early and late collapsing boundaries.
 - Figure 3.
The Weibull cumulative distribution function mimics parametric forms that might be proposed for collapsing bounds. Orange and blue lines show examples of candidate stationary and dynamic boundaries of various parametric functions: fixed, exponential, hyperbolic, and logistic. Overlaid black dotted lines indicate the best fitting Weibull function, which in all cases closely mimics the generating function.
- Figure 4.
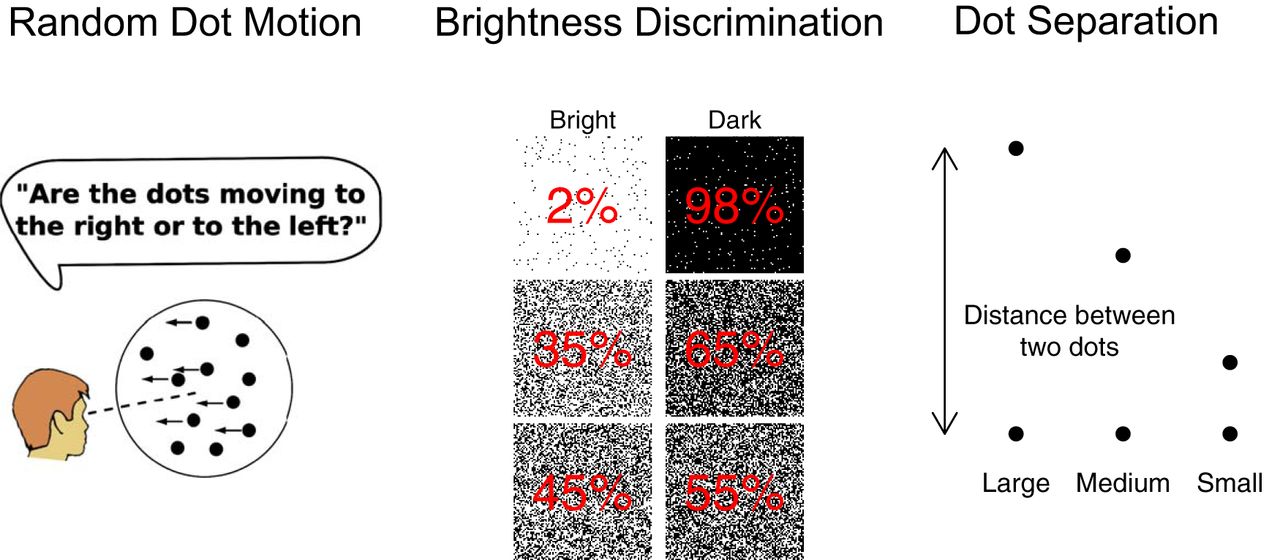
The three decision paradigms from the human and nonhuman primate studies: random dot motion, brightness discrimination, and dot separation.
- Figure 5.
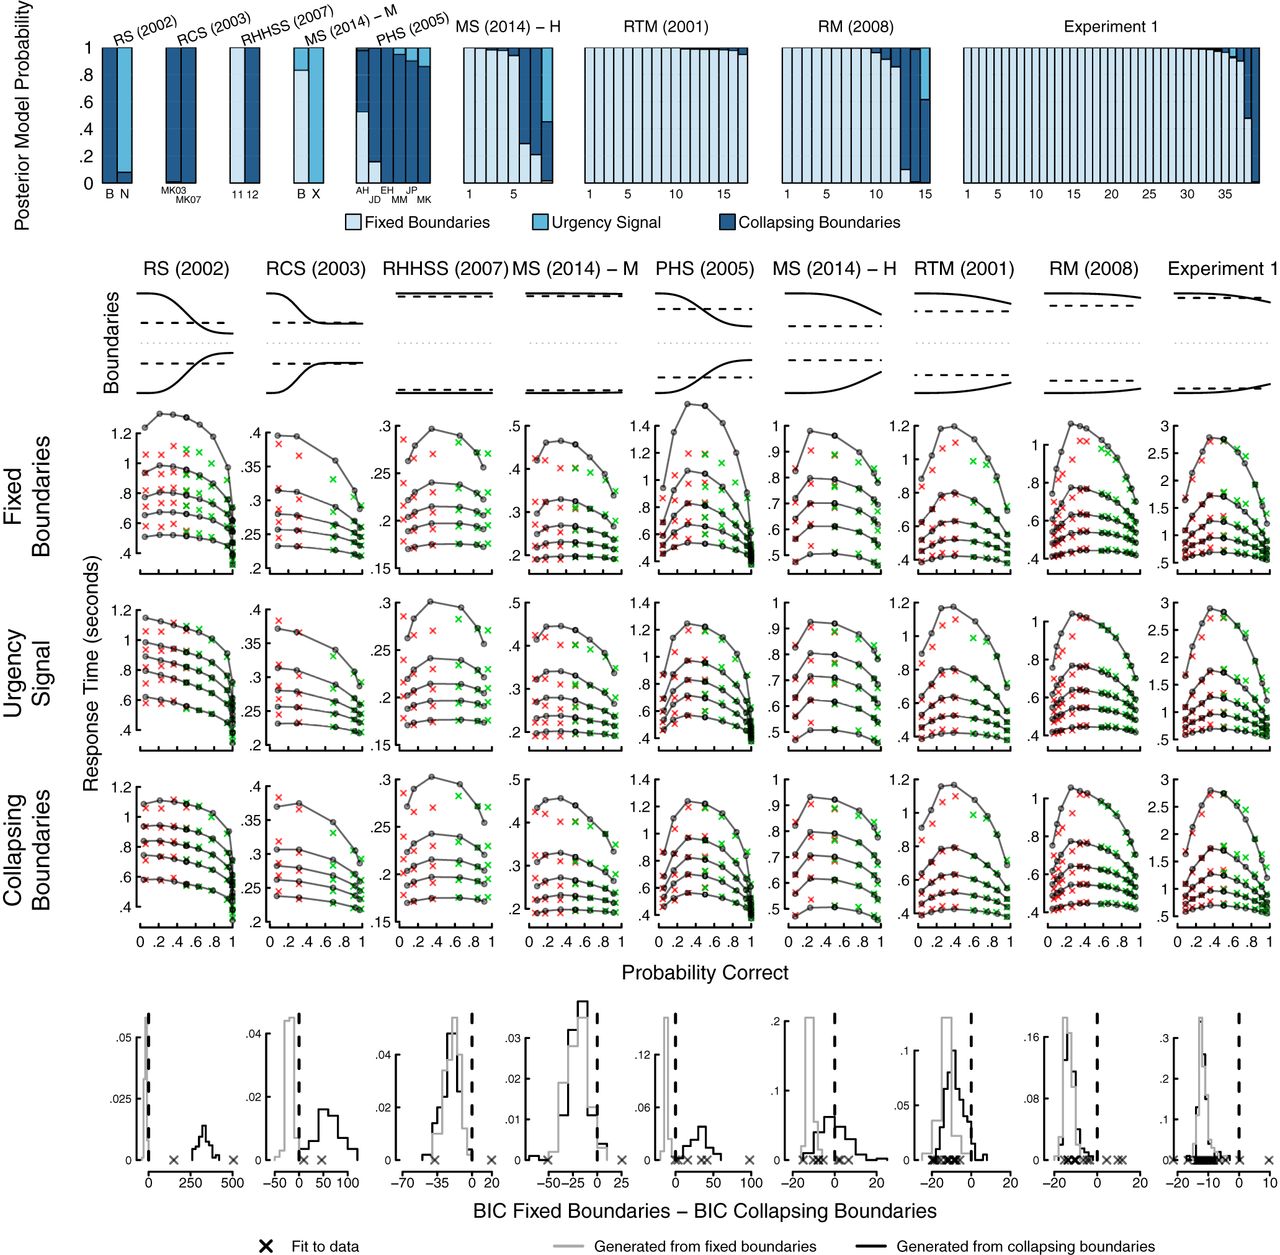
Top row, BIC-based approximations to posterior model probabilities in favor of the fixed bounds, urgency signal, and collapsing bounds models separately for the nine datasets. Shade represents the three models and columns represent individual subjects, with subject labels from the original reports below. Second row, Average decision boundaries for fixed and collapsing models for each experiment using parameters averaged over subjects. Third, fourth, and fifth rows, Choice probabilities and response times for both data and model fits, as quantile-probability plots. Panels show the probability of a correct response on the x-axes and response time (in seconds) on the y-axes. Green and red crosses represent correct and error responses, respectively, across experimental conditions. Vertical placement of the crosses show, for each condition, the 10th, 30th, 50th (i.e., median), 70th, and 90th percentiles of the response time distribution, aggregated across subjects. Predictions of the fixed bounds, urgency signal, and collapsing bounds models are overlaid on data as black lines. Bottom row, Results of model recovery simulation study. Histograms represent distributions of the difference in BIC values from data simulated from the fixed (gray histograms) and collapsing bounds (black histograms) models. Distributions that fall to the left of zero support the fixed bounds model and those to the right of zero support the collapsing bounds model. Crosses represent the corresponding BIC difference values from the model fits to data. Heading acronyms refer to the nine datasets: RS (2002), Roitman and Shadlen (2002); RCS (2003), Ratcliff et al. (2003); RHHSS (2007), Ratcliff et al. (2007); MS (2014)–M, macaques from Middlebrooks and Schall (2014); PHS (2005), Palmer et al. (2005); MS (2014)–H, humans from Middlebrooks and Schall (2014); RTM (2001), Ratcliff et al. (2001); RM (2008), Ratcliff and McKoon (2008); Experiment 1, Reported in this manuscript.
- Figure 6.
Approximations to posterior model probabilities in favor of the fixed bounds model with between trial variability parameters and the urgency signal and collapsing bounds models without between trial variability parameters. All details are as described for the top row of Figure 5.


