

Article Figures & Data
Figures
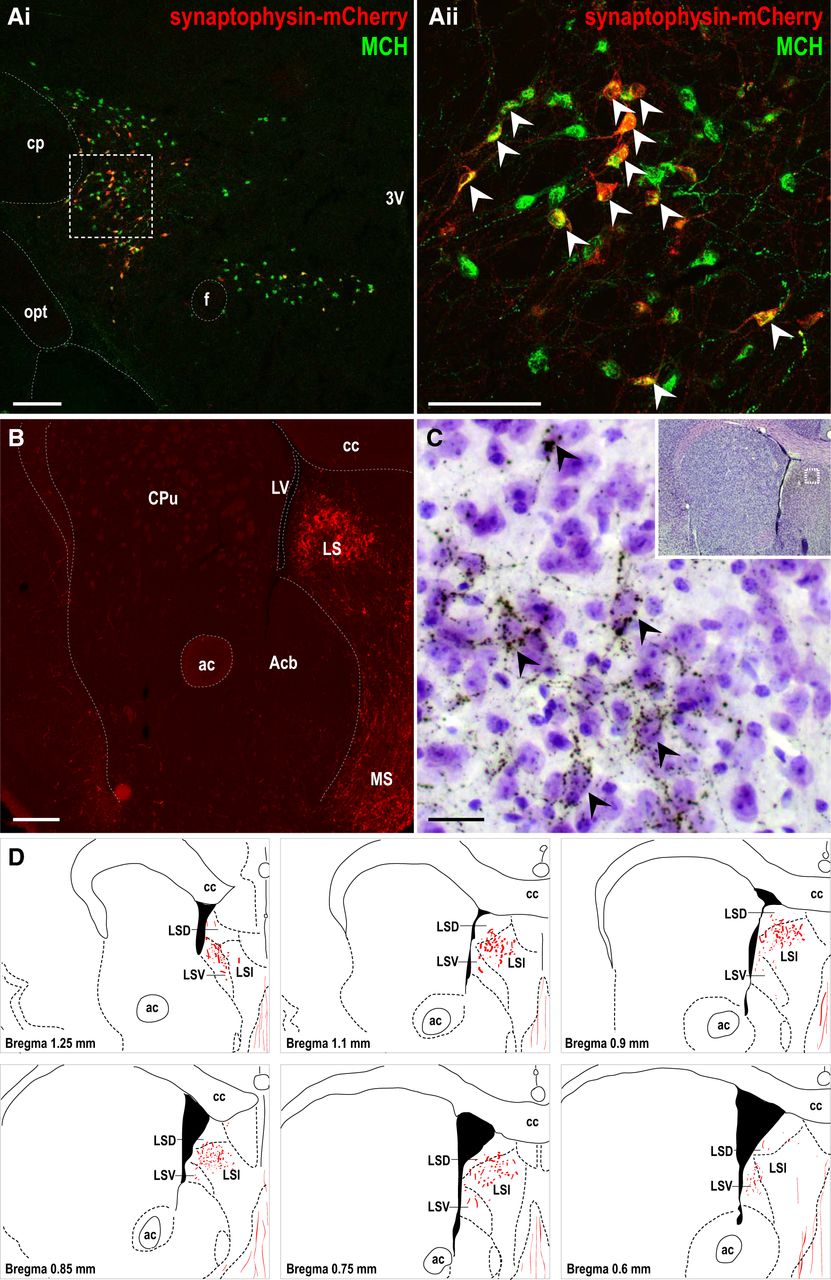
- Figure 1.
The LS receives dense MCH axon terminals. A, Merged low-magnification (i) and high-magnification (ii, outlined from i) confocal photomicrographs showing native synaptophysin–mCherry fluorescence (red) and MCH immunoreactivity (green) in the lateral hypothalamus of Pmch–cre mice injected with AAV8–DIO–Ef1α–synaptophysin–mCherry. White arrowheads mark some representative double-labeled neurons (yellow). B, Epifluorescence photomicrograph of the LS showing native synaptophysin–mCherry-labeled fluorescent fibers. C, High-magnification bright-field photomicrograph (outlined in inset) showing punctate DsRed-IR boutons (dark brown) surrounding Nissl-stained LS cells (purple). Black arrowheads mark some representative LS soma outlined by DsRed-labeled terminals. D, Line drawings mapping DsRed immunoreactivity distribution within the LS. 3V, Third ventricle; ac, anterior commissure; Acb, accumbens nucleus; cc, corpus callosum; cp, cerebral peduncle; CPu, caudate putamen; f, fornix; LSD, lateral septal nucleus, dorsal part; LSI, lateral septal nucleus, intermediate part; LSV, lateral septal nucleus, ventral part; LV, lateral ventricle; MS, medial septal nucleus; opt, optic tract. Scale bars: Ai, B, 200 μm; Aii, 100 μm; C, 20 μm.
- Figure 2.
MCH neurons express vGLUT2 but not vGAT. A, B, Merged low-magnification (i) and high-magnification (ii, outlined in i) confocal photomicrographs showing MCH immunoreactivity (red) in GFP-positive (green) vGAT (A) and vGLUT2 (B) neurons. Insets (outlined in Aii and Bii) showing the colocalization of MCH immunoreactivity with vGLUT2 but not vGAT expression. White arrowheads indicate double-labeled neurons (yellow). Asterisks mark non-colocalized MCH neurons. Scale bars: i, 200 μm; ii, 100 μm. C, Unilateral cell count of MCH-IR neurons expressing vGAT or vGLUT2. cp, Cerebral peduncle; DMH, dorsomedial hypothalamic nucleus; opt, optic tract; VMH, ventromedial hypothalamic nucleus.
- Figure 3.
Photostimulation of ChR2-expressing MCH terminals evoked glutamate release in the LS. A, Experimental design schematic showing patch-clamp recording while photostimulating ChR2-expressing MCH neurons. B, Merged epifluorescence and IR-DIC photomicrographs of a coronal Pmch–cre brain slice injected with AAV8–EF1α–DIO–hChR2(H134R)–mCherry showing whole-cell recording from a mCherry-labeled MCH neuron (inset, outlined region). Scale bars: 200 μm; inset, 50 μm. C, Sample traces of action potential firing from a ChR2-expressing MCH neuron evoked by 5 s light trains (5 ms pulses) at 1, 5, 20, and 100 Hz light frequency (dashed line, 0 mV; left). Percentage change in spike fidelity (black, left axis) and MCH neuronal firing (gray, right axis) showing effective entrainment up to 20 Hz photostimulation (n = 12). D, Experimental design schematic showing whole-cell recordings from LS neurons while photostimulating ChR2-expressing MCH projections. E, Merged low-magnification (i) and high-magnification (ii) epifluorescence and IR-DIC photomicrographs of a coronal brain slice showing ChR2-expressing MCH axon terminals in the LS (i) and mCherry-fluorescent puncta outlining LS cells (ii). Scale bars: i, 200 μm; ii, 100 μm. F–I, Overlay of individual (gray) and averaged (black) oIPSCs (Vh of −5 mV; F) and oEPSCs (Vh of −60 mV; H) after photostimulation (3 5-ms light pulses in 1 s, repeated every 5 s for 20 trials). Averaged responses (F, H) magnified in insets (top) and raster plots (bottom; 50 ms bins) showing event synchronization during photostimulation. Probability plots (50 ms bins) showing that photostimulation increased IPSC and EPSC probability in control (con; n = 14), which is abolished by 20 μm BIC (n = 4; G) and 1 mm KYN (n = 6; I), respectively. J, K, Range (line, median; box, 25th to 75th percentiles; whisker, minimum to maximum) of absolute amplitudes (J) and delay latency (K) of oIPSCs and oEPSCs averaged from 20 trials. ***p < 0.001. L, Overlay of individual (gray) and averaged (black) oIPSCs (top) and oEPSCs (bottom) in control (i), BIC (ii), KYN (iii), 500 nm TTX (iv), TTX and KYN (v), and washout (vi). M, Effect of KYN and BIC on oIPSC and oEPSC amplitude. 3V, Third ventricle; cc, corpus callosum; con, control; CPu, caudate putamen; f, fornix; LHA, lateral hypothalamic area; LV, lateral ventricle.
- Figure 4.
Photostimulation of MCH terminals inhibited LS cells by glutamate-mediated GABA release. A, B, Sample trace (i) and mean percentage change (ii) in spontaneous LS firing frequency in response to photostimulation (5 ms light pulses, 10 Hz train for 5 s) before (control), during 1 mm KYN (A) or 20 μm BIC (B), and after washout (wash). *p < 0.05. C, Model of monosynaptic and disynaptic pathways between MCH and LS neurons. MCH neurons in the lateral hypothalamic area (LHA) directly release glutamate (Glu) onto LS neurons and GABAergic interneurons or afferents. Glutamate release at GABAergic intermediates elicits robust feedforward inhibition of LS neuronal activity.


