

Article Figures & Data
Figures
- Figure 1.
ON OS RGC is a distinct functional cell type. A, Responses of ON OS (left) ON alpha (middle) and ON direction selective (right) RGCs to a 1 s flash of 200 μm diameter circular light spot. Yellow rectangle indicates period of light stimulus. B, Peak transient firing rate plotted against peak ISI for ON OS (n = 60) and non-OS (n = 86) RGCs. Dotted lines indicate peak transient firing rate = 260 Hz and peak ISI = 45 ms. C, Spike responses of an example ON OS RGC to oriented light bar stimuli (800 μm × 50 μm, 12 angles). Preferred and null orientation responses are shown below. Error bars indicate SEM across five trials at each orientation. D, Polar plot of an example ON OS RGC's response to moving bar stimuli (1000 μm/s, 12 directions) with responses along preferred and null orientations. Direction of bar movement is shown along with the responses. Error bars indicate SEM across three trials in each direction. E, Population average normalized orientation tuning curve (see Materials and Methods). Responses were aligned to 0° representing their peak selectivity. Error bars indicate SEM across cells (n = 60). F, Population average tuning curve for moving bars aligned as in E. Error bars indicate SEM across cells (n = 21). G, Histogram of OSI of ON OS (n = 60) and non-OS RGCs (n = 86) as identified by their light-step response profile. Dotted line indicates OSI = 0.2. Error bars indicate SEM.
- Figure 2.
Temporal dynamics of light responses of ON OS RGCs. A Peristimulus time histograms (PSTHs) of light-step responses of 8 representative ON OS RGCs. PSTHs are calculated across 10 trials for each cell. Yellow rectangle indicates period of light stimulus. B, PSTHs of responses to a flashed bar along preferred orientation for each of the eight ON OS RGCs in A. PSTHs are calculated across five trials for each cell. C, Raster plots of responses of a single ON OS RGC to 1 s flashes of 200 μm diameter circular light spot. D, Raster plots of responses of the same cell as in C to bars flashed along preferred (top) and null (bottom) orientations. E, Spike count in the transient and sustained portions the light response of ON OS RGCs (n = 8) to spots of varying diameters. Responses are normalized to their maximum for each cell and averaged across cells. Shaded regions indicate SEM. For more details, see Materials and Methods.
- Figure 3.
ON OS RGCs represent horizontal and vertical cardinal axes. A, Angle histogram of preferred orientation of ON OS RGCs (n = 48 cells, 27 retinas, 20 mice) in whole-mount retina. Angles here and in subsequent figures represent real angles in visual space. Two distinct populations are evident; nasal–temporal (horizontal, orange) and dorsoventral (vertical, green). B, Positional map of the ON OS RGCs (n = 48) in the whole retina. C, Same histogram as in Figure 1G separated into horizontal and vertical ON OS RGCs. Unknown ON OS RGCs were recorded from retinal pieces without information about cardinal axes. Non-OS RGCs are not shown.
- Figure 4.
Dendritic morphology of ON OS RGCs. A, B, Dendritic morphologies of horizontal ON OS RGC (A) and vertical ON OS RGC (B). Dendrites in ON and OFF sublaminae of the IPL are colored in cyan and magenta, respectively. Major and minor axes and polygon fit for ON dendrites are shown as dotted lines. C, Stratification of ON OS cell dendrites relative to ChAT bands. D, Z-profiles of ON OS dendritic arbor stratification. Orange and green lines indicate profiles of individual ON hOS and ON vOS cells, respectively. Black line represents mean. Cyan and magenta lines indicate ON and OFF starburst planes respectively. The inner nuclear layer (INL) is located to the right and the ganglion cell layer (GCL) is located to the left. Shaded region indicates SEM across three cells (one ON hOS and two ON vOS). E, Sholl analysis of ON OS RGCs. Orange and green lines indicate radial profiles of individual ON hOS and ON vOS cells, respectively. Black line represents mean. Shaded region indicates SEM across four cells (two ON hOS and two ON vOS). F, Dendritic field areas of OFF arbors plotted against dendritic field areas of ON arbors for ON OS RGCs (n = 29) and non-OS RGCs (n = 25). Dotted line indicates unity. G, OFF dendritic axes ratio plotted against ON dendritic axis ratio for ON OS RGCs (n = 29) and non-OS RGCs (n = 25). Dotted line indicates unity. Horizontal ON OS RGCs (n = 16) have a significantly higher axes ratio compared with vertical ON OS (n = 13) and non-OS RGCs (two-sample Kolmogorov–Smirnov test, ON dendrites: p < 10−6 for ON hOS vs ON vOS, p < 10−8 for ON hOS vs non-OS and p = 0.57 for ON vOS vs non-OS; OFF dendrites: p < 0.002 for ON hOS vs ON vOS, p < 10−5 for ON hOS vs non-OS and p = 0.1 for ON vOS vs non-OS). Error bars indicate SEM. Cells in A and B are marked with arrows in F and G.
- Figure 5.
Correlation between dendritic morphology and orientation selectivity. A, B, Responses of horizontal ON OS RGC (A) and vertical ON OS RGC (B) to moving bar stimuli. Images of the cells are overlaid on the polar plots. C, D, Rose plots of absolute differences between spikes OS angle (θspikes) and ON dendritic OS angle (θONDend) of ON h OS RGCs (n = 15; C), and ON vOS RGCs (n = 13; D). E, F, Rose plots of absolute differences between spikes OS angle (θspikes) and OFF dendritic OS angle (θOFFDend) of ON h OS RGCs (C) and ON vOS RGCs (D). OS angles were calculated as described in Materials and Methods. Error bars indicate SEM across three trials in each direction.
- Figure 6.
Excitatory and inhibitory synaptic inputs to ON OS RGCs. A, Responses of an ON OS RGC to a 1 s flash of 200-μm-diameter circular light spot. Cell voltage clamped at −60 mV, the reversal potential for inhibition (top trace, blue). Cell voltage clamped at 20 mV, the reversal potential for excitation (bottom trace, red). Yellow rectangle indicates period of light stimulus. B, Responses of ON hOS RGC to flashed bar stimuli (top trace) and excitation (bottom trace) inhibition. Error bars indicate SEM across five trials at each orientation. C, Traces of excitation (top) and inhibition (bottom) at 0° and 90° bar orientations for cell in B. D, E, Population averaged responses of horizontal (n = 9; D) and vertical (n = 11; E) ON OS RGCs to oriented light bar stimuli (top traces) and excitation (bottom traces) inhibition. Error bars indicate SEM across cells. F, G, Population-averaged responses of horizontal (n = 3; F) and vertical (n = 3; G) ON OS RGCs to moving bar stimuli; excitatory currents (top traces), inhibitory currents (bottom traces). Error bars indicate SEM across cells.
- Figure 7.
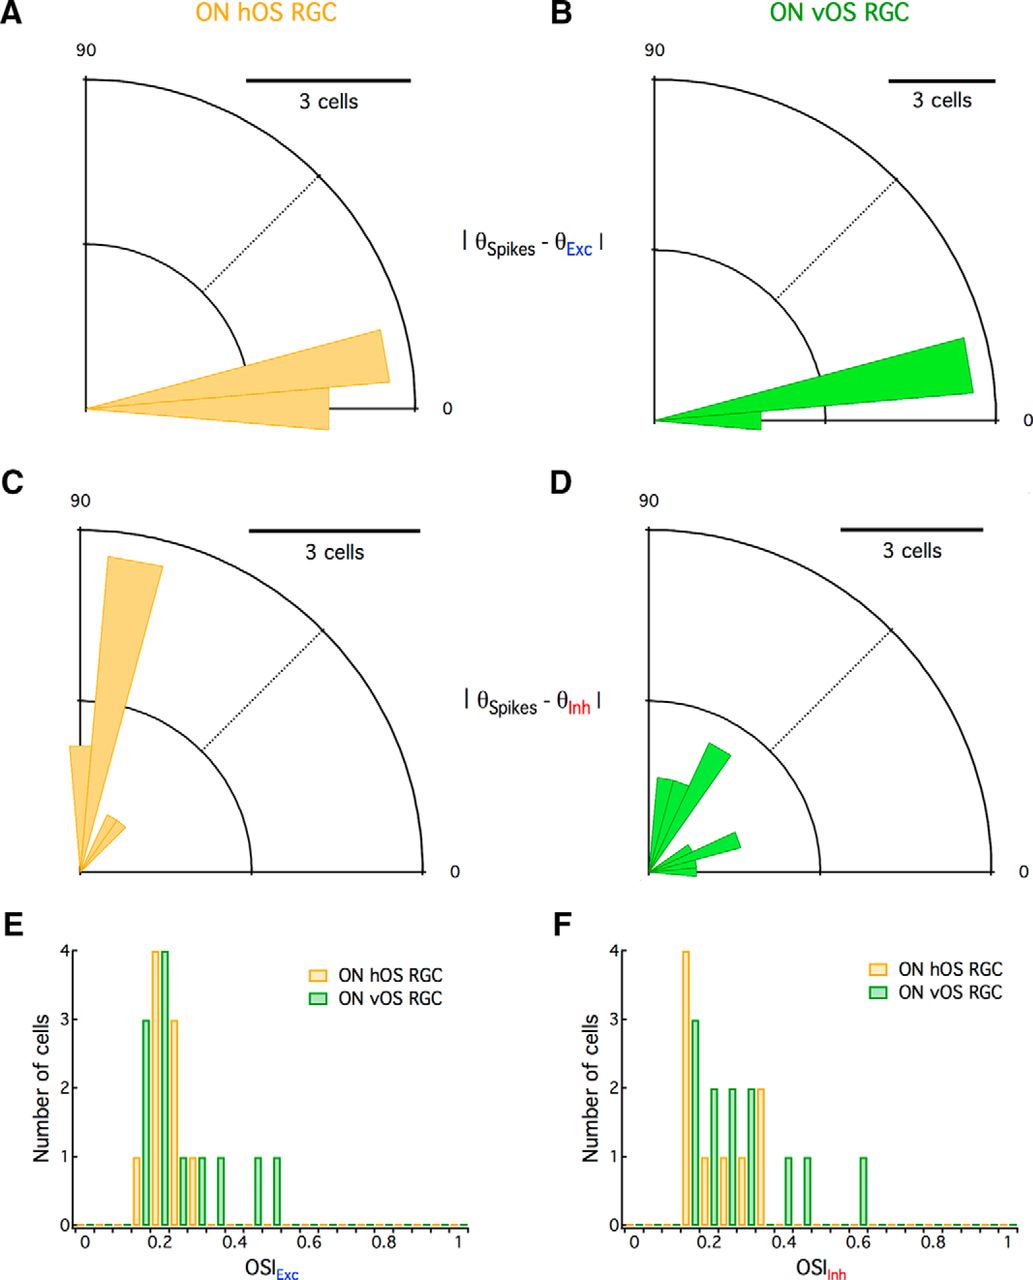
Correlation between synaptic inputs and orientation tuning. A, B, Rose plots of absolute differences between spikes OS angle (θspikes) and excitation OS angle (θExc) of ON hOS RGCs (n = 9; A) and ON vOS RGCs (n = 12; B). C, D, Rose plots of absolute differences between spikes OS angle (θspikes) and inhibition OS angle (θInh) of ON hOS RGCs (C) and ON vOS RGCs (D). E, F, OSI histograms for excitatory and inhibitory inputs received by horizontal and vertical ON OS RGCs. OS angles were calculated as described in Materials and Methods.
- Figure 8.
Pharmacological characterization of synaptic inputs. A, B, Effect of GABA and glycine antagonists on light-step responses of ON OS RGCs. A, Inhibition, B, Excitation. Yellow rectangle indicates period of light stimulus. C, D, Flashed bar responses of a vertical ON OS RGC in presence of inhibitory blockers. C, Inhibition, D, Excitation. Error bars indicate SEM across five trials at each orientation. E–G, Percentage change in excitatory and inhibitory peak amplitudes in inhibitory antagonists for light step (E), preferred orientation (F), and null orientation (G). Orange and green crosses indicate data from individual ON hOS and ON vOS cells, respectively. H, Effect of inhibitory blockers on OSI of excitatory and inhibitory inputs. Error bars indicate SEM (n = 4 for strychnine, n = 4 for gabazine, and n = 8 for both drugs). Orange and green crosses indicate data from individual ON hOS and ON vOS cells, respectively. ***p < 0.001, *p < 0.05.


