

Article Figures & Data
Figures
- Figure 1.
Histological positions of recording sites. A, Example histology of single wires placed in OB, neocortex, and hippocampus. B, Example histology of a linear probe placed across the hippocampus. Red arrows indicate estimated positions of electrode tips. pc, Pyramidal cell layer; hf, hippocampal fissure; gc, granule cell layer; hil, hilus.
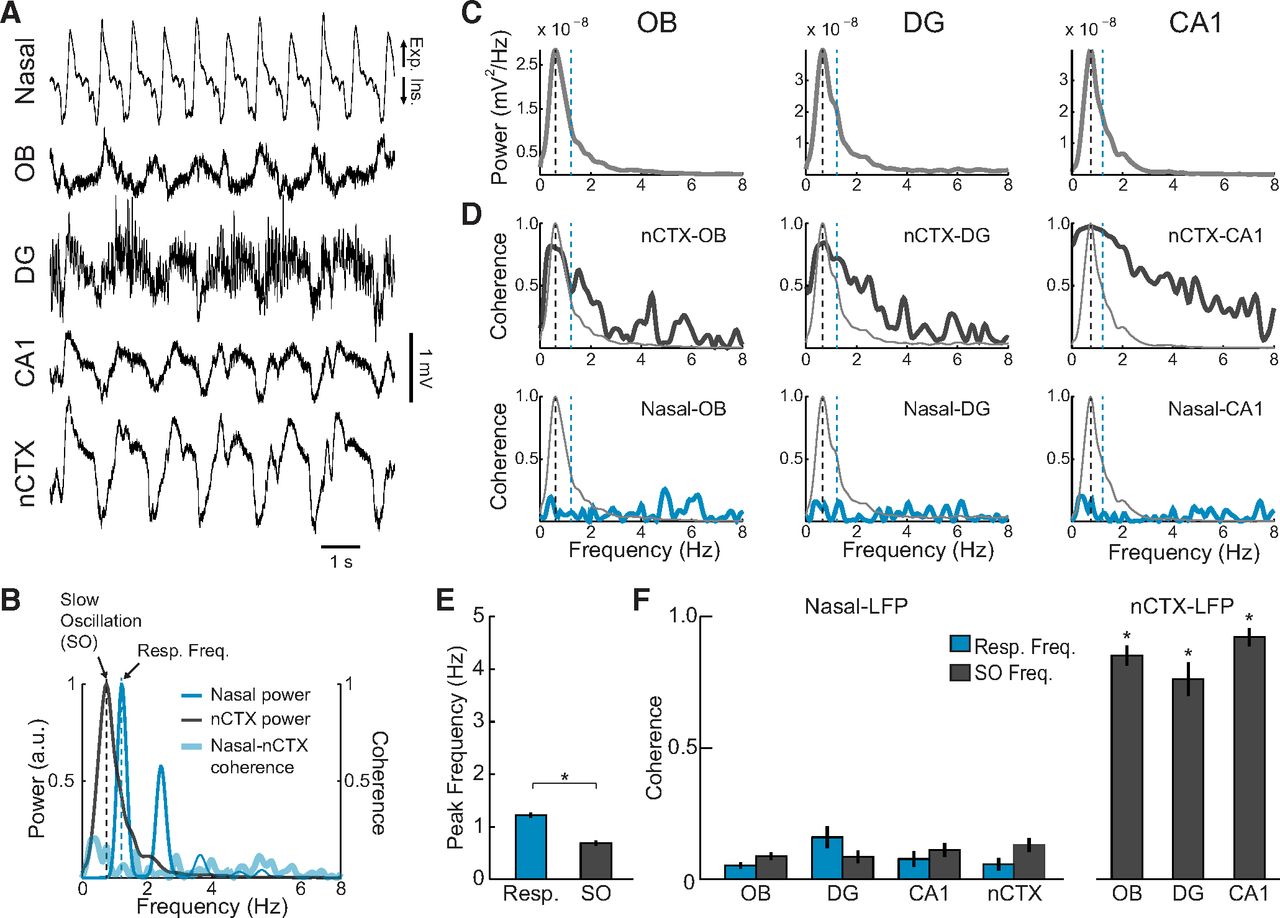
- Figure 2.
The rat hippocampus displays a low-frequency respiration-coupled oscillation (HRR), which coexists with faster theta oscillations during activated states. A, Example raw traces of simultaneous recordings of air pressure in the nasal cavity (nasal) along with LFPs from the OB and hippocampus of a urethane-anesthetized rat (DG; CA1, region 1 of cornu ammonis). B, Power spectrum of the nasal pressure signal, revealing a respiratory rate of ∼1.5 Hz (Resp. Freq., blue dashed line). C, OB, DG, and CA1 power spectra. There are prominent power peaks in OB and DG at the respiratory frequency (blue dashed lines); CA1 has a prominent power peak at the theta frequency range (∼4.5 Hz). D, Coherence spectra between nasal respiration and LFP signals (blue lines). Light gray lines reproduce the power spectra depicted in C. There are coherence peaks at the exact same frequency as respiration and its harmonics, along with lack of coherence at the peak frequency of CA1 theta. Results in B–D were obtained from a 60 s representative data segment of activated state, which included the raw signals depicted in A. E, Mean respiratory and theta peak frequencies across animals (n = 6 rats). *p < 0.001 (paired t test). F, Mean nasal-LFP coherence at respiratory and theta peak frequencies (n = 6 rats). *p < 0.001 (paired t tests). Error bars indicate SEM.
- Figure 3.
The peak frequency of respiration-coupled LFP rhythms in DG and OB follows variations in breathing rate. Example of time-frequency power analysis of a nasal pressure recording (top) and of LFPs simultaneously recorded from OB (middle) and DG (bottom) in a representative animal. Upward arrowheads indicate moments of sharp increase in respiratory frequency. There are similar changes in peak frequency for all signals. Downward arrowhead indicates a period in which OB and DG failed to follow the nasal signal.
- Figure 4.
The rat hippocampus displays a low-frequency oscillation, which is entrained to neocortical SO, but not to respiration, during deactivated states. A, Representative nasal pressure and LFP signals recorded during large-amplitude SO in the neocortex (nCTX). B, Power spectra of the nasal signal (blue) and nCTX LFP (dark gray) (left y-axis). Blue and black dashed lines indicate the respiratory and SO peak frequencies, respectively. Thick blue line indicates the coherence spectrum between nCTX and the nasal signal (right y-axis). C, Power spectra of OB and hippocampal LFPs, which show a power peak ∼1 Hz coinciding with the nCTX SO peak frequency. D, Top, nCTX-LFP coherence spectra, revealing coherence peaks at the SO frequency. Bottom, Nasal-LFP coherence spectra. There is low coherence at all frequencies. Light gray lines reproduce the power spectra in C. Results in B–D were obtained from a 60 s representative data segment of deactivated state, which included the raw signals depicted in A. E, Mean respiratory and SO peak frequencies (n = 4 rats). *p < 0.01 (paired t test). F, Left, Mean nasal-LFP coherence at respiratory and SO peak frequencies. Right, Mean nCTX-LFP coherence at SO peak frequency (n = 4 rats). *p < 0.001, compared with nasal-LFP at SO frequency (paired t tests). Error bars indicate SEM.
- Figure 5.
High LFP power at the respiratory peak frequency is not sufficient for high coherence between respiration and LFP. A, Example power and coherence spectra during a deactivated state period. Bottom, Despite high OB power at the respiratory peak frequency (blue dashed line), nasal-OB coherence is low (thick blue trace). On the other hand, nCTX-OB coherence is high (thick black trace), revealing therefore that the OB power peak corresponds to SO and not RR. B, Distribution of respiration (top) and SO (middle) peak frequencies, as well as of their frequency differences (bottom), assessed in 30-s-long epochs (n = 1370 epochs across 12 rats).
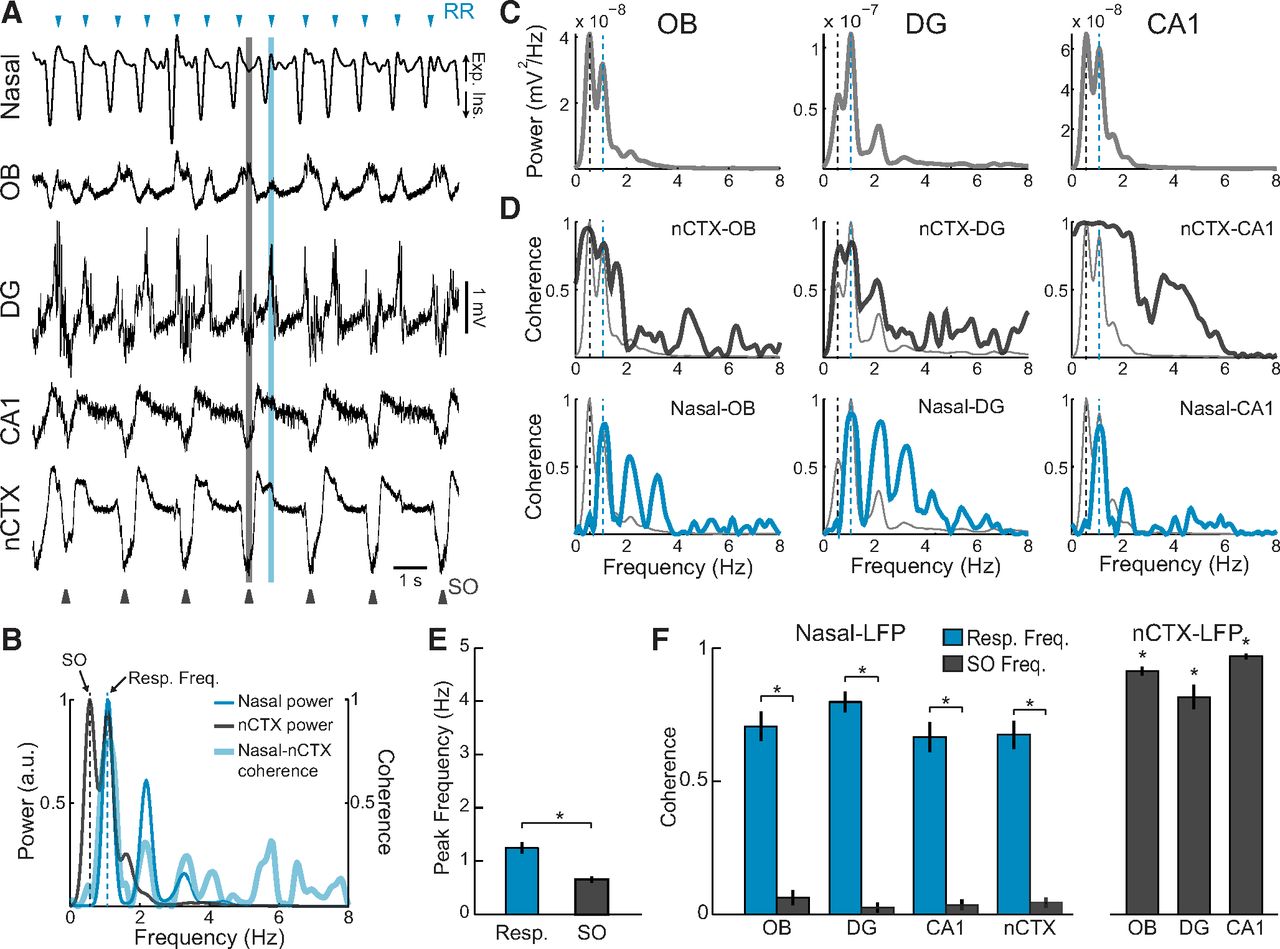
- Figure 6.
Respiration- and neocortex-coupled hippocampal rhythms can simultaneously occur. A, Representative nasal pressure and LFP signals recorded during SO activity in the neocortex (nCTX). Blue arrowheads indicate the peaks of the respiration-coupled rhythm (RR) in OB. Black arrowheads indicate the troughs of neocortical SO. Black and blue vertical lines highlight SO- and respiration-coupled LFP components, respectively. B, Power spectra of the nasal signal (blue) and nCTX LFP (dark gray) (left y-axis). Thick blue line indicates nasal-nCTX coherence (right y-axis). C, Power spectra of LFPs, revealing a power peak (black dashed line) coinciding with the nCTX SO peak frequency and another power peak coinciding with the respiratory peak frequency (blue dashed line). D, nCTX-LFP (top) and nasal-LFP (bottom) coherence spectra. Light gray lines reproduce the power spectra depicted in C. There is high coherence with both neocortical SO and nasal respiration at the corresponding frequencies. Results in B–D were obtained from a 60 s representative data segment of a deactivated state, which included the raw signals depicted in A. E, Mean respiratory and SO peak frequencies (n = 4 rats). *p < 0.01 (paired t test). F, Left, Mean nasal-LFP coherence at respiratory and SO peak frequencies. Right, Mean nCTX-LFP coherence at SO peak frequency (n = 4 rats). *p < 0.001, compared with nasal-LFP at SO frequency (paired t tests). Error bars indicate SEM.
- Figure 7.
Percentage of SO and HRR coexistence during deactivated states. A, Percentage of 60 s epochs within deactivated states with SO alone or with SO coexisting with HRR for each animal. HRR was defined to occur when nasal-LFP coherence was >0.4 at the respiratory frequency. B, Boxplot distribution of the percentage of SO and HRR coexistence within deactivated states across animals (n = 12).
- Figure 8.
Multiple oscillatory patterns appear in the hippocampus during transitions from deactivated to activated states. A, Time-frequency power analysis of nasal pressure and LFP signals. Switching from deactivated to activated LFP states was induced by tail pinch (period between the black arrowheads). B, Traces show the corresponding raw signals. C, Zoomed-in view of the same signals during the three highlighted periods in B. Before tail pinch (Ca), LFPs are dominated by large-amplitude SO activity. During tail pinch (Cb), RR becomes prominent in OB, whereas theta and HRR dominate LFP activity in CA1 and DG, respectively. SO reemerges after several seconds of continued pinching (Cc).
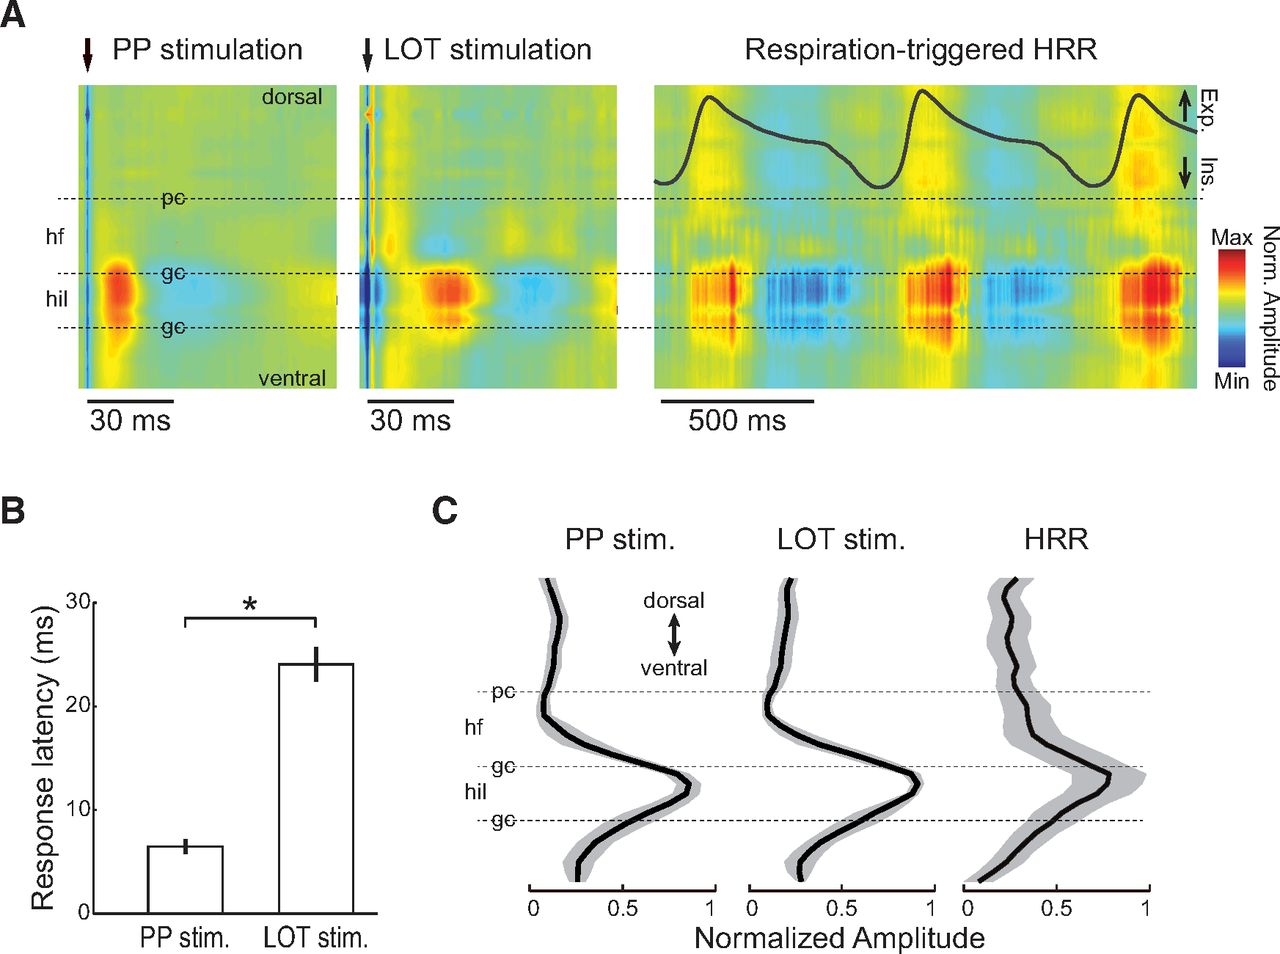
- Figure 9.
HRR has maximum amplitude in the DG hilus. A, Evoked potentials in the hippocampal dorsoventral axis to electrical stimulation of PP (left) and LOT (middle) in a representative animal. PP- and LOT-evoked potentials have maximum amplitude in the DG hilus. Arrows indicate stimulus artifact. Laminar profile of respiration-triggered average HRR activity reveals that HRR is also maximal in the hilus (right). B, Mean (± SEM) evoked potential latency to PP and LOT stimulation (hilus recordings, n = 6 rats). *p < 0.001 (paired t test). C, Mean amplitude of evoked potentials and HRR along the hippocampal dorsoventral axis (n = 6 rats). Gray shades represent ± SEM. Amplitudes were normalized within animals to achieve values between 0 (minimal) and 1 (maximal). pc, Pyramidal cell layer; hf, hippocampal fissure; gc, granule cell layer; hil, hilus.
- Figure 10.
Theta and SO have maximum amplitude in the hippocampal fissure. A, Amplitude of theta and SO along the hippocampal dorsoventral axis. Data from activated (theta) and deactivated (SO) LFP periods of a representative animal. B, Mean (± SEM) theta and SO amplitude along the hippocampal dorsoventral axis (n = 6 rats). Thin blue line indicates mean evoked potential to PP stimulation for reference. pc, Pyramidal cell layer; hf, hippocampal fissure; gc, granule cell layer; hil, hilus.
- Figure 11.
Raw CSD signals in DG exhibit prominent HRR. A, Representative nasal pressure signal (top) and raw CSD traces from hippocampal fissure (middle) and DG hilus (bottom). There is prominent HRR in hilus CSD. B, CSD power and nasal-CSD coherence for the same signals as in A (analyzed time: 80 s). C, Normalized CSD power at respiratory frequency (red) along the hippocampal dorsoventral axis. Black and gray lines indicate the amplitude of PP- and LOT-evoked potentials, respectively. D, Left, Time-frequency power analysis of nasal pressure (top) and of granule cell layer CSD (bottom) during an activated state. There is coexistence of theta and HRR. Right, Power and coherence spectra for the same data, showing high coherence at the respiratory frequency. E, Same as D, but for recordings obtained during a deactivated state. In this case, HRR coexists with SO.
- Figure 12.
Interruption of nasal airflow by tracheotomy abolishes HRR. A, Time-frequency power analysis of nasal pressure and LFP signals recorded from a urethane-anesthetized rat breathing through reversible tracheostomy. Before the opening of the tracheostomy (Nasal Resp.), the LFPs exhibit prominent respiration-coupled rhythms (RR and HRR). After the opening of the tracheostomy (Tracheal Resp., onset indicated by the black arrow), the rhythmic airflow through the nasal cavity as well as RR and HRR vanish immediately. During tracheal respiration, air pressure was also recorded from the tracheal cannula to track respiratory frequency (data not shown; but see Fig. 13). B, Raw signals for the period indicated by the purple arrowheads in A. C, Left, Respiratory peak frequency during nasal (blue) and tracheal respiration (red). Right, Nasal pressure power at the respiratory peak frequency during nasal and tracheal respiration (n = 3 rats). *p < 0.05 (paired t test). D, Left, Power spectrum of nasal pressure during nasal respiration (top), and nasal-LFP and OB-DG coherence spectra for the same period (bottom). There is high coherence at the respiratory frequency. Right, Power spectrum of tracheal pressure during tracheal respiration (top), along with tracheal-LFP and OB-DG coherence (bottom). There is lack of coherence among signals during tracheal respiration. E, Mean (± SEM) respiration-LFP and OB-DG coherence at the respiratory frequency during nasal (blue bars) and tracheal respiration (red bars) (n = 3 rats). *p < 0.05 (paired t tests).
- Figure 13.
Rhythmic air-puffing into the nasal cavity restores coherent oscillations in OB and DG in tracheotomized rats. A, Time-frequency power analysis of tracheal pressure, nasal pressure, and LFP signals recorded from a urethane-anesthetized rat breathing through tracheostomy. Air puffing into the nasal cavity at 1 Hz drives an oscillatory LFP activity in OB and DG at the same frequency. B, Raw signals for the period indicated by the purple arrowheads in A. C, Left, Power spectra of tracheal and nasal pressure signals during tracheal respiration before the onset of air puffing (top). Bottom, Tracheal-LFP, nasal-LFP, and OB-DG coherence spectra for the same period. Right, Similar as before, but during tracheal respiration along with air-puffing into the nasal cavity. There is high nasal-LFP and OB-DG coherence at the frequency of air puffs (1 Hz) and no LFP coherence with the tracheal pressure signal. D, Mean (± SEM) tracheal-LFP, nasal-LFP, and OB-DG coherence during tracheal respiration alone (black bars) and during tracheal respiration along with air puffs (white bars) (n = 3 rats). *p < 0.05 (paired t tests).


