

Article Figures & Data
Figures
- Figure 1.
The task, lesions, behavior, and recording locations. The task (a) had four different blocks, or states, defined by the set of available response–reward contingencies. Trials began with an instructional odor, indicating a free-choice or forced-choice, after which rats responded at one of the two fluid wells for 1 or 3 drops of chocolate or vanilla milk. Reward contingencies were stable across blocks of ∼60 trials, but at unsignaled transitions the number of drops or flavor changed on both sides (only 1 of the 4 possible block sequences is shown). Unilateral neurotoxic lesions of orbitofrontal cortex (OFC) (b) were made in one group of rats (numbers are millimeters from bregma). Groups with sham lesions or unilateral lesions of OFC were similarly sensitive to changes in the number of drops (c), and similarly insensitive to changes in the flavor (d). Line figures show average trial-by-trial choice rates across transitions; bar graphs summarize these data by showing average choice rates in the last 20 trials of the previous block versus the first 20 of the new block; scatter plots show rat-by-rat difference scores (choice rate after minus choice rate before) with length of lines showing SEs. e, The approximate locations of recordings and proportions of putative cell types in each of the four groups. The width of each box represents 1 mm. FSI, Fast-spiking interneuron. *p < 0.001.
- Figure 2.
Cell-type separation. a, MSNs were first separated from other neurons [including fast-spiking interneurons (FSIs)] using a three-dimensional cluster analysis on all recorded units (left). Subsequently, putative CINs were selected by taking the average spike-to-spike CV2 of every unit’s entire spike-train. The criteria for CINs was CV2 <0.85 and average firing rate <8 spikes/s, which were based on measurements from histochemically confirmed CINs reported in published juxtacellular recordings. These criteria effectively discriminated CINs from separately defined MSNs (right; CV2 distribution, low-firing rate MSNs versus putative CINs). The upper limit of the CIN criterion is outside of the 1-a confidence interval for low-firing rate MSNs with a = 0.028. b, Resulting average waveforms for each cell type in each recording group (the dotted line represents the 0 voltage level. Scale bar, 100 ms. Shading represents SE). Note that CINs were not selected based on waveform, whereas MSNs and FSIs were. FSIs were not analyzed for this report.
- Figure 3.
DMS CINs track the current state (i.e., block) across trials. Plots in a and b show a bin-by-bin average index of block-selectivity for the entire DMS (n = 26) and DLS (n = 16) CIN populations, respectively, averaged by each neuron’s preferred direction (defined as direction with highest average firing rate during the choice movement; left) or anti-preferred direction (right). Only correct forced-choice trials after the first 20 correct trials in blocks were included in these averages. Bins were aligned to multiple trial events separated by the average time between them. Block-selectivity scores of individual DMS CINs were strongly correlated between different epochs across the trial (c), but this was not true of DLS CINs (b). c, d, Left, Scores for pre-odor epoch versus post-reward epoch; other pairs of epochs are summarized on the right. All R2 values for DMS CINs were significant at p < 0.001, average R2 = 0.61. For DLS CINs, none of thx R2 values were significant at p < 0.05 (p values > 0.13); average R2 = 0.07.
- Figure 4.
DMS CIN pseudo-ensembles decode the current state (i.e., block) across the trials. The top plot shows block decoding accuracy of a pseudo-ensemble of 25 DMS CINs versus MSNs across the trial. All rewarded trials after the first 20 correct trials in blocks were used in the decoder, regardless of direction. Bottom plots show decoding accuracy as a function of ensemble size for three 1 s epochs across the trial. **p < 0.01.
- Figure 5.
On suboptimal (i.e., inappropriate) choices, DMS CINs miscoded the block as the one that would have been appropriate for that choice. Top plots show percentage accurate block decoding (a) and percentage miscoding as the opposite drop-number block (b), by a pseudo-ensemble of 12 CINs or MSNs on suboptimal choices. Twelve CINs were recorded in sessions with enough such free-choices. Bottom plots show accurate decoding and miscoding as a function of ensemble size for three 1 s epochs across the trial. c, Bars show average (±SE) reaction time by trial type. Reaction times were faster for big reward than small reward, showing that faster reaction times occurred when more valuable rewards were predicted. However, free-choices of the small reward, suboptimal choices, were still significantly faster than forced-choices of the small reward, suggesting an inaccurate (and perhaps optimistic) prediction as to the number of drops to be received on those trials. **p < 0.01.
- Figure 6.
Decoder performance on free-choices of the big reward (i.e., optimal choices) compared with that on free-choices of the small reward (i.e., suboptimal choices). a, c, Top plots show block decoding accuracy of a pseudo-ensemble of 12 DMS CINs (a) or 12 DMS MSNs (c), during sliding 500 ms epochs across the trial. The same procedures were used as for the analysis shown in Figure 5, except that only free-choices of the big reward were tested. For comparison, data from small free-choices (suboptimal choices), shown in Figure 5, is also plotted here in dotted lines. Bottom plots show decoding accuracy as a function of ensemble size for the same three epochs shown in Figure 4. b, d, Top plots show percentage of test trials in which the block decoder from the corresponding plot (in a and c, respectively) misclassified the block as the one with the opposite drop-number rewards but the same flavor. Bottom plots show the misclassification percentage as a function of ensemble size. *p < 0.05 **p < 0.01.
- Figure 7.
MSNs block decoding is “yoked” to CIN decoding during execution of suboptimal choices. a–d, Top plots show block decoding accuracy of pseudo-ensembles of MSNs recorded in the same sessions as CINs. a, c, MSN decoding yoked to CIN decoding on suboptimal choices, meaning the percentage of trials on which MSN ensembles identified the same block as the CIN ensembles. b, d, Block decoding accuracy of the same MSN ensembles as a and c (i.e., not yoked to CINs). Bottom plots show decoding accuracy as a function of ensemble size for three 500 ms epochs across the trial. (starting 1000 ms before choice initiation, 100 ms before choice initiation, and at first reward delivery, respectively). **p < 0.01 compared with 0.
- Figure 8.
DMS CINs also coded the direction of free-choice before and after it occurred better than MSNs. Top plot shows choice-direction decoding accuracy of a pseudo-ensemble of 25 CINs or MSNs. Only free-choice trials across entire sessions were used; therefore significant decoding of direction before the choice could only reflect an internal intention or state. Bottom plots show decoding accuracy as a function of ensemble size for three 1 s epochs across the trial. **p < 0.001.
- Figure 9.
OFC lesions eliminate state encoding in DMS CINs. As in Figure 3, plots in a and b show a bin-by-bin average index of block-selectivity for the entire DMS (a) and DLS (b) CIN population in OFC-lesioned rats compared with those in sham rats. Block-selectivity scores of individual CINs in c and d show that OFC lesions eliminated the consistency of block-selectivity across the trial in DMS CINs (c) without affecting that in DLS CINs (d). Left, Scores in a pre-odor epoch versus post-reward epoch; other pairs of epochs are summarized on the right.
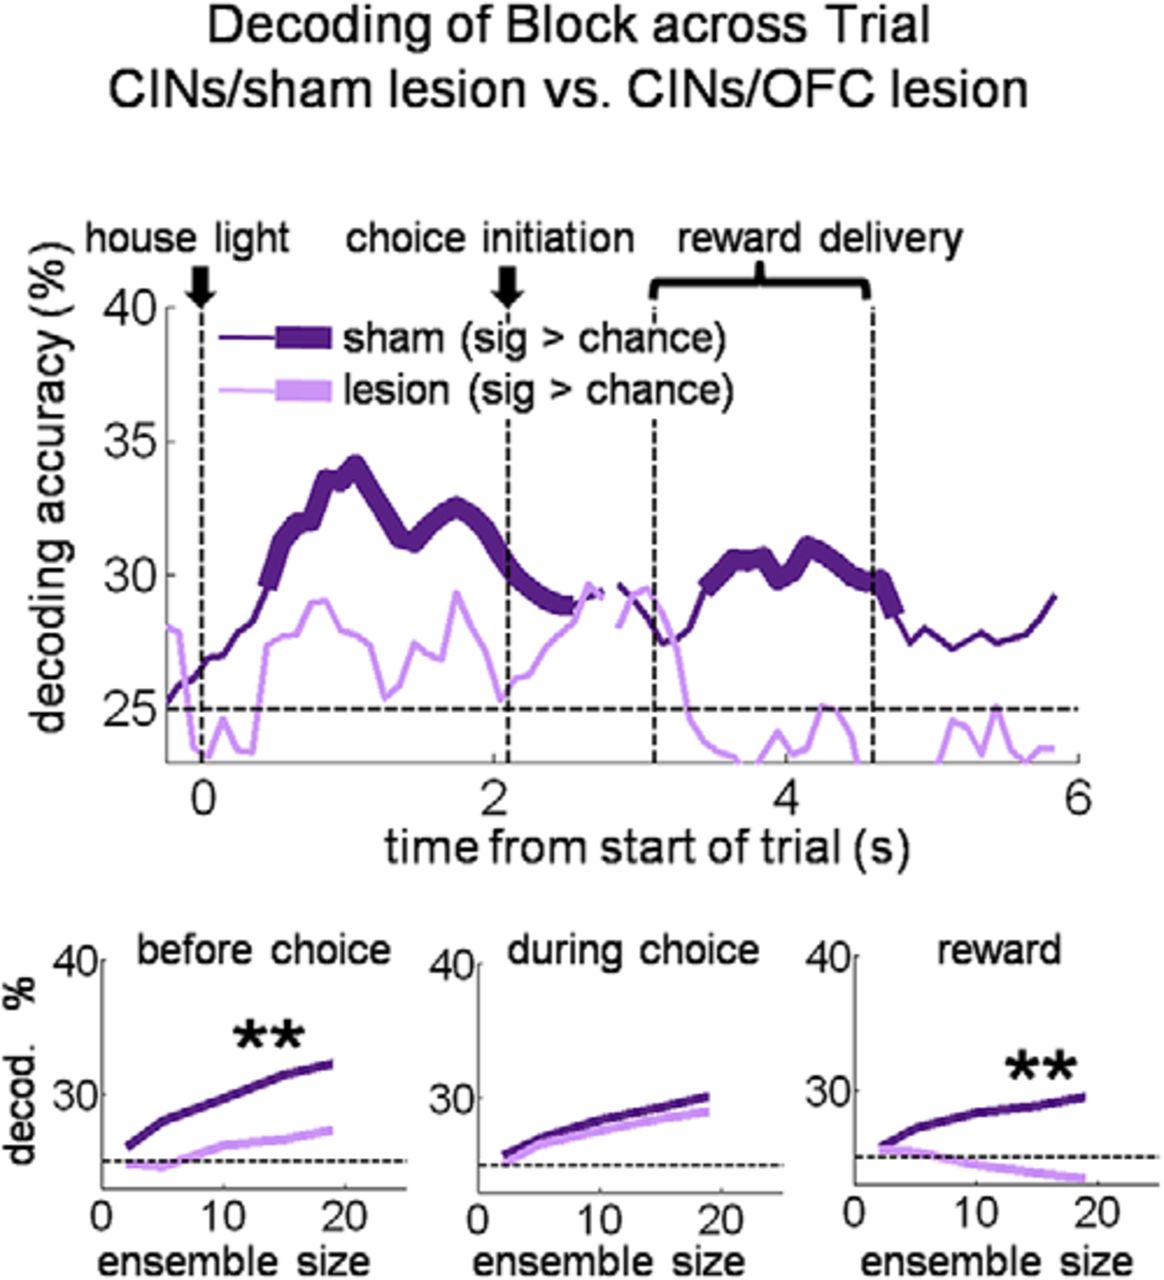
- Figure 10.
OFC lesions eliminate state encoding in DMS CINs. As in Figure 4, top plot shows block decoding accuracy of a pseudo-ensemble of 19 DMS CINs in OFC-lesioned rats (only 19 neurons were recorded in blocks with a sufficient number of trials) versus those in sham rats, also with a pseudo-ensemble of 19 neurons for comparison. Bottom plots show decoding accuracy as a function of ensemble size for three 1 s epochs across the trial. **p < 0.01.
- Figure 11.
DMS CINs recorded in rats with OFC lesions decode trial stimuli better than those in sham rats. Top plots show odor identity (a) and reward number (b) decoding accuracy of a pseudo-ensemble of 24 DMS CINs in shams versus OFC lesions, during sliding 200 ms epochs across the trial. All correct trials were included and therefore for odor identity, three odors had to be decoded (the forced-choice left, forced-choice right, and free-choice odors). Note that because of correction trials and the pseudorandom sequence of trials, some limited information about the upcoming trial-type could be derived before odor delivery began. Bottom plots show decoding accuracy as a function of ensemble size for three epochs each: for odor decoding, 1 s ending with the beginning of odor delivery, the 500 ms of odor delivery, and the 1 s immediately following odor delivery; for reward number decoding, 1 s ending with the beginning of reward delivery, the period of reward delivery and consumption (1500 ms beginning with delivery of the first drop of reward), and 1 s immediately after the end of the reward delivery epoch. **p < 0.01.
- Figure 12.
Ipsilateral OFC lesions eliminate the relationship between free-choices of the small reward and miscoding of the block in DMS CINs. Top plots show percentage accurate block decoding (a) and percentage miscoding as the opposite drop-number block (b), by a pseudo-ensemble of 12 CINs in sham rats or ipsilateral OFC-lesioned rats on suboptimal choices. Bottom plots show accurate decoding and miscoding as a function of ensemble size for three 1 s epochs across the trial. c, Bars show average (±SE) reaction time by trial type in lesioned rats. The pattern of reaction times was the same as in sham rats (Fig. 5); that is, they were faster for big reward than small reward, but free-choices of the small reward, suboptimal choices, were similarly fast to those when a big reward was expected, suggesting an inaccurate prediction as to the number of drops to be received on those trials. d, Top plot shows choice-direction decoding accuracy of a pseudo-ensemble of 24 CINs in sham rats or ipsilateral OFC-lesioned rats. Only free-choice trials were used; therefore significant decoding of direction before the choice could only reflect an internal intention or state. Bottom plots show decoding accuracy as a function of ensemble size for three 1 s epochs across the trial. **p < 0.01.


Tables
- Table 1.
Correlations between block-selectivity indices in pairs of epochs in CINs recorded in DMS sham rats (related to Fig. 3c)
Epochs Before odor Odor/choice Reward Odor/choice R2 = 0.45 p < 0.0001 Reward R2 = 0.49 R2 = 0.62 p < 0.0001 p < 0.0001 After reward R2 = 0.47 R2 = 0.46 R2 = 0.54 p < 0.0001 p < 0.0001 p < 0.0001 - Table 2.
Correlations between block-selectivity indices in pairs of epochs in CINs recorded in DLS in sham rats (related to Fig. 3d)
Epochs Before odor Odor/choice Reward Odor/choice R2 = 0.01 p = 0.73 Reward R2 = 0.00 R2 = 0.08 p = 0.81 p = 0.29 After reward R2 = 0.19 R2 = 0.00 R2 = 0.35 p = 0.092 p = 1.00 p < 0.05 Condition CINs or MSNs Before choice During choice Reward Block decoding accuracy all trials, shams (Fig. 4) CINs 3.0 ± 1.1 2.4 ± 1.0 2.1 ± 0.4 MSNs 1.4 ± 0.7 1.8 ± 1.0 1.4 ± 0.5 Accuracy on suboptimal choices, shams (Fig. 5a) CINs −10.6 ± 4.1 −7.3 ± 2.7 −5.4 ± 3.9 MSNs 1.6 ± 1.2 2.3 ± 0.5 1.9 ± 2.8 Miscoding on suboptimal choices, shams (Fig. 5b) CINs 11.2 ± 8.2 17.3 ± 10.0 9.5 ± 4.8 MSNs −0.2 ± 3.1 2.5 ± 5.3 −1.3 ± 2.9 Accuracy on optimal choices, shams (Fig. 6a) CINs 3.2 ± 3.3 1.5 ± 3.3 0.8 ± 2.7 MSNs 1.0 ± 5.1 2.2 ± 1.8 2.2 ± 1.8 Miscoding on optimal choices, shams (Fig. 6b) CINs −3.0 ± 1.7 −1.9 ± 0.8 −1.7 ± 2.3 MSNs −1.2 ± 3.2 −2.1 ± 2.0 −1.8 ± 2.9 % Yoked, suboptimal trials (Fig. 7a) MSNs −0.2 ± 1.9 24.7 ± 6.9 −3.3 ± 1.9 Accuracy of yoked MSNs, suboptimal trials (Fig. 7b) MSNs 3.1 ± 1.5 −11.9 ± 0.8 −5.9 ± 1.6 % Yoked, optimal trials (Fig. 7c) MSNs 4.0 ± 2.8 2.9 ± 2.2 2.1 ± 2.4 Accuracy of yoked MSNs, optimal trials (Fig. 7d) MSNs 6.3 ± 1.8 7.5 ± 2.3 8.6 ± 1.6 Choice-direction decoding accuracy, shams (Fig. 8) CINs 11.8 ± 0.57 16.0 ± 5.2 13.0 ± 2.0 MSNs 5.8 ± 1.7 11.6 ± 3.3 7.6 ± 2.5 Block decoding accuracy all trials, OFC lesions (Fig. 10) CINs 0.3 ± 0.4 0.4 ± 2.0 0.4 ± 0.4 Accuracy on suboptimal choices, OFC lesions (Fig. 12a) CINs −1.2 ± 3.0 0.14 ± 1.1 2.5 ± 2.7 Miscoding on suboptimal choices, OFC lesions (Fig. 12b) CINs −4.8 ± 2.0 0.1 ± 2.8 −1.0 ± 3.5 Choice-direction decoding accuracy, OFC lesions (Fig. 12d) CINs 7.6 ± 2.8 14.6 ± 2.4 5.7 ± 2.8 Sham or lesion Before odor During odor After odor Odor identity decoding accuracy (Fig. 11a) Sham 0.3 ± 1.3 3.6 ± 1.1 11.7 ± 2.1 OFC lesion 4.7 ± 2.2 10.5 ± 2.8 11.1 ± 2.2 Sham or lesion Before reward During reward After reward Reward amount decoding accuracy (Fig. 11b) Sham 3.5 ± 2.6 3.3 ± 0.9 9.1 ± 4.1 OFC lesion 6.5 ± 1.8 13.5 ± 2.6 13.0 ± 2.0 Decoding accuracy as a function of ensemble size curves were fit to a log function with two parameters (see Materials and Methods). Shown are the estimates (± 95% confidence intervals) for the parameter, B1, which controls the rise of the function and thus provides a measure of how much information about the decoded variable is on average contained in that population of neurons. Estimates and confidence intervals were estimated using the MATLAB function nlparci. Significance was determined by finding the smallest α level that resulted in non-overlapping confidence intervals between fitted parameters from the two different populations, with p = (minimum non-overlapping α)2 and significance criterion at p < 0.01. Significance is indicated by the bold font for the following comparisons: (1) for MSNs on all trials and on suboptimal choices versus CINs in the corresponding condition; (2) for MSNs and CINs on optimal choices versus the corresponding population on suboptimal choices; and (3) for OFC lesion conditions versus corresponding sham conditions.
- Table 4.
Correlations between block-selectivity indices in pairs of epochs in DMS CINs recorded in OFC-lesioned rats (related to Fig. 9c)
Epochs Before odor Odor/choice Reward Odor/choice R2 = 0.14 p = 0.027 Reward R2 = 0.27 R2 = 0.10 p = 0.0011 p = 0.057 After reward R2 = 0.00 R2 = 0.01 R2 = 0.00 p = 0.71 p = 0.55 p = 0.82 - Table 5.
Correlations between block-selectivity indices in pairs of epochs in DLS CINs recorded in OFC-lesioned rats (related to Fig. 9d)
Epochs Before odor Odor/choice Reward Odor/choice R2 = 0.03 p = 0.37 Reward R2 = 0.19 R2 = 0.21 p < 0.05 p < 0.05 After reward R2 = 0.03 R2 = 0.50 R2 = 0.26 p = 0.36 p < 0.0001 p < 0.01


