

Article Figures & Data
Figures
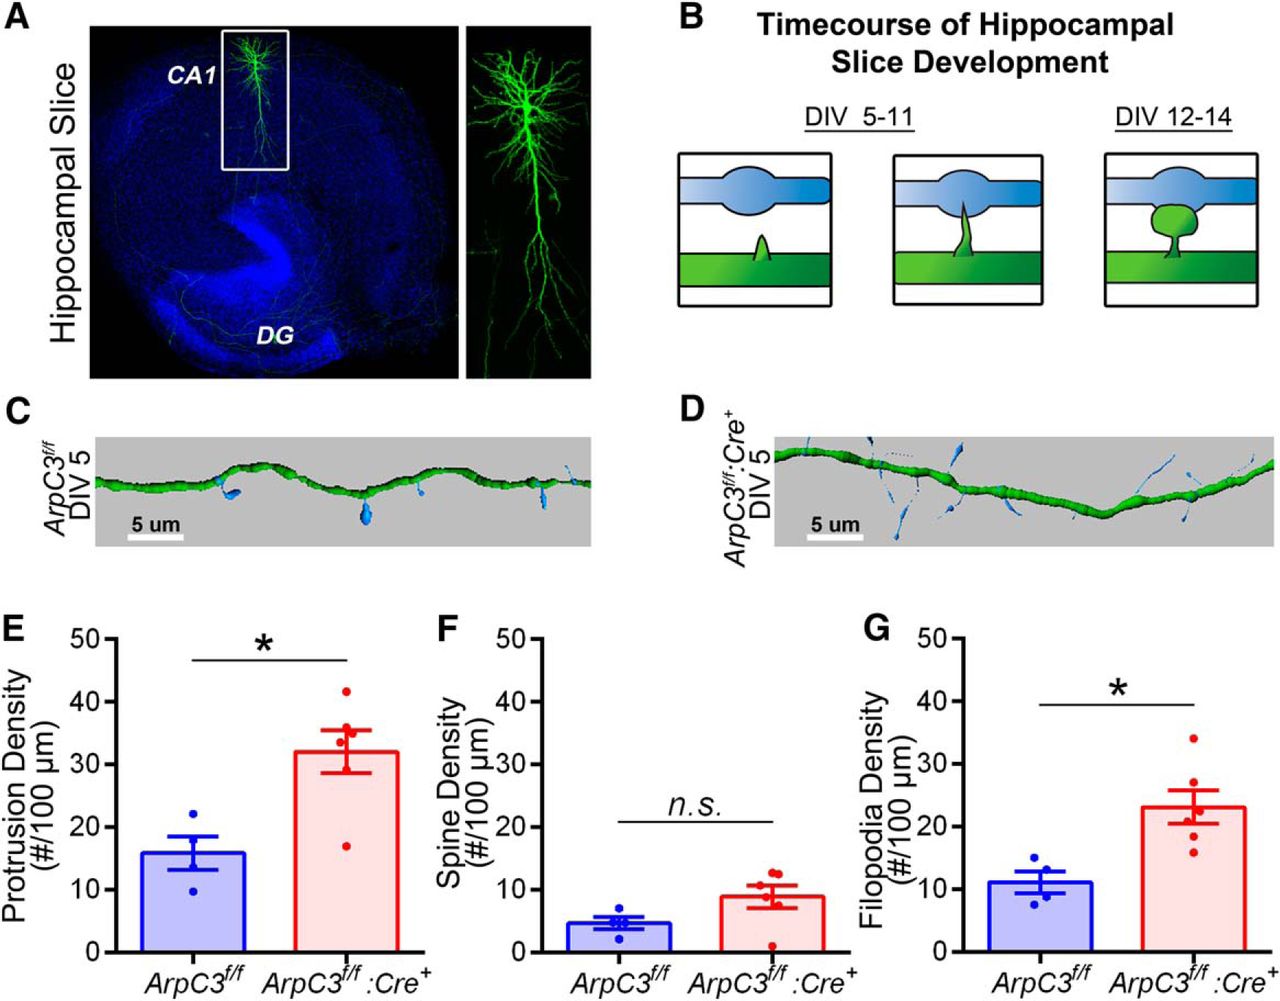
- Figure 1.
Arp2/3 inhibits initial filopodia formation, yet promotes spine maturation. A, Representative image of a hippocampal slice with sparse biolistic GFP transfection. DG, dentate gyrus. B, Schematic of developmental timeline for morphological maturation of dendritic spines in organotypic hippocampal slice cultures. A dendrite with a developing spine is shown in green, and a presynaptic terminal is shown in blue. C, D, Representative reconstructed confocal images of spine morphology at DIV 5 for ArpC3f/f (WT; C) and ArpC3f/f:Cre+ (KO; D) neurons. E, Graph depicting protrusion density for WT (16 ± 3 protrusions/100 μm, n = 4 slices) versus KO (32 ± 3 protrusions/100 μm, n = 6 slices) neurons; p = 0.010. F, G, Graphs depicting spine (F; WT, 5 ± 1 protrusions/100 μm; KO, 9 ± 2 protrusions/100 μm; p = 0.113) and filopodia (G; WT, 11 ± 2 protrusions/100 μm; KO, 23 ± 3 protrusions/100 μm; p = 0.011) density for WT versus KO neurons. Error bars are SEM. *p < 0.05. Scale bars, 5 μm.
- Figure 2.
Arp2/3 and Rac inhibit initial filopodia formation in dissociative cultures. A, Schematic of developmental timeline for morphological maturation of dendritic spines in primary hippocampal neuron cultures. A dendrite with a developing spine is shown in green, and a presynaptic terminal is shown in blue. B, Schematic depicting Arp2/3 complex signaling cascade. C, D, Representative confocal images of ArpC3f/f (WT) and ArpC3f/f:Cre+ (KO) morphology at DIV 8. E, Graph depicting protrusion density for ArpC3f/f WT (24 ± 2 protrusions/100 μm, n = 15 neurons) versus KO (42 ± 3 protrusions/100 μm, n = 17 neurons) neurons; p < 0.0001. F, G, Representative confocal images of spine morphology of Racf/f (WT) and Racf/f:Cre+ (KO) morphology at DIV 8. H, Graph depicting protrusion density for Rac WT (27 ± 2 protrusions/100 μm, n = 22 neurons) versus KO (38 ± 2 protrusions/100 μm; n = 29 neurons) neurons; p = 0.001. Error bars are SEM. **p < 0.01; ****p < 0.0001. Scale bars, 5 μm.
- Figure 3.
Loss of Arp2/3 activity prevents dendritic spine morphological maturation. A, B, Representative reconstructed confocal images of spine morphology at DIV 12–14 for ArpC3f/f (WT; A) and ArpC3f/f:Cre+ (KO; B) neurons. C, Graph depicting protrusion density for WT (66 ± 6 protrusions/100 μm, n = 6 slices) versus KO (57 ± 5 protrusions/100 μm, n = 9 slices) neurons; p = 0.181. D, E, Graphs depicting spine (D; WT: 65 ± 5 protrusions/100 μm, n = 6 slices; KO: 21 ± 3 protrusions/100 μm, n = 9 slices; p < 0.0001) and filopodia (E; WT: 2 ± 1 protrusions/100 μm, n = 6 slices; KO: 35 ± 5 protrusions/100 μm, n = 9 slices; p < 0.0001) density for WT versus KO neurons. F, Experimental timeline for FLEx-ArpC3 morphology rescue experiment. G–J, Representative reconstructed image of GFP-virus control (ArpC3f/f:FLEx-GFP; G), ArpC3-virus control (ArpC3f/f:FLEx-ArpC3; H), ArpC3 KO (ArpC3f/f:Cre+:FLEx-GFP; I), and ArpC3 Rescue (ArpC3f/f:Cre+:FLEx-ArpC3; J). K, Graph depicting protrusion density for ArpC3f/f versus ArpC3f/f:Cre+ neurons with either FLEx-GFP or FLEx-ArpC3. ArpC3f/f:FLEx-GFP: 88 ± 4 protrusions/100 μm, n = 5 slices; ArpC3f/f:Cre+:FLEx-GFP: 82 ± 9 protrusions/100 μm, n = 3 slices; ArpC3f/f:Cre+:FLEx-GFP: 46 ± 4 protrusions/100 μm, n = 5 slices; ArpC3f/f:Cre+:FLEx-ArpC3: 83 ± 10 protrusions/100 μm, n = 6 slices. F(3,15) = 6.965, p = 0.008. L, Graph depicting spine density for ArpC3f/f versus ArpC3f/f:Cre+ neurons with either FLEx-GFP or FLEx-ArpC3. ArpC3f/f:FLEx-GFP: 82 ± 4, n = 5 slices; ArpC3f/f:Cre+:FLEx-GFP: 75 ± 8 spines/100 μm, n = 3 slices; ArpC3f/f:Cre+:FLEx-GFP: 23 ± 3 spines/100 μm, n = 5 slices; ArpC3f/f:Cre+:FLEx-ArpC3: 74 ± 7 spines/100 μm, n = 6 slices. F(3,15) = 23.47, p < 0.0001. M, Graph depicting filopodia density for ArpC3f/f versus ArpC3f/f:Cre+ neurons with either FLEx-GFP or FLEx-ArpC3. ArpC3f/f:FLEx-GFP: 5 ± 2 filopodia/100 μm, n = 5 slices; ArpC3f/f:Cre+:FLEx-GFP: 7 ± 2 filopodia/100 μm, n = 3 slices; ArpC3f/f:Cre+:FLEx-GFP: 23 ± 5 filopodia/100 μm, n = 5 slices; ArpC3f/f:Cre+:FLEx-ArpC3: 9 ± 4 filopodia/100 μm, n = 6 slices. F(3,15) = 4.868, p = 0.054. Error bars are SEM. *p < 0.05; **p < 0.01; ****p < 0.0001. Scale bars, 5 μm.
- Figure 4.
mDia2 interacts with the Arp2/3 activator WAVE and promotes initial dendritic protrusions in the absence of ArpC3. A, Immunoblot analysis of whole-brain lysate for mDia2 expression, WAVE expression, and Arp3 expression at specific developmental time points. Molecular markers of mass are indicated to the left of each immunoblot. β-Actin was used as a loading control. B, Quantification of WAVE relative density adjusted to the β-actin loading control and normalized to P0; n = 3 cohorts of mice. P5, 1.28 ± 0.25 a.u.; P7, 1.455 ± 0.36 a.u.; P14, 2.22 ± 0.36 a.u.; P21, 3.35 ± 0.75 a.u.; P42, 2.93 ± 0.86. a.u. C, Quantification of mDia2 relative density adjusted to the β-actin loading control and normalized to P0; n = 3 cohorts of mice. P5, 0.93 ± 0.10 a.u.; P7, 0.50 ± 0.15 a.u.; P14, 0.18 ± 0.03 a.u.; P21, 0.21 ± 0.04 a.u.; P42, 0.13 ± 0.04 a.u. D, Quantification of Arp3 relative density adjusted to the β-actin loading control and normalized to P0; n = 3 cohorts of mice. P5, 1.87 ± 0.14 a.u.; P7, 1.98 ± 0.47 a.u.; P14, 2.13 ± 0.53 a.u.; P21, 1.56 ± 0.27 a.u.; P42, 1.08 ± 0.27 a.u. E, Left, Immunoblot for mDia2 from whole-brain lysates from P7 mice. Right, Control (IgG alone) and WAVE coimmunoprecipitation (IP) with mDia2. Markers of molecular mass are indicated to the left of each immunoblot. F–I, Representative reconstructed confocal image of WT scrambled RNAi (scRNAi) control (ArpC3f/f:scRNAi; F), KO scRNAi control (ArpC3f/f:Cre+:scRNAi; G), WT mDia2 RNAi knockdown (ArpC3f/f:mDia2 RNAi; H), and KO mDia2 RNAi knockdown (ArpC3f/f:Cre+:mDia2 RNAi; I). J, Graph depicting protrusion density for ArpC3f/f versus ArpC3f/f:Cre+ neurons with either scRNAi or mDia2 siRNA. ArpC3f/f:scRNAi: 17 ± 2 protrusions/100 μm, n = 10 slices; ArpC3f/f:Cre+:scRNAi: 35 ± 4 protrusions/100 μm, n = 8 slices; ArpC3f/f:mDia2 RNAi: 15 ± 3 protrusions/100 μm, n = 14 slices; ArpC3f/f:Cre+:mDia2 RNAi: 15 ± 3 protrusions/100 μm, n = 11 slices. F(1,39) = 8.956, p = 0.017. Error bars are SEM. **p < 0.01; ****p < 0.0001. Scale bars, 5 μm.
- Figure 5.
ArpC3-deficient neurons recruit MAGUK proteins and make presynaptic contact but do not enrich synaptic AMPARs. A, B, Representative images of DIV 12 neurons from hippocampal primary cultures. The green signal is PSD-95-monobody-GFP, and the red signal is either tdTomato (WT, ArpC3f/f; A) or xCre-2A-tdTomato (KO, ArpC3f/f:Cre+; B). The magenta signal is immunofluorescence for the presynaptic marker Bassoon. C, Graph depicting percentage of dendritic protrusions with Bassoon puncta. WT: 49 ± 6 puncta/100 μm, n = 18 neurons; KO: 54 ± 10 puncta/100 μm, n = 8 neurons; p = 0.68. D, Graph depicting percentage of dendritic protrusions with PSD-95-monobody-GFP puncta. WT: 44 ± 5 puncta/100 μm, n = 18 neurons; KO: 50 ± 5 puncta/100 μm, n = 8 neurons; p = 0.51. E, Colocalization of both PSD-95-monobody-GFP and Bassoon puncta. WT: 28 ± 6 puncta/100 μm, n = 18; KO: 35 ± 11 puncta/100 μm, n = 8; p = 0.59. F, G, Representative images of DIV 12–17 slice culture neurons expressing SEP-GluA1 and SEP-GluA2 (1:1 molar ratio) and either tdTomato (ArpC3f/f; F) or Cre-2A-tdTomato (ArpC3f/f:Cre+; G). H, Graph depicting the ratio of protrusion SEP-GluA1/GluA2 intensity to dendrite intensity. WT: 1.52 ± 0.21 a.u., n = 12 slices; KO: 0.66 ± 0.08 a.u., n = 24 slices, p = 0.002. I, Graph depicting the ratio of SEP intensity to tdTomato intensity in the dendrite. WT: 0.54 ± 0.11 a.u., n = 12 slices; KO: 0.54 ± 0.13 a.u., n = 24 slices, p = 0.645. J, Graph depicting the ratio of spine and filopodia SEP-GluA1/GluA2 intensity to dendrite intensity. WT spines: 1.61 ± 0.20 a.u., n = 12 slices; KO spines: 0.84 ± 0.07 a.u., n = 22 slices, p < 0.0001; WT filopodia: 0.60 ± 0.06 a.u., n = 7 slices; KO filopodia: 0.56 ± 0.08 a.u., n = 24 slices, p = 0.35. K, L, Representative images of DIV 12–17 slice culture neurons expressing SEP-GluA1 and SEP-GluA2 before FRAP (t = −1), 2 min after FRAP (t = 2), and 10 min after FRAP (t = 10). M, Graph depicting percentage recovery of SEP-GluA1/GluA2 fluorescence in photobleached dendritic protrusions after photobleaching over time. F(2,65) = 0.50, p = 0.649. Shaded regions represent the 95th percentile confidence interval of regression fit. Nonbleached WT and KO protrusion are shown as open circles and squares. Error bars are SEM. **p < 0.01; ****p < 0.0001. Scale bars, 5 μm.
- Figure 6.
ArpC3-deficient synapses are functionally immature. A, Effect of ArpC3 KO on AMPAR/NMDAR IEI ratios in CA1 pyramidal neurons (WT: 0.2 ± 0.2, n = 14; KO: 1.0 ± 0.2, n = 12; p = 0.034). B, Representative traces of pharmacologically isolated AMPAR- and NMDAR-mEPSCs (as indicated) recorded from ArpC3f/f (WT, blue) and ArpC3f/f:Cre+ (KO, red) neurons. C, D, IEI cumulative probability plots for AMPAR-mEPSCs (C) and NMDAR-mEPSCs (D). Insets show median values (see right vertical axes, units are in seconds). AMPAR-mEPSC IEIs were increased in ArpC3 KO versus WT neurons (WT: 0.38 ± 0.13 s, n = 6; KO: 1.87 ± 0.50 s, n = 6; t(10) = 3.54, p = 0.0050); NMDAR-mEPSC IEIs were not significantly different (WT: 1.99 ± 0.38 s, n = 9; KO: 2.02 ± 0.36 s, n = 7; t(14) = 0.043, p = 0.97). E, F, Amplitude cumulative probability plots for AMPAR-mEPSCs (E) and NMDAR-mEPSCs (F). Insets show median values (see right vertical axes, units are in picoamperes). Compared with WT neurons, KO neurons exhibited a left-shifted AMPAR-mEPSC amplitude distribution and reduced median current amplitudes (WT: 13.1 ± 1.3 pA, n = 6; KO: 24.0 ± 3.9 pA, n = 6; t(10) = 3.00, p = 0.013); the NMDAR-mEPSC amplitude distributions and median current amplitudes were comparable between groups (WT: 14.96 ± 0.89 pA, n = 9; KO: 16.43 ± 0.74 pA, n = 7; t(14) = 1.23, p = 0.24). G, Peak-scaled waveform averages of NMDAR-mEPSCs from WT (black, DIV3–5; blue, DIV14–21) and DIV14–21 ArpC3 KO (red) neurons. Scatter plots show that amplitude-weighted decay constants were decreased 69% from DIV 3–5 to DIV 14–21 in WT neurons (DIV 3–5: 85.5 ± 1.1 s, n = 5; DIV 14–21: 50.7 ± 6.5 s, n = 9; t(12) = 3.88, p = 0.0022) but were comparable between WT and KO neurons at DIV 14–21 (KO: 45.1 ± 7.3 s, n = 7; t(14) = 0.58, p = 0.57). H, Waveform averages from minimal stimulation experiments (black, WT and KO failures; blue, WT success; red, KO success) showing selective effects of ArpC3 KO on AMPAR-mEPSC failure rates (WT: 13.5 ± 2.2%, n = 4; KO: 44.0 ± 7.6%, n = 4; t(6) = 4.46, p = 0.0044) compared with NMDAR-mEPSC failures (WT: 39.2 ± 7.2%, n = 5; KO: 30.2 ± 5.5%, n = 5; t(8) = 0.99, p = 0.35). I, Representative traces of AMPAR-mEPSCs recorded from ArpC3f/f (WT, blue), ArpC3f/f:Cre+:FLEx-GFP (KO, red), and ArpC3f/f:Cre+:FLEx-ArpC3 (rescue, green) neurons. J–M, Cumulative probability plots and sample distributions illustrate ArpC3's KO and rescue effects on mEPSC amplitude (ANOVA main effect: F(2,20) = 14.40, p < 0.001) and IEI (ANOVA main effect: F(2,20) = 26.93, p < 0.001). Post hoc comparisons revealed significant differences between WT and KO amplitudes (WT: 9.50 ± 0.69 pA, n = 10; KO: 5.97 ± 0.85 pA, n = 5; p = 0.004) and IEIs (WT: 0.26 ± 0.054 s, n = 10; KO: 1.19 ± 0.11 s, n = 5; p = 0.003). Whereas rescued amplitudes and IEIs were not significantly different from those of WT neurons (rescue amplitude: 9.43 ± 0.45 pA, n = 5; p = 0.99; rescue IEI: 0.32 ± 0.08 s, n = 5; p = 0.92), both values were significantly different from those of KO neurons (KO amplitude, p = 0.02; KO IEI, p = 0.011). Error bars indicate SEM; *p < 0.05; **p < 0.01.
- Figure 7.
Schematic summarizing the roles of Arp2/3 during initial spinogenesis, morphological maturation, and AMPAR-dependent unsilencing. Initial loss of Arp2/3 activity promotes filopodia formation through mDia2-mediated linear actin nucleation. Arp2/3 is later required to mediate both the morphological enlargement of spines as well as AMPAR-dependent unsilencing of dendritic spines. Arp2/3-deficient spines, however, are able to form presynaptic contacts, undergo NMDAR subunit switching, and recruit PSD-95. Together, these data show that Arp2/3-dependent actin remodeling plays highly specialized roles in synapse formation.


