

Article Figures & Data
Figures
- Figure 1.
Voxelwise category models. A voxelwise modeling framework was used to measure category selectivity in single voxels from individual subjects. The WordNet lexicon was used to label salient object and action categories in each 1 s segment of the movies (Miller, 1995). This labeling procedure produced for each category a separate binary variable that indicates its presence/absence throughout the stimulus. The binary variables for 1705 distinct categories were taken as the stimulus features. Regularized linear regression was used to find a weighted sum of stimulus features that best describe the measured BOLD responses. The resulting model weights characterize the selectivity of single voxels to 1705 distinct object and action categories.
- Figure 2.
Selectivity for object and action categories. a, Three separate models were estimated for each voxel: a category model that describes selectivity for object and action categories; a gist model that describes selectivity for spatial structures of scenes; and a motion-energy model that describes selectivity for low-level visual features. Models were validated by predicting BOLD responses in a separate dataset reserved for this purpose. A variance partitioning analysis was used to estimate the proportion of response variance predicted uniquely by each model and jointly by multiple models (see diagram). b, The proportion of variance explained uniquely by category, gist, and motion-energy models in each ROI (mean ± SEM across subjects). In early retinotopic visual areas (RET), the category model does not explain variance beyond what can be attributed to selectivity for spatial structure or low-level visual features. In contrast, the category model explains a significant portion of variance in scene-selective ROIs (p < 10−4, bootstrap test). This result suggests that selectivity for nonscene categories in the PPA, RSC, and OPA cannot be fully explained by selectivity for spatial structure captured by the gist model or selectivity for low-level visual features captured by the motion-energy model. c, The proportion of variance explained commonly by category/gist (C∩G), category/motion-energy (C∩M), and gist/motion-energy (G∩M) models in each ROI (mean ± SEM across subjects). A relatively small portion of variance is explained jointly by category and motion-energy models (p < 10−4). Therefore, to reduce spurious correlations, a nuisance motion-energy regressor was included in the category models during subsequent analyses.
- Figure 3.
The optimal number of clusters for each scene-selective ROI. An unsupervised stability-based validation technique was used to determine the optimal number of clusters in three scene-selective ROIs. a, Cluster analysis for the PPA. Left, The cumulative distribution function of clustering stability, FJ(j), shown as a function of number of clusters (k) ranging from 2 to 7. Right, Change in value of FJ across consecutive k at a stability threshold of J = 0.9 (Ben-Hur et al., 2002). The optimal k was identified by detecting a sudden transition from narrow to widespread distributions. This transition was identified by a large increase in the value of FJ when gradually increasing the number of clusters. The optimum number of clusters in the PPA is two (data are aggregated across subjects and hemispheres). b, Cluster analysis for the RSC. Format same as in a. The optimum number of clusters in the RSC is two. c, Cluster analysis for the OPA. Format same as in a. The optimum number of clusters in the OPA is two.
- Figure 4.
Functional segregation of subdomains. If subdomains identified within an ROI are functionally distinct, then the variance of a voxel's response explained by other voxels in the same subdomain (within-subdomain prediction) should be greater than the variance explained by voxels in different subdomains (cross-subdomain prediction). We therefore compared within-prediction and cross-prediction performances based on responses predicted by the category, gist, and motion-energy models. Bar plots show the percentage difference in explained variance in the PPA, RSC, and OPA (mean ± SEM across subjects). Greater percentages indicate better within-prediction than cross-prediction performance. Insignificant differences are shown in blank outlines (p > 0.05). In all ROIs, the within-prediction performance of the category model is greater than the cross-prediction performance (p < 0.001, bootstrap test). This result suggests that there are functional subdomains with distinct category tuning in the PPA, RSC, and OPA.
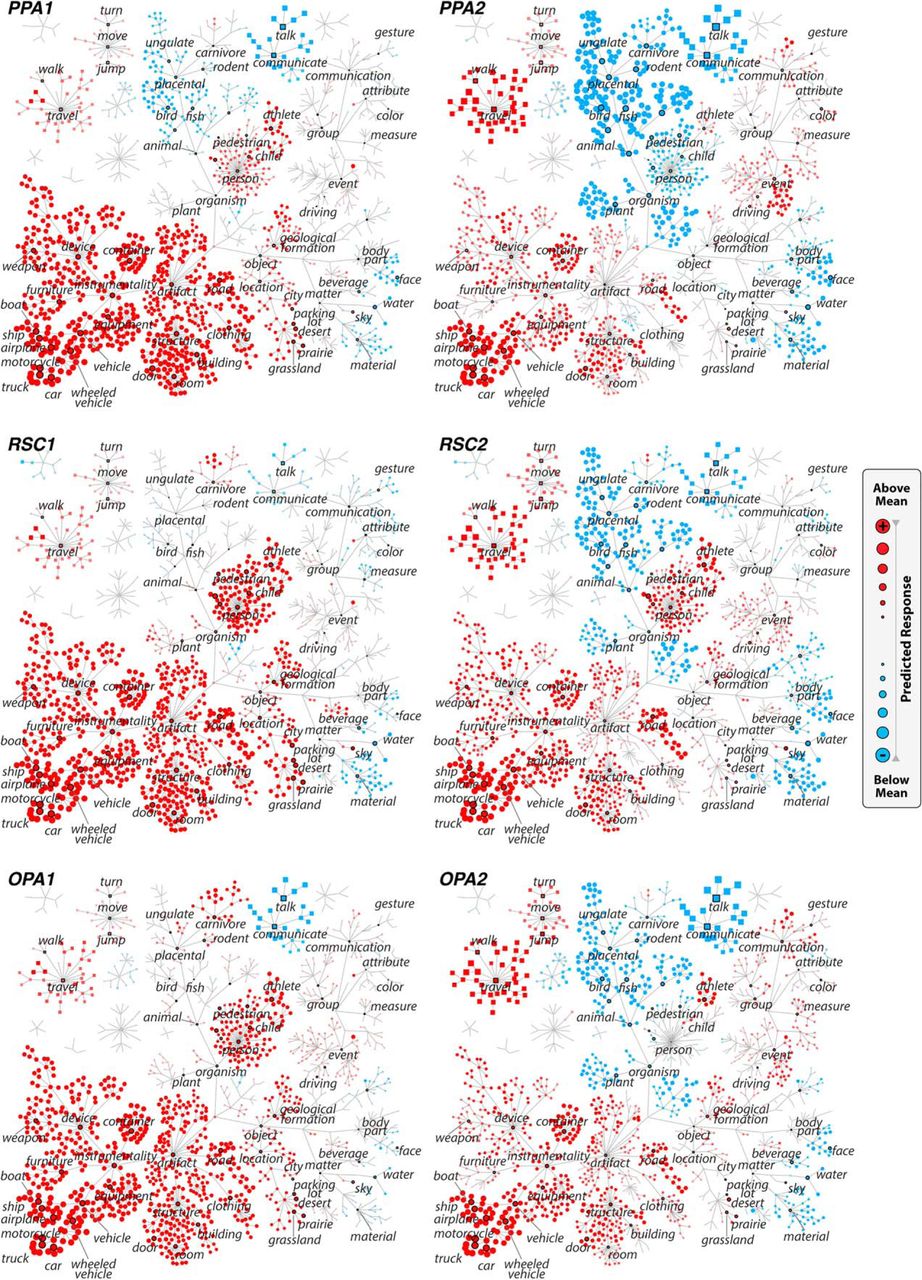
- Figure 5.
Category tuning of the voxel clusters. Category tuning of the two functional subdomains identified in each scene-selective ROI. For each cluster, category tuning was taken as the mean tuning profile of all voxels within the ROI (data are aggregated across subjects and hemispheres). Tuning for 1705 categories are shown here using graphs that consist of separate trees for object (main tree, circular vertices) and action (smaller trees, square vertices) categories. To orient the reader, a subset of the categories has been labeled. The size of each vertex indicates the magnitude while its color indicates the sign (red, +; blue, −) of the category response relative to the mean overall response. Left, Responses of PPA1, RSC1, and OPA1 are strongly increased by the presence of man-made instruments, devices, vehicles, structures, roads, and locations (e.g., city, grassland), and they are weakly increased by the presence of humans. Right, Responses of PPA2, RSC2, and OPA2 are strongly increased by the presence of vehicles, roads, and traveling, and they are strongly reduced by animals, plants, natural materials, body parts, and communication.
- Figure 6.
Predicted differences in category responses across clusters. The voxelwise category models fit to all voxels within each subdomain were used to estimate predicted responses to geographic locations, structures (e.g., building), instruments, vehicles, movement, natural materials, humans, social communication, body parts, and animals. The response level for each of these superordinate categories was taken as the average response across all of its subordinate categories included in the category model. Bar plots show the response level (mean ± SEM across subjects) for the two subdomains in each ROI as well as their difference (right column). Significant responses are shown in dark gray (p < 0.05, bootstrap test) and insignificant responses are shown in light gray. Relative to the second subdomain, the first subdomain is observed to respond less to traveling, and relatively more to most of the remaining categories including those related to humans, communication, and structures.
- Figure 7.
Cortical flatmaps of category selectivity within and outside scene-selective ROIs. To examine the spatial distribution of category selectivity, category tuning profiles were measured for voxels within and around the PPA, RSC, and OPA separately. The tuning profiles in the vicinity of each ROI were then projected onto the first group PC (calculated only from voxels within the given ROI). Here the projections obtained for the PPA, RSC, and OPA are shown on separate cortical flatmaps for two representative subjects S2 and S6. Brain areas identified using functional localizers are labeled and their extent is delineated with white lines. Voxels with positive projections onto the PC (i.e., category tuning more similar to PPA1, RSC1, and OPA1) appear in red, and voxels with negative projections (i.e., category tuning more similar to PPA2, RSC2 and OPA2 appear in blue. The two voxel clusters in each ROI show spatial segregation on the cortical surface.
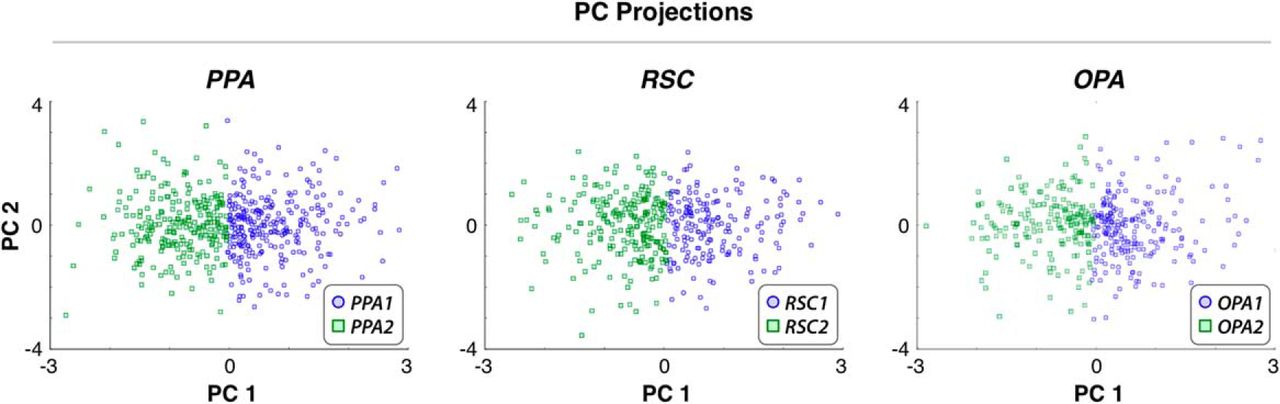
- Figure 8.
Projections of voxelwise tuning profiles onto PCs. To independently assess the functional heterogeneity in scene-selective ROIs, voxelwise tuning profiles were projected onto the first two group PCs obtained from voxels within each ROI (data aggregated across subjects and hemispheres). Each voxel in the first cluster (PPA1, RSC1, and OPA1) is denoted with a blue circle, and each voxel in the second cluster (PPA2, RSC2, and OPA2) is denoted with a green square. Voxels in separate clusters are spatially segregated in the PC space. Projections onto the first PC clearly separate voxels in the first and second clusters, implying that category representation in scene-selective ROIs is organized according to at least one semantic dimension.
- Figure 9.
Group PCs of tuning profiles in scene-selective ROIs. PC weights for the PPA, RSC, and OPA. Tuning diagrams are formatted as in Figure 5. Inspection of the tuning diagrams of the first PC reveals the semantic dimension that distinguishes the two subdomains in each scene-selective ROI. The first PC approximately contrasts categories related to human civilization and man-made artifacts (e.g., instruments, vehicles, roads, indoor spaces, and humans) with categories related to social interaction (e.g., communication) and outdoor activities (e.g., outdoor events, movement, and natural materials). Thus the first subdomain tuned for objects commonly appearing in static scenes has positive projections onto this PC, while the second subdomain tuned for object and actions in dynamic scenes has negative projections.
- Figure 10.
Temporal stimulus correlations between categories in natural movies. Regressors for multiple distinct categories of objects and actions may be correlated in the natural movie stimulus. To assess the effect of category correlations on our model fits, we compared the PCs of model weights with the PCs of the stimulus time course in terms of the amount of variance they can explain in voxelwise category models. Plots show the mean and 68th-percentile bands of the explained variance across the population of voxels in each ROI. Regardless of the number of PCs used, model PCs account for a significantly larger proportion of variance in the model weights compared with stimulus PCs (p < 10−4, bootstrap test). This result indicates that the estimated voxelwise category model weights are not biased by category correlations in the movie stimulus.
- Figure 11.
Motion-energy tuning of the voxel clusters. Differences in category tuning between the voxel clusters could potentially be confounded by differences in tuning for low-level structural features. To examine this issue, the mean motion-energy tuning of the clusters identified in Figure 5 were calculated for the PPA, RSC, and OPA separately. Spatial-frequency and velocity tuning profiles of the first (PPA1, RSC1, OPA1) and second (PPA2, RSC2, OPA2) voxel clusters are denoted with blue and green lines, respectively. Error bars indicate SEM across voxels in each cluster. There are no significant differences in spatial frequency or velocity tuning of the two clusters in any of the three ROIs (p > 0.05, bootstrap test). This result suggests that differences in category tuning between the two subdomains identified in the PPA, RSC, and OPA cannot be attributed to heterogeneity of motion-energy tuning.
- Figure 12.
Individual-subject cluster centers in the PPA. Cluster analysis was performed separately in individual subjects (data are aggregated across hemispheres). The left and right panels for each subject show the centers of the two clusters in PPA1 and PPA2. The center of each cluster was taken as the mean tuning profile across voxels in that cluster. Tuning diagrams formatted as in Figure 5. The cluster centers are highly consistent across individual subjects.
- Figure 13.
Individual-subject cluster centers in the RSC. Cluster analysis was performed separately in individual subjects (data are aggregated across hemispheres). The left and right panels for each subject show the centers of the two clusters in RSC1 and RSC2. The center of each cluster was taken as the mean tuning profile across voxels in that cluster. Tuning diagrams formatted as in Figure 5. The cluster centers are highly consistent across individual subjects.
- Figure 14.
Individual-subject cluster centers in the OPA. Cluster analysis was performed separately in individual subjects (data are aggregated across hemispheres). The left and right panels for each subject show the centers of the two clusters in OPA1 and OPA2. The center of each cluster was taken as the mean tuning profile across voxels in that cluster. Tuning diagrams formatted as in Figure 5. The cluster centers are highly consistent across individual subjects.


Tables
PPA1 PPA2 RSC1 RSC2 OPA1 OPA2 Total 277 243 185 228 223 184 S1 11 88 16 54 4 49 S2 36 11 13 19 7 6 S3 39 34 52 66 62 46 S4 59 28 13 22 68 30 S5 91 73 19 49 38 42 S6 41 9 72 18 44 11 The first row shows the total number of voxels within each cluster, pooled across subjects. Subsequent rows show the number of voxels within each cluster in individual subjects (S1–S6).


