

Article Figures & Data
Figures
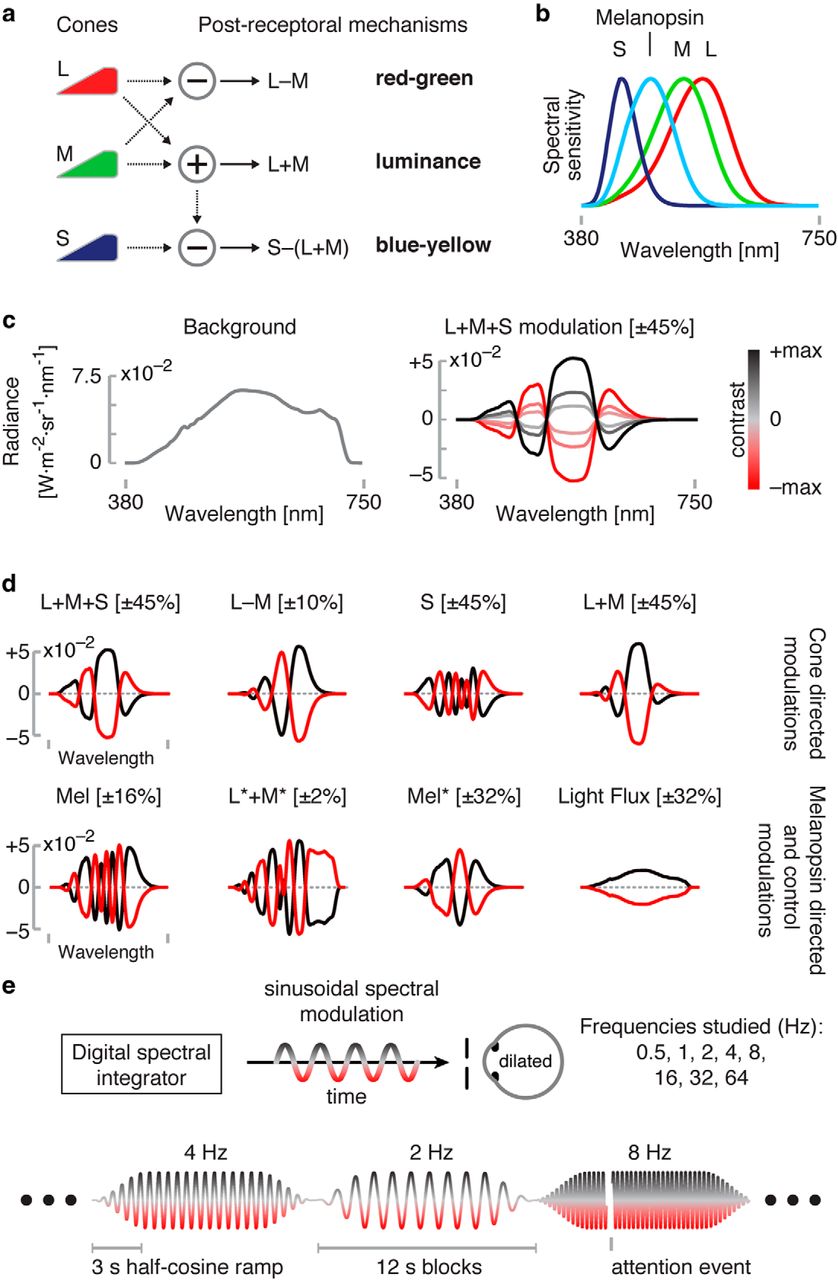
- Figure 1.
Overview and experimental design. a, Postreceptoral mechanisms arising from additive and opponent combination of cone signals. b, Spectral sensitivities of the L, M, and S cones and melanopsin. c, Left, Our stimuli all used a common, neutral background with the spectral power distribution shown. Right, Modulation spectra were added to the background. The L + M + S modulation is illustrated. Modulation spectra varied sinusoidally between an extreme positive (black line) and negative (red line) modulation. d, The maximal positive and negative modulations for each set of targeted photoreceptor(s) studied. Maximal contrast values are given in square brackets. Wavelength axis is as in c. e, Schematic of experimental apparatus and design. The subject viewed sinusoidal spectral modulations produced by the digital spectral integrator through an artificial pupil with a pharmacologically dilated eye. During fMRI scanning, different stimulus frequencies targeting a given class of photoreceptor(s) were presented in 12 s blocks. The sinusoidal flicker was ramped at the start and end of each block by a 3 s half-cosine. The stimulus was occasionally interrupted by an attention event.
- Figure 2.
Temporal transfer functions for the postreceptoral cone pathways. a, Temporal transfer functions for L + M + S, L − M, and S. The shaded region indicates ±1 SEM across the three subjects. The solid line is a fourth-order polynomial fit to the data. Views for ROIs at left are medial for V1 and V2/V3, lateral for MT, and ventral for LOC. Insets provide the response profile for each subject. b, Temporal transfer functions for L + M. The dashed red line is the difference of the L + M + S and S temporal transfer functions scaled to best (least-squares) match the L + M modulation.
- Figure 3.
Psychophysical nulling. a, Perceptual nulling data for a positive (black points) and negative (red points) 32% melanopsin (Mel*; nonpenumbral-cone silent) modulation in a population of subjects (n = 15). Primary subjects (S01, S02, and S03) are indicated with a star symbol. Some plot points are overlapping. Ellipse indicates ±1 SD across subjects. b, Perceptual nulling data for a 32% cone-directed (L + M + S) modulation in the same population of 15 subjects. Error bars indicate ±1 SD across subjects.
- Figure 4.
Temporal transfer functions for melanopsin-directed (a) and cone control flicker (b). Same format as Figure 2. Dotted red horizontal lines indicate the peak response (+1 SEM) for the scaled (2% contrast) L + M modulation for each area.
- Figure 5.
V1 response to melanopsin and control modulations. BOLD amplitudes shown as average across the two V1 hemispheres and across V1 vertices in the relevant eccentricity range (inset) for a set of 4 Hz modulations.
- Figure 6.
Pupil response to 0.1 Hz modulations. a, Polar plot of pupil responses (0.1 Hz modulation frequency) in 15 subjects. Radial eccentricity indicates pupil amplitude; angle in the polar plots indicates phase of the pupil response. Primary subjects (S01, S02, and S03) are indicated with a star symbol. b, Amplitude of pupil responses, including a light flux modulation, for the three primary subjects.
- Figure 7.
Temporal transfer functions for penumbral cone (L* + M*)-directed flicker. Same format as Fig. 2.


Tables
L + M + S (±45%) L − M (±10%) S (±45%) L + M (±45%) L + M (±2%) Mel (±17) L* + M* (±2%) Mel* (±32%) Light flux (32%) L 45% 10% 0% 45% 2% 0% 0% 0% 32% M 45% −10% 0% 45% 2% 0% 0% 0% 32% S 45% 0% 45% 0% 0% 0% 0% 0% 32% Mel 0% 0% 0% 0% 0% 17% 0% 32% 32% Rods 17% −10% 0% 17% 1% 10% 3% 20% 32% L* 42% 14% 0% 42% 2% 0% 2% 2% 32% M* 43% −7% 0% 42% 2% 0% 1% 2% 32% S* 38% 0% 36% 0% 0% 0% 0% 7% 32% Values are given as contrasts of the modulations targeted to a 32-year-old subject (spectral power distributions are shown in Figure 1). Bolded numbers indicate contrast that was targeted for the respective modulation direction; italic numbers indicate contrast that was not specifically controlled. Modulation names designated with an asterisk produce differential spatial contrast on penumbral cones and thus a Purkinje tree percept if flickered rapidly.


