

Article Figures & Data
Figures
- Figure 1.
Spike timing-dependent induction of long-term synaptic plasticity in cerebellar granule cells. A, Left, EPSC traces (average of 100 individual sweeps) represent the changes observed following induction in different experiments. An EPSP evoked by extracellular stimulation (pre-) was paired with a spike elicited by current injection into the postsynaptic cell (post-). The spike followed or preceded the onset of the EPSP by Δt = ±5, ±25, ±50, and ±100 ms. Pairings was repeated 60 times at at 6 Hz. Right, Plot represents the time course of EPSC amplitude changes for different Δt. For each series, data are expressed as percentage changes in EPSC peak amplitude compared with control (con) before induction (ind). Dashed line indicates the induction time. Each point indicates the average of 50 contiguous EPSC amplitudes. Top, Sample traces have been taken during STDP induction protocol. Data in the plot are mean ± SEM. B, Summary of the change in the EPSC amplitude for different Δt. The STDP timing curve shows EPSC amplitude changes in individual recordings 20 min after induction (each point is the average of 100 EPSC amplitude measurements). C, Average EPSC amplitude changes in the same experiments as shown in B. Data are mean ± SEM. Note the striking transition from maximal LTP to maximal LTD over the narrow time window ∼0 ms.
- Figure 2.
STDP requirement for a phased-locked EPSP-AP pairing. A, Left, Sample traces of EPSCs in control (con) and 20 min after STDP induction (ind) in a single cell (average of 100 sweeps) after random EPSP-AP pairing. Right, The time course shows average changes in EPSC amplitude after induction with random pairing. Gray lines replotted from Figure 1A indicate STDP at 6 Hz with phased-locked pairing for comparison. Dashed line indicates the induction time. Each point indicates the average of 50 contiguous EPSC amplitude. Top, Sample traces have been taken during randomly STDP induction protocol. Data in the plot are mean ± SEM. B1, Plot represents nonsignificant correlation between EPSP amplitude during induction and EPSC changes at different Δt (linear regression; R2 = 0.03, n = 40; p(F) = 0.85). B2, Average EPSC amplitude changes in the same experiments as shown in B1. Data are mean ± SEM.
- Figure 3.
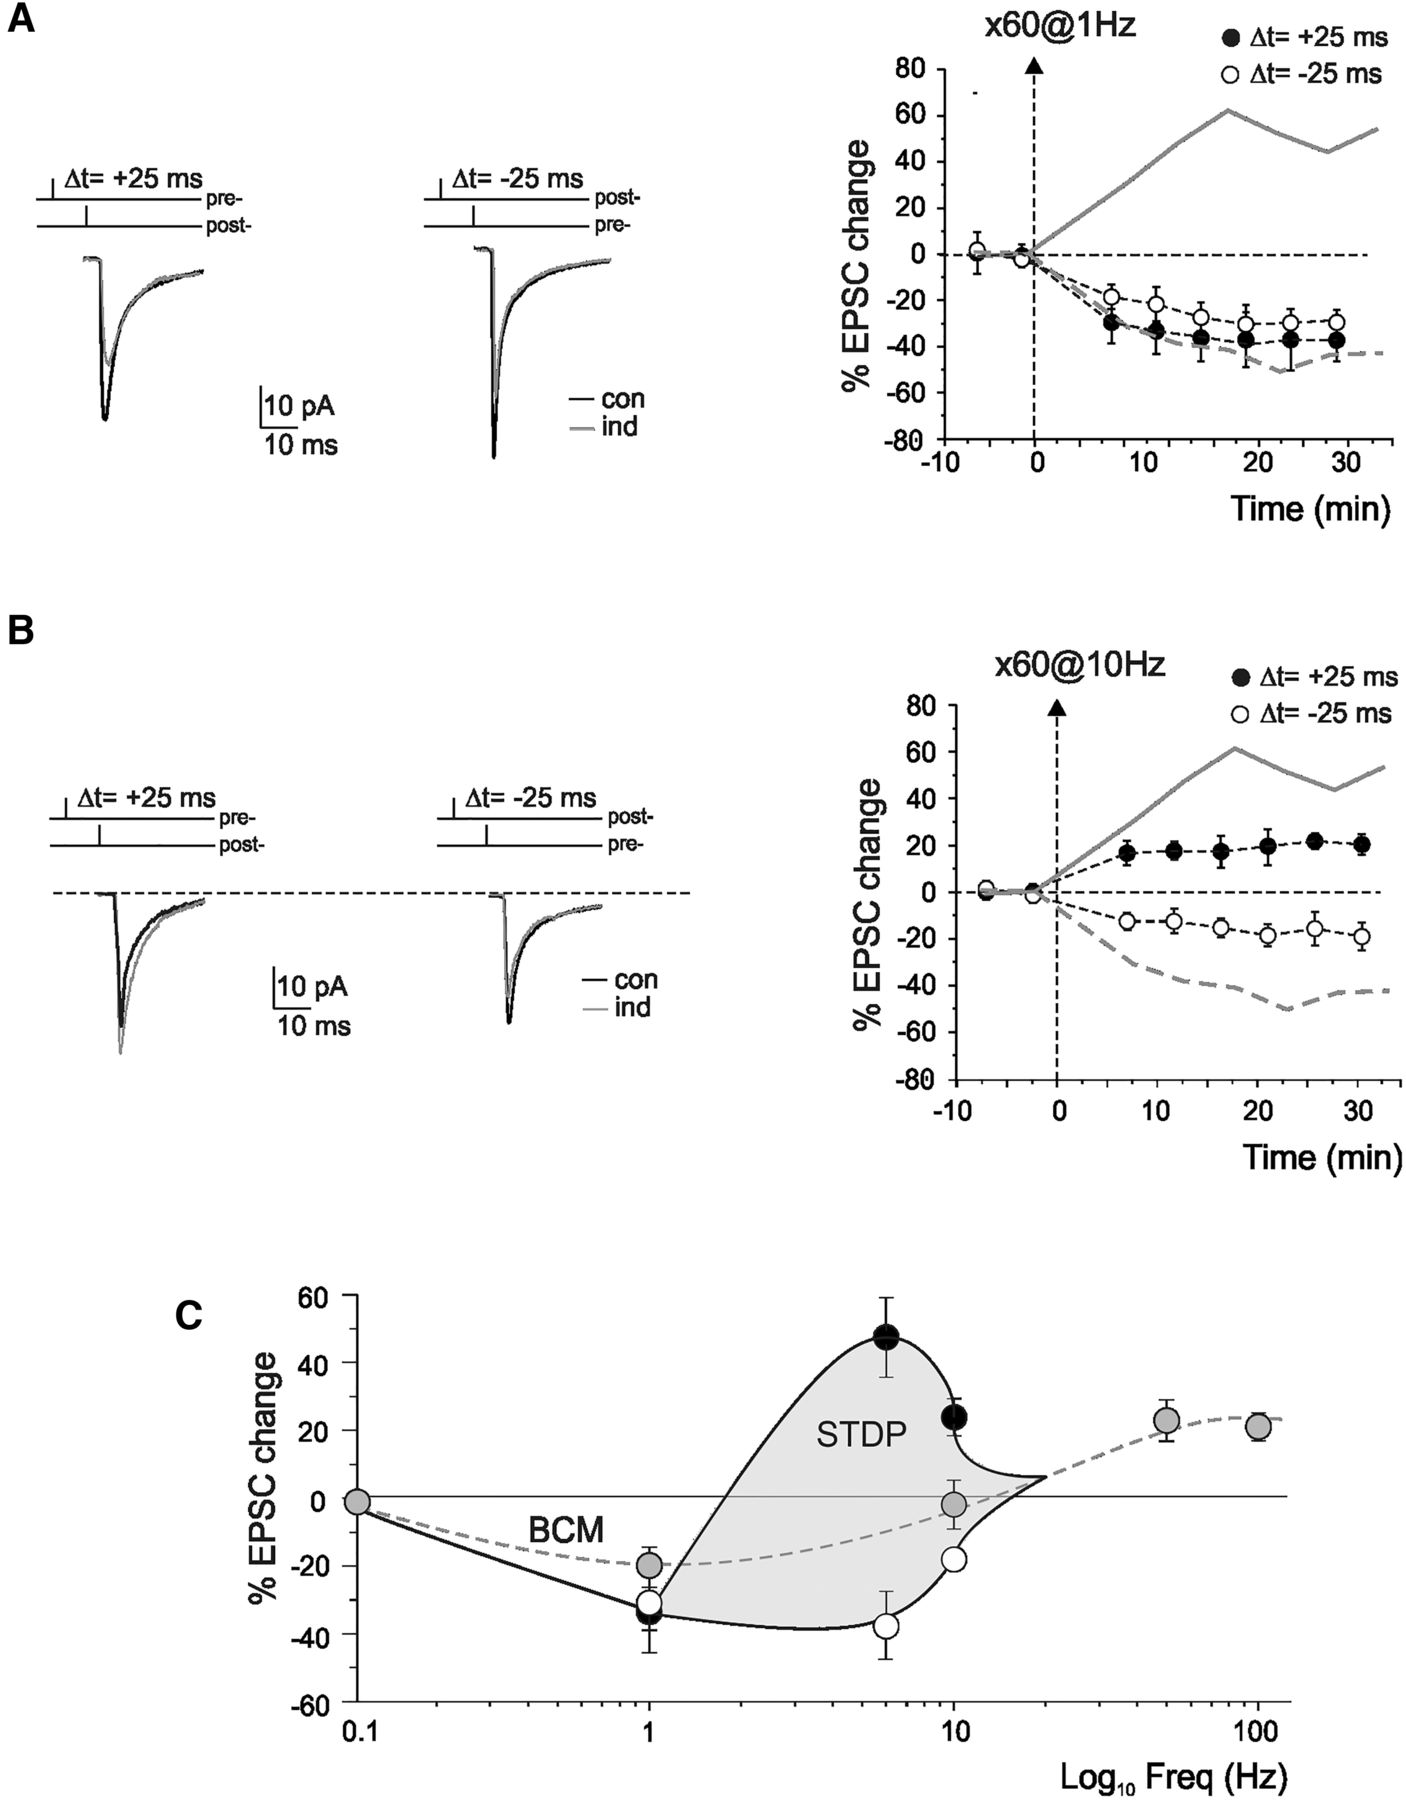
STDP dependence on the input frequency. A, Left, Sample traces of EPSCs in control (con) and 20 min after STDP induction (ind) in a single cell (average of 100 sweeps) after EPSP-AP pairing at 1 Hz. Right, The time course shows average changes in EPSC amplitude after STDP induction. Gray lines replotted from Figure 1A indicate STDP at 6 Hz with phased-locked pairing for comparison. Dashed line indicates the induction time. Each point indicates the average of 50 contiguous EPSC amplitude. Data in the plot are mean ± SEM. B, Left, Sample traces of EPSCs in control (con) and 20 min after STDP induction (ind) in a single cell (average of 100 sweeps) after EPSP-AP pairing at 10 Hz. Right, The time course shows average changes in EPSC amplitude after STDP induction. Gray lines replotted from Figure 1A indicate STDP at 6 Hz with phased-locked pairing for comparison. Dashed line indicates the induction time. Each point indicates the average of 50 contiguous EPSC amplitude. Data in the plot are mean ± SEM. C, The STDP changes obtained following AP-EPSP pairing at 1, 6, and 10 Hz are compared with those obtained from D'Errico et al. (2009). White circles represent st-LTD at Δt = −25 ms. Black circles represent st-LTP at Δt = 25 ms. Gray circle represents Δt = 0 ms. Data in the plot are mean ± SEM.
- Figure 4.
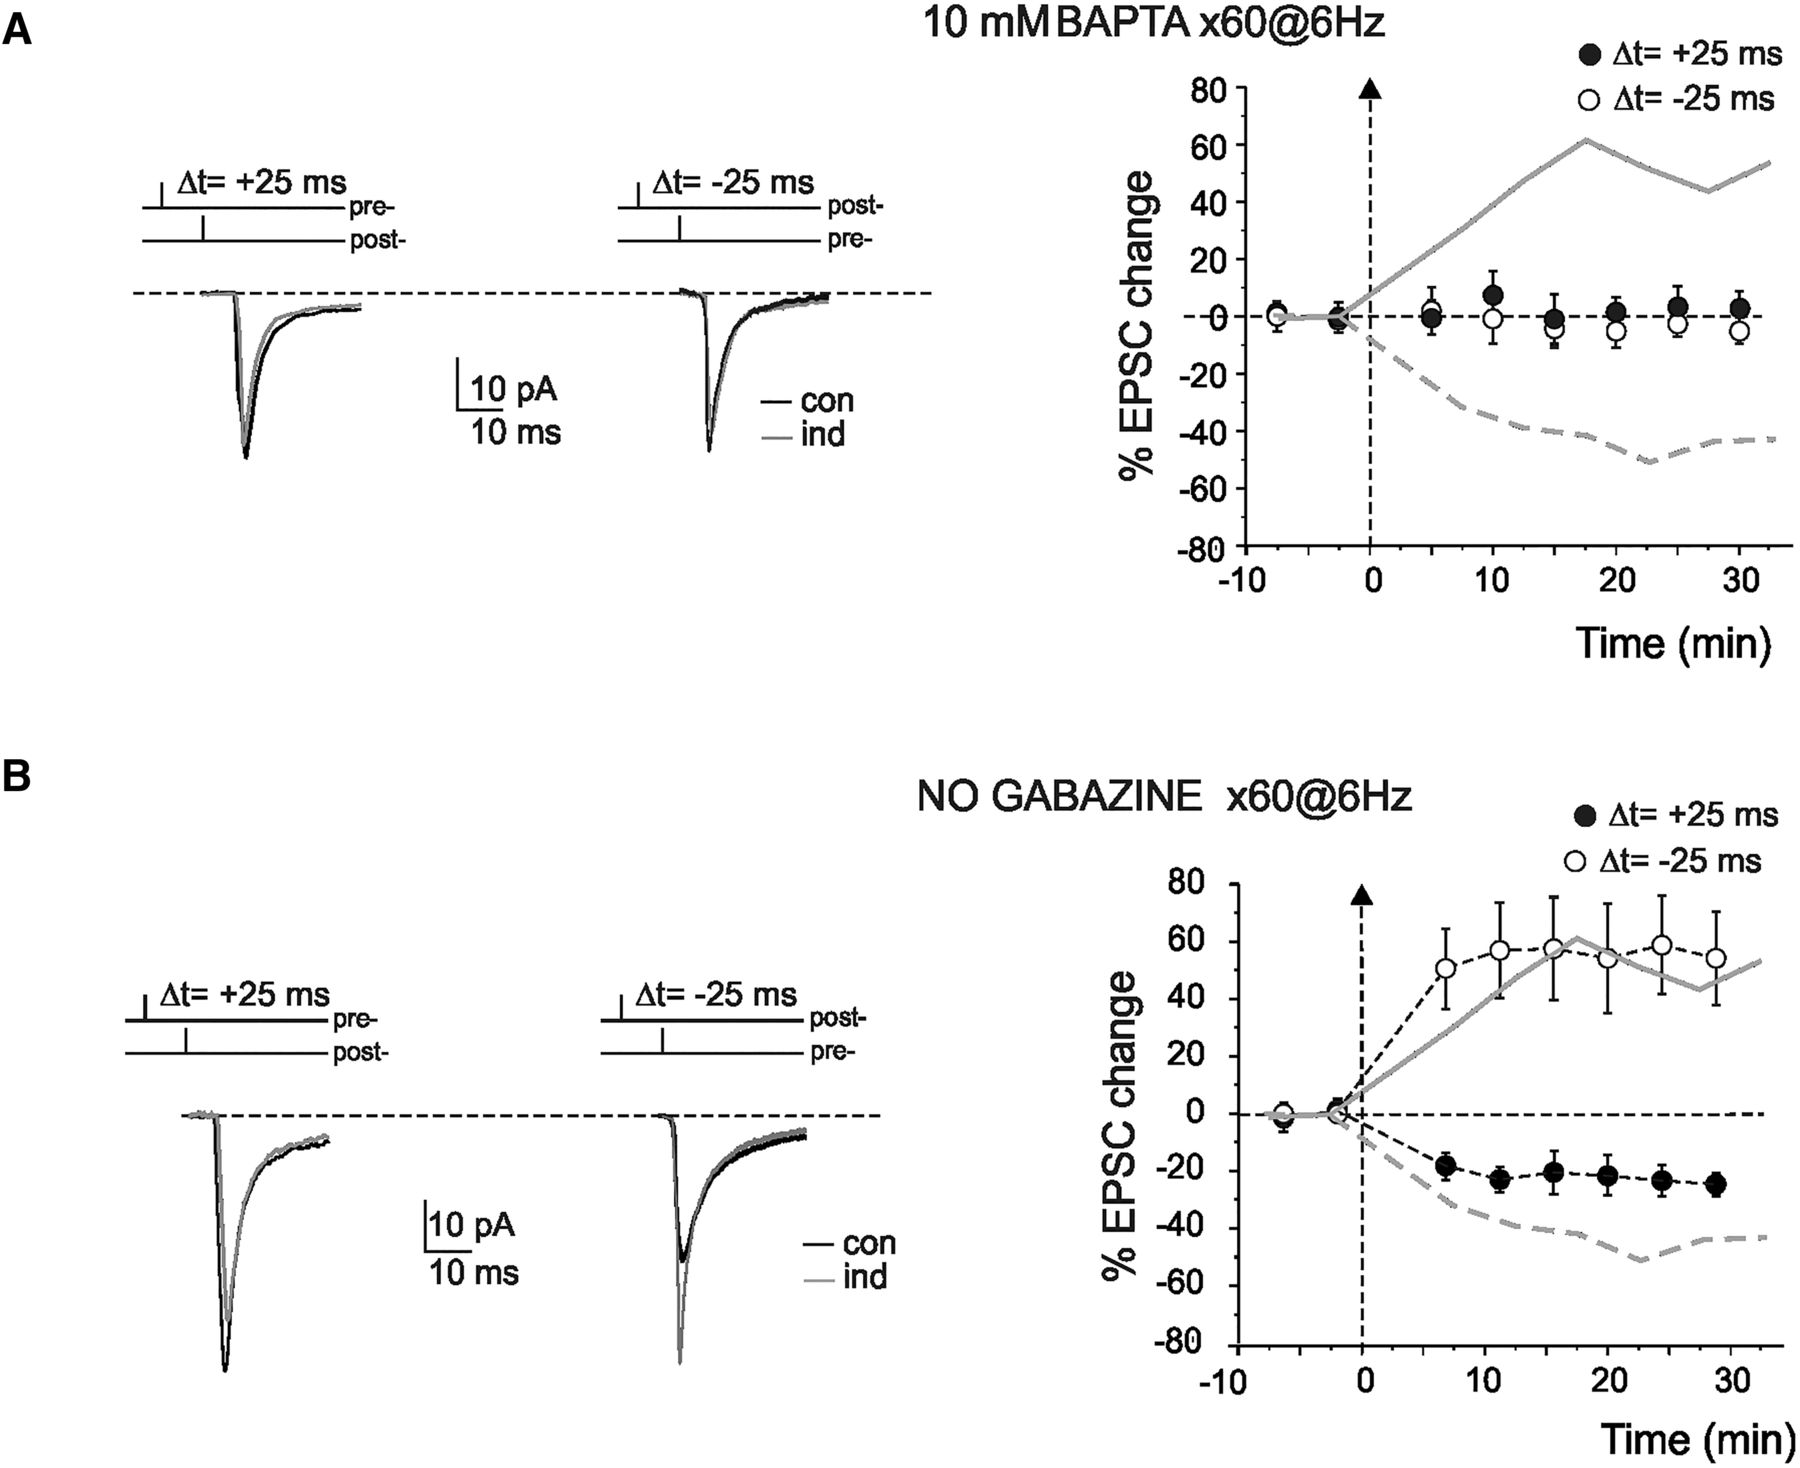
STDP dependence on postsynaptic Ca2+ changes and GABA-A receptors. A, Buffering of postsynaptic Ca2+ with 10 mm BAPTA blocked the induction of LTP. Left, Sample traces of EPSC in control (con) and 20 min after STDP induction (ind) in a single cell (average of 100 sweeps) with 10 mm BAPTA in the intracellular solution. Right, The time course shows average changes in EPSC amplitude after STDP induction using either 0.1 (gray lines) or 10 mm BAPTA-containing intracellular solution. Dashed line indicates the induction time. Each point indicates the average of 50 contiguous EPSC measurements. Data are mean ± SEM. B, Postsynaptic GABAA receptor-mediated inhibition inverted STDP phase dependence. Left, Sample traces of EPSCs in control (con) and 20 min after STDP induction (ind) in a single cell (average of 100 sweeps) without gabazine. Right, The time course shows average changes in EPSC amplitude after STDP induction using either 10 μm (gray lines; replotted from Fig. 1A) or no gabazine-containing extracellular solution. Dashed line indicates the induction time. Each point indicates the average of 50 contiguous EPSC measurements. Data are mean ± SEM.
- Figure 5.
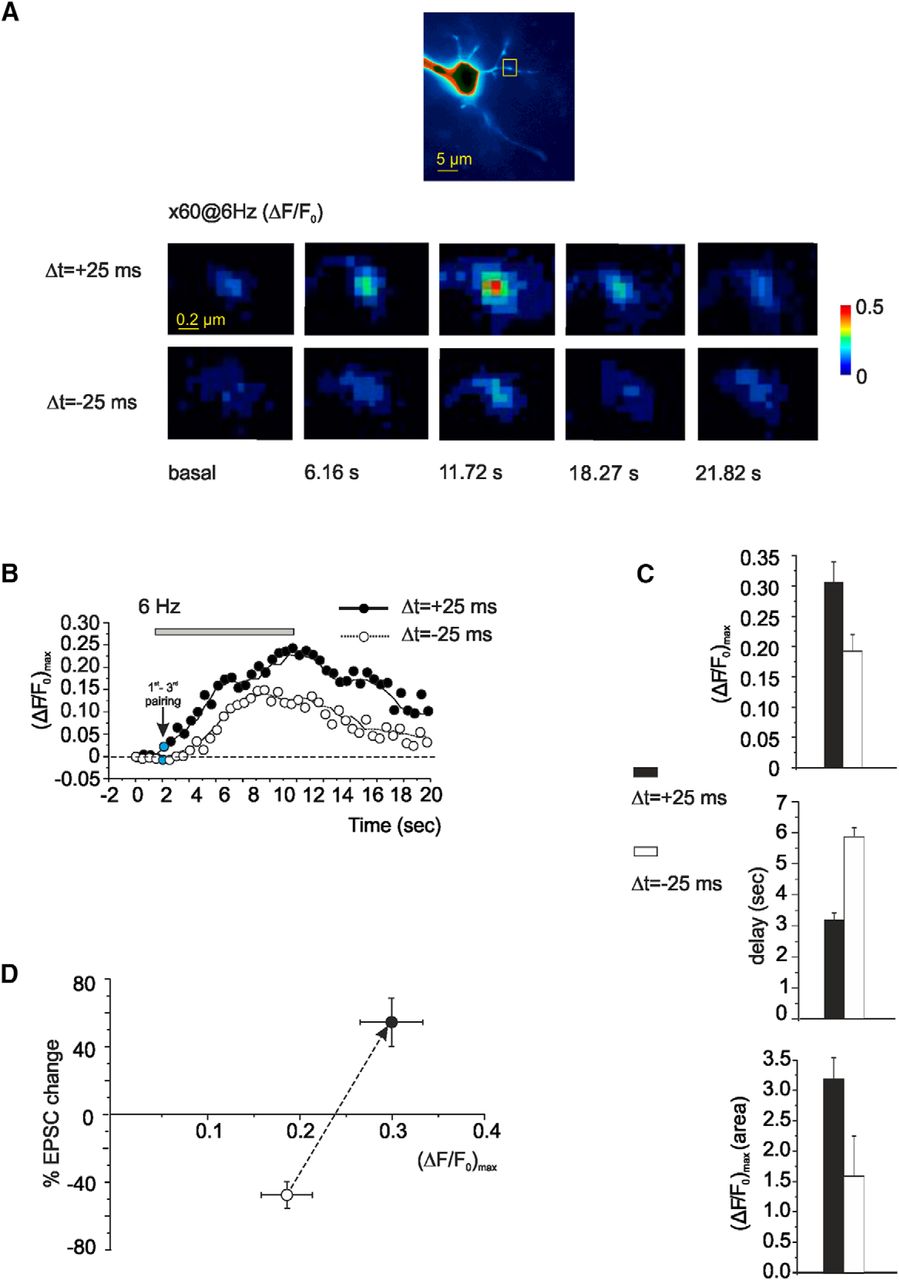
Intradendritic Ca2+ transients evoked during STDP induction protocols. Analysis of Ca2+ transients elicited by the STDP induction protocol at 6 Hz in granule cells filled with 200 μm OG1. A, Top, Fluorescence image of a GrC filled with 200 μm OG1. Scale bar, 5 μm. Fluorescence intensity is color coded with arbitrary units within an interval chosen to allow the visualization of the synaptic terminals. Bottom, The series of pseudo-ratio images illustrate fluorescence changes ΔF/F0 during evoked EPSP paired with spike at Δt = ±25 ms. Yellow square represents the ROI used for measurements. Scale bar, 0.2 μm. B, Traces represent the background-subtracted kinetics of fluorescence changes (ΔF/F0)max, for different STDP induction protocols (Δt = ±25 ms). The stimulation starts 2 s after the beginning of the recording. Gray bar represents the duration of STDP protocols. Each point indicates the Ca2+ transient in response to three consecutive EPSP-AP (or AP-EPSP) pairings. It should be noted that, at the beginning of the pairing period (blue point, i.e., after 3 pairings), the Ca2+ transient was still small and attained plateau near the end of the pairing period (20th point, i.e., after 60 pairings). C, Histograms compare the (ΔF/F0)max amplitude and area, and delay of Ca2+ transients induced by evoked EPSP paired with spike at Δt = ±25 ms. D, The relationship between intracellular Ca2+ changes, [Ca2+]i, and STDP obtained during evoked EPSP paired with the spike at Δt = ±25 ms.
- Figure 6.
Ca2+ sources for STDP. Effect of blocking NMDA and mGlu receptors and calcium release from internal stores. Application of 50 μm d-APV and 50 μm 7-Cl-Kyn acid prevented both LTP and LTD induction (Δt = ±25 ms). Application of 15 μm AIDA had no effect on LTD induction (Δt = −25 ms) but blocked LTP induction (Δt = 25 ms). Coapplication of 1 mg/ml heparin and 10 μm ruthenium red in the postsynaptic pipette determined the same effect on STDP induction shown with AIDA perfusion. Dashed line indicates the induction time. A, Left, EPSC traces (average of 100 individual sweeps) represent the changes observed following LTP induction in the presence of d-APV, AIDA, and heparin + ruthenium red. Right, Average time course of EPSC amplitude changes in the presence of d-APV, AIDA, and heparin + ruthenium red. Continuous line indicates st-LTP induction in control conditions. B, Left, EPSC traces (average of 100 individual sweeps) represent the changes observed following LTD induction in the presence of d-APV, AIDA, and heparin + ruthenium red. Right, Average time course of EPSC amplitude changes in the presence of d-APV, AIDA, and heparin + ruthenium red. Gray dashed line indicates st-LTD induction in control conditions. C, Average magnitude of st-LTP and st-LTD 20 min after STDP induction in the presence of d-APV, AIDA, and heparin + ruthenium red. Data are mean ± SEM.
- Figure 7.
Changes in CV and PPR during STDP expression. A, Average time course of CV and PPR after STDP induction. Dashed line indicates the induction time. Each point is the average of 50 contiguous EPSC measurements. Data are mean ± SEM. B, Histogram compares CV and PPR changes following STDP induction (Δt = ±25 ms).
- Figure 8.
mEPSC recordings during STDP. Consecutive tracings showing spontaneous activity before and after STDP induction (Δt = ±25 ms). Following st-LTP induction, both mEPSC amplitude and frequency increased; whereas following st-LTD induction, both mEPSC amplitude and frequency decreased. A, Representative examples of mEPSC before and after STDP induction (Δt = ±25 ms). B, mEPSC amplitude distributions before (gray) and during STDP (blue or yellow). mEPSC amplitude histograms were constructed with 2 pA per bin. Note the shift of the histogram mode with a change in maximum mEPSC amplitude. C, Cumulative frequency distributions before (dashed line) and after STDP induction (continuous line; Δt = ±25 ms). D, The histogram compares mEPSC amplitude and frequency following STDP induction (ΔT = ±25 ms).
- Figure 9.
The relationship between CV and mean EPSC amplitude during STDP expression. Plots represent obtained points at different Δt (same as in Fig. 1). Single data points (left) and average data grouped per category (right). A, Plots represent the relationship between CV and EPSC changes at different Δt. During st-LTP (Δt = 25 ms), EPSC CV decreased and EPSC amplitude increased, whereas the opposite occurred during st-LTD (Δt = −25 ms). Linear regression over the points was statistically significant (slope = −0.54 ± 0.11, intercept = 11.6 ± 5.2; R2 = −0.63.; n = 45; p < 0.0001). B, (CVB/CVA)−2 < = > (MB/MA) shows that most points fall close to the unitary diagonal. Data in average plots are mean ± SEM.


