

Article Figures & Data
Figures
- Figure 1.
Alignment of VGLUT protein sequences and the VGLUT3A224V/A224V mouse genomic construct. A, Alignment of mouse (mVGLUT3) and human (hVGLUT3) VGLUT3 and mouse (mVGLUT1) VGLUT1 amino acid sequences. The three peptide sequences are highly conserved (black letters indicate residues conserved in the sequences, and blue letters indicate residues that are different). The KWAPPLER motif (red boxed text) is conserved in all three sequences. The mutated alanine residue is in red. This alanine is at positions 224, 211, and 198 in the mVGLUT3, hVGLUT3, and mVGLUT1 amino acid sequences, respectively. B, Schematic representation of the targeting strategy. A targeting vector was constructed in which the GCG codon (encoding alanine 224) is replaced by a GTG codon in exon 5. A neomycin resistance selection cassette (flanked by two sites, Lox and LoxP_Neo_LoxP) was integrated downstream of exon 5. An auto-excision of the selection cassette in a male chimera germ line provided a targeting allele with a valine at position 224 in exon 5 and a LoxP site used for genotyping. C, Genotyping strategy of mouse VGLUT3 by PCR. Mice were genotyped with two primers (arrowheads P1 and P2 in B) flanking each side of the LoxP site. PCR amplification of the WT allele (+) yielded a 219 bp band, and the mutated allele (A224V) yielded a 306 bp band in an agarose gel. Asterisks represent the targeted site in exon 5.
- Figure 2.
Expression of VGLUT3-p.A211V in cell cultures. A, Gel image of RT-PCR products (negative image) showing no significant difference between WT and VGLUT3-p.A211V transcript from BON cells stably expressing each allele. B, C, Western blot (WB) quantification of VGLUT3 and VGLUT3-p.A211V in BON cell extracts (B) and in primary cultures of hippocampal neurons transfected with a VGLUT3 or VGLUT3-p.A211V expression plasmid (C). VGLUT3-p.A211V expression was reduced by 64% in BON cells (B) and by 66% in neurons (C). D, E, Quantification of fluorescence intensity of WT and VGLUT3-p.A211V in stable BON cells (D) or in synaptic boutons in hippocampal neurons in culture (E). F, Western blot detection and quantification of WT and VGLUT1-p.A198V in BON cell extracts. G, H, Immunofluorescence microphotographs of VGLUT3 (green) in BON cells stably transfected with a VGLUT3 (G) or VGLUT3-p.A211V (H) expression plasmid. I, J, Hippocampal neurons transiently transfected with a VGLUT3 (I) or VGLUT3-p.A211V (J) expression plasmid. Nuclei were labeled with DAPI (blue). K, L, Immunofluorescence of the WT isoform of VGLUT1 (K, red) or VGLUT1-p.A198V (L, red) in BON cell cultures that were transiently transfected with expression plasmid. M–R, Colocalizations of VGLUT3 WT (M, O, Q, green) or VGLUT3-p.A211V (N, P, R, green) with MAP2 (M, N, red), bassoon (O, P, red), and PSD-95 (Q, R, red) in primary hippocampal neuronal cultures transfected with a VGLUT3 or VGLUT3-p.A211V plasmid. Areas surrounded by a dashed line are enlarged in the insets. Scale bars: R, 5 μm; G–L, 10 μm; M–R, insets, 1 μm. * p < 0.05; ** p < 0.01.
- Figure 3.
Effect of the p.A211V mutation on 3D structure, glutamate vesicular accumulation, and release. A–H, Three- and two-dimensional model of human VGLUT3 (A–D) and VGLUT3-p.A211V (E–H) using crystallographic MFS transporter structures as a template. Packing of the helices viewed from the side (A, C, E, G) or the top (B, F) is shown. The alanine residue (in position 211) of VGLUT3 (A, B) and the valine residue of VGLUT3-p.A211V (E, F) that are exposed to the pore are shown in pink. Regions boxed in A and E are enlarged in C and G, respectively. D, H, Close-up view and two-dimensional interactions diagram of alanine 211 (D) or valine 211 (H). I, Effect of the p.A211V mutation on H+ ionophore carbonyl cyanide m-chlorophenylhydrazone (CCCP)-sensitive [3H]l-glutamate uptake by synaptic vesicles from BON cells stably expressing VGLUT3 (black bars) or VGLUT3-p.A211V (red bars). The small difference observed between the two populations of vesicles is not significant (NS). J–S, Electrophysiological recordings of VGLUT1−/− hippocampal autaptic neurons infected with lentivirus expressing VGLUT3 (WT) or VGLUT3-p.A211V isoforms. The number of recorded cells is indicated in bar graphs. Data are pooled from two independent cultures in M and from four independent cultures in J–L and N–S. J, Top, Representative traces of current responses after two unclamped action potentials with an interstimulus interval of 25 ms in VGLUT1−/− autaptic neurons (green bars and traces) expressing VGLUT3 (black bars and traces) or VGLUT3-p.A211V (red bars and traces). Artifacts and action potentials are blanked. Bottom, Plot of average EPSC amplitude size (first pulse) normalized to WT. K, Left, Representative traces of current responses after application of sucrose (500 mm) for 5 s. Right, Plot of the average readily releasable pool (RRP) charge normalized to WT. L, Comparison of the expression levels of WT and VGLUT3-p.A211V, determined by measuring immunofluorescence intensities and normalizing to the intensities of synaptic marker synaptophysin I (Syp1). M, Plot of average paired-pulse ratios with an interstimulus interval of 25 ms. Data are pooled from two independent cultures. N, Plot of average vesicular release probability. Data are pooled from four independent cultures. O, Example of mEPSC traces in autaptic neurons. P–S, Scattered points and bar graphs of average amplitude (P), fraction of events (Q), frequency (R), and EPSC charge (S). Data are pooled from four independent cultures.
- Figure 4.
Regional expression of VGLUT3, VGLUT3A224V/+, VGLUT3A224V/A224V, and VGLUT3A224V/− in the CNS of mice at different ages. A–J, Detection and quantification of VGLUT3, VGLUT3A224V/+, VGLUT3A224V/A224V, and VGLUT3A224V/− mRNA and protein (Prot) expression by in situ hybridization or immunoautoradiography on coronal mouse brain sections taken at P10 (A, B) and at 3 months (C–F), 6 months (G, H), or 12 months (I, J) in the striatum (Str), hippocampus (Hi), dorsal raphe (DR), and median raphe (MR). WT, VGLUT3A224V/+, and VGLUT3A224V/A224V mice expressed a similar level of transcripts (B, D, H, J, left; Mann–Whitney U test for B, J; Kruskal–Wallis test for D, H; p > 0.05, n = 8). B, D, H, right, F, Loss of the protein in all areas from P10 until 1 year in VGLUT3A224V/A224V mice (n = 8 for each genotype, Mann–Whitney U test or Kruskal–Wallis test, *p < 0.05, **p < 0.01, ***p < 0.001). In VGLUT3A224V/+ mice, there is a 34% decrease in VGLUT3 in all areas at 3 and 6 months (D, H). E, F, In this experiment, the protein expression of VGLUT3 was compared in WT, VGLUT3A224V/A224V, and VGLUT3A224V/− mice (n = 8) in the striatum, hippocampus, and dorsal raphe. VGLUT3 expression decreased by 70% in VGLUT3A224V/A224V mice and further decreased by 84% in VGLUT3A224V/− mice in the striatum (Kruskal–Wallis test; in the striatum, WT vs VGLUT3A224V/+, p = 0.0043; WT vs VGLUT3A224V/A224V, p = 0.0043; WT vs VGLUT3A224V/−, p = 0.0012; in the hippocampus, WT vs VGLUT3A224V/+, p = 0.01; WT vs VGLUT3A224V/A224V, p = 0.0043; WT vs VGLUT3A224V/−, p = 0.0012; in raphe nuclei, WT vs VGLUT3A224V/+, p = 0.0571; WT vs VGLUT3A224V/A224V, p = 0.0159; WT vs VGLUT3A224V/−, p = 0.0286). K, L, Western blot detection (K) and quantification (L) of VGLUT3 in the cortex, striatum, and hippocampus of VGLUT3A224V/+ and VGLUT3A224V/A224V mice at 3 months (n = 5; Kruskal–Wallis test, **p < 0.01).
- Figure 5.
Expression of VGLUT3-p.A224V in soma and terminals of VGLUT3-positive neurons in the brain of WT and VGLUT3A224V/A224V mice. A–H, Immunofluorescence visualization and quantification of VGLUT3 in the striatum (A, C) and in the CA1 pyramidal field of the hippocampus (E, G) in WT (A, E) and VGLUT3A224V/A224V (C, G) mice. VGLUT3 expression is substantially reduced in terminals of the striatum (B, −69%) and hippocampus (F, −72%), whereas its expression is unchanged in the soma of TANs and basket cells (D, H). I, J, Electron microphotographs of the soma of TANs in striatal sections of WT (I) and VGLUT3A224V/A224V (J) mice. VGLUT3 is labeled with gold particles. The distribution of VGLUT3 labeling is similar in WT (I) and VGLUT3A224V/A224V (J) mice. St, Striatum; Hi, hippocampus; er, endoplasmic reticulum; n, nucleus; or, stratum oriens of the hippocampus; py, stratum pyramidale of the hippocampus; rad, stratum radiatum. Scale bar, A, C, E, G, 35 μm; I, J, 1 μm. *** p < 0.001.
- Figure 6.
The p.A211V mutation does not alter VGLUT3 mobility. A, Representative image sequence depicting the initial fluorescence in the chosen boutons (white arrow), the loss of fluorescence after bleaching (time point, 2:10 min), and the gradual recovery of fluorescent material in the bleached region in hippocampal cultures expressing either VGLUT3-venus or VGLUT3-p.A211V-venus. B, Kinetics of FRAP over 75 min in neurons expressing VGLUT3-venus or VGLUT3-p.A211V-venus. Average recovery curves (error bars represent SEM) are shown in black for VGLUT3-venus and in red for VGLUT3-p.A211V-venus. The inset shows FRAP curves during the first 10 min, with images taken every 5 s. C, Amplitude of recovery for VGLUT3-venus or VGLUT3-p.A211V-venus in bleached boutons 60 min after recovery from bleaching. Data are pooled from five independent cultures for FRAP and three independent cultures for fast FRAP (n = 25 boutons per condition).
- Figure 7.
Behavioral analysis of VGLUT3A224V/A224V mice. A, In the open field, WT littermates and VGLUT3A224V/+ and VGLUT3A224V/A224V mice spent the same time at the center of the open field (Kruskal–Wallis test, p > 0.05) and presented the same locomotor activity at the center and the periphery of the open field (Kruskal–Wallis test, p > 0.05). The number of animals is indicated in the bar graph. B, Anxiety levels assessed in the elevated plus maze were similar in WT, VGLUT3A224V/+, and VGLUT3A224V/A224V mice (Kruskal–Wallis test, p > 0.05). Horizontal exploration was measured for 6 min. No difference was found in total entries or in the time spent in open arms between the WT and the VGLUT3 mutant mice (Kruskal–Wallis test, p > 0.05). C, Spontaneous locomotor activity of naive WT, VGLUT3A224V/+, and VGLUT3A224V/A224V mice. Horizontal locomotor activity was recorded for 5 h (first hour during the light cycle, followed by four hours during the dark cycle). Spontaneous locomotor activity was similar in WT and mutant animals (Kruskal–Wallis test, p > 0.05). D, Left, Time course of the locomotor effect of cocaine (10 mg/kg, i.p.) in WT (n = 7) and VGLUT3A224V/A224V (n = 6) mice. Animals were placed in the cyclotron for 240 min for habituation, given injections of saline (NaCl 0.9%), placed back in the cyclotron for 60 min, and given injections of cocaine (10 mg/kg). After cocaine injection, locomotion was recorded for 95 min. There was no significant difference in locomotor activity between WT and mutant mice that were treated with cocaine (repeated-measures ANOVA, p > 0.05). Right, Cumulative horizontal locomotor activity over 60 min for saline-treated or 95 min for cocaine-injected WT (n = 7) and VGLUT3A224V/A224V mice (n = 6). No difference was observed in cumulative locomotor activity after saline or cocaine injection between the WT and the VGLUT3A224V/A224V mice (Mann–Whitney U test, p > 0.05). E–H, Behavioral analysis of mice expressing only one copy of VGLUT3-pA224V (VGLUT3A224V/−). E, In the open field, WT and VGLUT3A224V/− mice spent the same time in the center area and crossed the periphery or the central area the same number of times (Mann–Whitney U test, p > 0.05). F, WT and VGLUT3A224V/− mice presented the same anxiety level when assessed in the elevated plus maze (Mann–Whitney U test, p > 0.05). G, Time course of the locomotor effect of cocaine (10 mg/kg, i.p.) in WT mice and VGLUT3A224V/− mice. Animals were placed in the cyclotron as described in D. No significant differences in locomotor activity were observed after cocaine injection between the WT and the mutant mice (repeated-measures ANOVA, p > 0.05). H, Cumulative horizontal locomotor activity during the first 120 min in the cyclotron or 60 min after saline injection and 95 min after cocaine injection (10 mg/kg, i.p.) in WT (n = 16) and VGLUT3A224V/− (n = 15) mice. During the first 2 h in the cyclotron, the locomotor activity of the VGLUT3A224V/− mice was higher than the locomotor activity of the WT mice (Mann–Whitney U test, p = 0.0329). After saline injection, the VGLUT3A224V/− mice were slightly hyperactive compared with the WT mice (Mann–Whitney U test, p = 0.0270). No difference was observed in cumulative locomotor activity after cocaine injection between the WT and the VGLUT3A224V/− mice (Mann–Whitney U test, p = 0.1725). Sal, Saline; Coc, cocaine.
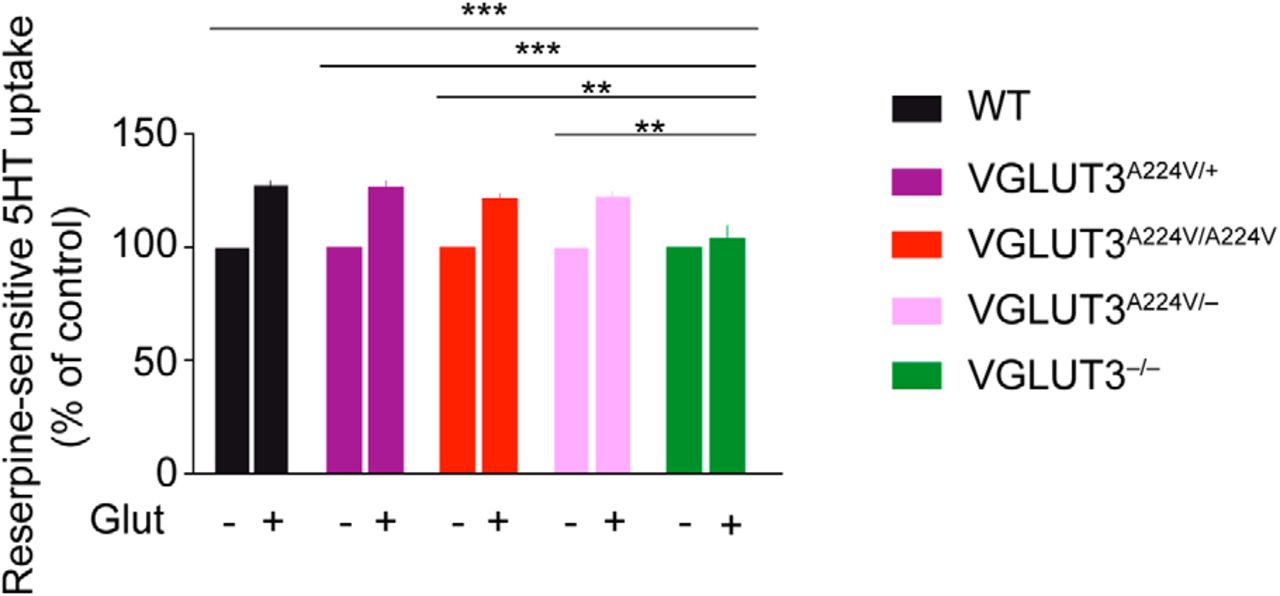
- Figure 8.
The p.A224V mutation does not influence VGLUT3-dependent vesicular synergy. [3H]5-HT reserpine-sensitive uptake in cortical synaptic vesicles was measured in the presence (+) or absence (−) of l-glutamate (Glut). [3H]5-HT reserpine-sensitive vesicular accumulation was augmented by l-glutamate (10 mm) in the cortical synaptic vesicles of WT (+27%), VGLUT3A224V/+ (+27%), VGLUT3A224V/A224V (+22%), and VGLUT3A224V/− (+22%) mice but not in VGLUT3−/− mice because of the absence of VGLUT3 from synaptic vesicles. ** p < 0.01; *** p < 0.001.
- Figure 9.
High-resolution fluorescence imaging by STED microscopy revealed a decrease in VGLUT3-positive vesicles in mutant mice. A–E, Codetection by STED microscopy of VGLUT3 (red) and synaptophysin (green) in axonal varicosities of the striatum of WT (A), VGLUT3A224V/+ (B), VGLUT3A224V/A224V (C), VGLUT3A224V/− (D), and VGLUT3−/− (E) mice. VGLUT3 and synaptophysin immunofluorescence events were observed as round-shaped elements within striatal varicosities of WT, VGLUT3A224V/+, VGLUT3A224V/A224V, and VGLUT3A224V/− mice. In VGLUT3−/− mice, only synaptophysin was detected. Note the decrease in the number of VGLUT3-immunopositive puncta in VGLUT3A224V/+, VGLUT3A224V/A224V, and VGLUT3A224V/− mice compared with WT mice. Scale bar, 500 nm. F, Quantification of VGLUT3 and synaptophysin immunofluorescent events per varicosities. The numbers of VGLUT3-immunopositive puncta were quantified in striatal axonal varicosities of WT, VGLUT3A224V/+, VGLUT3A224V/A224V, VGLUT3A224V/−, and VGLUT3−/− mice after double immunofluorescence (80, 76, 76, 90, and 105 varicosities per animal were quantified in 6 WT, 6 VGLUT3A224V/+, 6 VGLUT3A224V/A224V, 6 VGLUT3A224V/−, and 5 VGLUT3−/− mice, respectively). Note that the number of VGLUT3 puncta decreased with the genotype. G, Correlation between number of VGLUT3-positive puncta determined by STED microscopy and VGLUT3 expression determined by immunoautoradiography. The correlation was statistically significant (linear regression, r2 = 0.9528; p = 0.0044). H, Effect of laser power on the number of events of VGLUT3-fluorescence detection. The blue arrowheads indicate the laser power that was selected for the images shown in A–E. The number of puncta per varicosity did not differ significantly when the laser power increased (Kruskal–Wallis test, p > 0.05).
- Figure 10.
Putative models depicting the reduction in VGLUT3 at the synapses of different mouse genotypes. In this study, we investigated mouse models with variable levels of VGLUT3 expression: WT mice (2 copies of WT VGLUT3 isoform; 100%), heterozygous mice (1 copy of WT VGLUT3 isoform and 1 copy of VGLUT3-p.A224V allele; 67%), homozygous mice (2 copies of the mutated VGLUT3-p.A224V allele; 28%), VGLUT3A224V/− mice (expressing only 1 copy of the mutated VGLUT3-p.A224V allele; 21%), and VGLUT3 knock-out mice (no copy of VGLUT3; 0%). A, The black curve shows the relationship between VGLUT3 expression (detected by immunoautoradiography) and the activity of VGLUT3 (indirectly assessed by measuring vesicular synergy). VGLUT3 activity did not decline in proportion to the amount of VGLUT3 in the expression range between 100% and 21% (black curve). The absence of a correlation between these two sets of measurements explains the virtual lack of a VGLUT3-dependent phenotype in our panel of mutants. This model predicts that these phenotypes will be observed in the gray zone of the curve (red curve). B, Three putative models that may account for the reduction in VGLUT3 at the synapses are compared with our experimental results. In WT mice, numerous copies of VGLUT3 are uniformly distributed between synaptic vesicles, and these vesicles are “normally” loaded (100% gray level) with glutamate. In Model 1 (molecular model), VGLUT3 copies are uniformly decreased in all vesicles of VGLUT3A224V/A224V mice. In this model, the vesicular content of glutamate is minimally decreased in all vesicles. This decrease in glutamatergic quantal size cannot be observed with bulk methods, such as vesicular uptake or behavioral measurements, but can be detected by more sensitive electrophysiological techniques. Model 1 would be compatible with (1) an absence of change in vesicular uptake (observed in BON cells) and vesicular synergy (VS; observed in cortical vesicles) and (2) a decrease in the amplitudes of the mEPSCs that were observed in recordings of isolated neurons. Model 2 (vesicular model) is based on the STED high-resolution inspection of VGLUT3-positive terminals in our panel of mutants. In this model, in a small proportion of vesicles, the number of VGLUT3-p.A224V copies per vesicles is similar (or minimally decreased) to that found in WT neurons. According to the electrophysiological recordings of autapses, these vesicles may contain normal levels of glutamate and be preferentially docked. The remaining vesicles (80%) will contain neither VGLUT3 nor glutamate. This model is consistent with the decreased frequency of the mEPSCs. A mixed model (Model 3) of these two models may better explain all of our experimental results. In this model, we found vesicles without VGLUT3, a small proportion of vesicles expressing the correct number of VGLUT3-p.A224V copies, and a third population of vesicles in which the number of VGLUT3 copies were uniformly decreased in all vesicles of the synapses from VGLUT3A224V/A224V mice.


Tables
Name Number of copies of VGLUT3 allele VGLUT3+ VGLUT3A224V VGLUT3− WT or VGLUT3+/+ 2 0 0 VGLUT3A224V/+ 1 1 0 VGLUT3A224V/A224V 0 2 0 VGLUT3A224V/− 0 1 1 VGLUT3−/ − 0 0 2 - Table 2.
Percentage of decrease in VGLUT3 expression as determined by immunoautoradiography in the striatum, hippocampus, and raphe nuclei of VGLUT3A224V/+, VGLUT3A224V/A224V, and VGLUT3A224V/− at P10 and 3, 6, or 12 months of age
Brain area Genotype % VGLUT3 decrease P10 3 months 6 months 12 months Striatum VGLUT3A224V/+ N.A. 34 50 N.A. VGLUT3A224V/A224V 83 76 77 85 VGLUT3A224V/− N.A. 84 N.A. N.A. Hippocampus VGLUT3A224V/+ N.A. 26 38 N.A. VGLUT3A224V/A224V 76 69 70 78 VGLUT3A224V/− N.A. 88 N.A. N.A. Dorsal raphe VGLUT3A224V/+ N.A. 16 24 N.A. VGLUT3A224V/A224V 50 46 61 77 VGLUT3A224V/− N.A. 71 N.A. N.A. Median raphe VGLUT3A224V/+ N.A. 20 29 N.A. VGLUT3A224V/A224V N.A. 74 63 N.A. N.A., Not applicable.
- Table 3.
Percentage decrease in VGLUT3 expression as determined by Western blot analysis of the cortex, striatum, and hippocampus of heterozygous and homozygous VGLUT3-p.A224V-expressing mice at 3 months of age
Brain area Genotype % VGLUT3 decrease Cortex VGLUT3A224V/+ 63 VGLUT3A224V/A224V 72 Striatum VGLUT3A224V/+ 55 VGLUT3A224V/A224V 85 Hippocampus VGLUT3A224V/+ 47 VGLUT3A224V/A224V 70


