

Article Figures & Data
Figures
- Figure 1.
3–5 Hz Vm oscillations are brief stereotyped events characterized by high amplitude 3–5 Hz fluctuations riding on a hyperpolarized baseline Vm. A, Example whole-cell recording from a V1 layer 2/3 excitatory neuron during wakefulness, simultaneously recorded with the local ECoG (top) placed over V1 and the treadmill motion (locomotion, bottom). Gray dotted lines indicate times when 3–5 Hz oscillations were observed in the neuron's Vm. B, Example 3–5 Hz Vm oscillations from 10 neurons. The beginning and end of the 3–5 Hz Vm oscillations are indicated by the left edge of the shaded box and the dotted vertical line, respectively. The cycles are numbered on cell 10 to demonstrate the frequency of the oscillations. C, Zoom up of the shaded region in B. Note the hyperpolarization and the similar amplitude of the oscillation across all 10 neurons. The mean periodogram (D) and spectrogram (E) during 3–5 Hz Vm oscillations collected from 40 neurons. Histogram of the mean change in Vm baseline (F) and histogram of the mean trough to peak amplitude during 3–5 Hz Vm oscillations (n = 40 neurons) (G). Histogram of the mean oscillation frequency (H) and histogram of the mean oscillation duration (n = 40 neurons) (I). Mean (μ) and SD (σ) are shown on each histogram. Scatter plots above each histogram further illustrate each distribution. J, The Pearson correlation coefficient between each 3–5 Hz Vm oscillation (top left, 3–5 Hz Vm Osc vs 3–5 Hz Vm Osc) and each 3–5 Hz Vm oscillation and a period of equal length 4 s preceding each 3–5 Hz Vm oscillation (bottom right, 3–5 Hz Vm Osc vs No 3–5 Hz Vm Osc) for every oscillation in one neuron (cell 8, n = 289 3–5 Hz Vm oscillations). K, The mean correlation coefficient between each 3–5 Hz Vm oscillation and each 3–5 Hz Vm oscillation compared with the 2 s before a 3–5 Hz Vm oscillation (cell 8, n = 289 3–5 Hz Vm oscillations; WSRT, p < 0.0001). L, The mean correlation coefficient between each 3–5 Hz Vm oscillation and each 3–5 Hz Vm oscillation compared with the 2 s before a 3–5 Hz Vm oscillation averaged across all excitatory neurons (n = 40 neurons; WSRT, p < 0.0001). Error bars indicate SEM. *p < 0.05.
- Figure 2.
3–5 Hz Vm oscillations reduce the responsiveness of V1 L2/3 neurons. A, Example response of an V1 L2/3 excitatory neuron to a 1.5 s full-screen drifting grating with (bottom) and without (top) a 3–5 Hz oscillation while stimulated at the preferred orientation. B, The mean orientation tuning of excitatory neurons (n = 40) in the presence (gray) and absence (black) of 3–5 Hz Vm oscillations. The firing rate at the preferred angle was significantly larger in the absence of oscillations for excitatory neurons (WRST, p = 8.1e-5). C, The mean periodogram of the Vm during visual stimulation when a 3–5 Hz Vm oscillation is present (gray) and absent (black). Shading represents SEM. *p < 0.05.
- Figure 3.
PV+ and SOM+ neurons fire at the peaks of 3–5 Hz Vm oscillatory cycles when excitatory neurons rarely fire. A, Simultaneous V1 ECoG (top) and whole-cell recordings (bottom) from V1 L2/3 excitatory (left), PV+ (center), and SOM+ (right) neurons during Vm 3–5 Hz oscillations. B, The percentage of peaks with at least one action potential (AP, left; one-way ANOVA p = 2.71e-14) and the FR at the peaks of oscillations (one-way ANOVA p = 2.71e-14) was significantly lower in excitatory neurons than in PV+ (% AP, WRST, p = 0.0001; FR, WRST, p = 0.0001) and SOM+ (% AP, WRST, p = 0.0008; FR, WRST, p = 0.0006). C, Mean tuning curve of PV+ and SOM+ neurons. D, The baseline firing rates of excitatory (left), PV+ (middle), and SOM+ (right) neurons in the presence and absence of 3–5 Hz Vm oscillations. E, Plots of the mean change in Vm baseline during 3–5 Hz oscillations (left) and mean oscillation trough to peak amplitude (right) for excitatory (black, n = 40), PV+ (red, n = 6), and SOM+ (blue, n = 7) neurons. PV neurons experienced greater changes in trough to peak amplitude (one-way ANOVA, p = 0.01) than excitatory neurons (Tukey-HSD, p = 0.01) and SOM+ neurons (Tukey-HSD, p = 0.04) during Vm 3–5 Hz oscillations. Change in Vm baseline was similar between neuronal types (one-way ANOVA, p = 0.1). F, Plots of mean frequency (left) and duration (right) of 3–5 Hz oscillatory periods in excitatory (black, n = 40), PV+ (red, n = 6), and SOM+ (blue, n = 7). Oscillation frequency and duration were unchanged between neuronal types (one-way ANOVA, p = 0.55 and p = 0.43, respectively). Error bars indicate SEM. *p < 0.05.
- Figure 4.
3–5 Hz Vm oscillations represent a transient synchronized network state. A, Example V1 ECoG (top) and V1 L2/3 Vm recordings from excitatory (left, black), PV+ (middle, red), and SOM+ (right, blue) neurons. Dotted gray lines were added to illustrate the phase relationship between the ECoG and Vm. B, Mean V1 z-score normalized ECoG (top) and mean Vm for Exc. (black, n = 40), PV+ (red, n = 6), and SOM+ (blue, n = 7) during an oscillation cycle. Traces were synchronized to the peak of the oscillation detected in the Vm. ECoG error bar indicates SD. C, Mean Vm-ECoG phase offset for excitatory (black), PV+ (red), and SOM+ (blue) neurons. D, Vm-ECoG correlation coefficient is higher magnitude during oscillations than directly after an oscillation in all cell types (Exc., WSRT, p = 3.2e-8; PV+, WSRT, p = 0.004; SOM+, WSRT, p = 5.8e-4). E, V1 ECoG 30–50 Hz power (top) is higher (one-way ANOVA, p < 0.0001) before (WSRT, p < 0.0001) and after (WSRT, p = 0.0001) an oscillation. The 3–5 Hz power is lower (one-way ANOVA, p = 0.0012) before (WSRT, p < 0.0001) and after (WSRT, p < 0.0001) 3–5 Hz Vm oscillations. F, The 3–5 Hz power is higher (one-way ANOVA, p < 0.0001) before (WSRT, p < 0.0001) and after (WSRT, p < 0.0001) 3–5 Hz Vm oscillations. Error bars and shading represent SEM. *p < 0.05.
- Figure 5.
Go/No-Go discrimination task schematics and learning curves. A, Schematic of the animal performing the visual (left) and auditory (right) discrimination tasks. During both tasks, animals were head-fixed atop a friction-less spherical treadmill, a monitor was placed in the monocular visual field, and a water dispenser with reward retrieval vacuum and lick monitoring was used to deliver rewards. Illumination levels were identical during auditory and visual discrimination tasks (for more details, see Materials and Methods). B, Task schematic. Visual and auditory stimuli were presented for 3 s. In Go trials, 45° gratings or a 5 kHz tone were played and a water reward was issued 2 s after stimulus onset. During No-Go trials, 135° gratings or a 10 kHz tone were played and no reward was issued. Animal response (licking) was recorded during the response period to assess correct behavior (for more details, see Materials and Methods). C, The mean discriminability, a measure of animal performance, of animals during learning of the visual (left, red, n = 17 animals) and auditory (right, blue) discrimination tasks (n = 7 mice). Bold colored line indicates the mean performance of all animals on a given session date. Light gray lines indicate the mean performance of a single animal on a given session date. Animals were recorded once their mean discriminability surpassed D′ = 1.7 (Monte Carlo simulation, p = 0.01 random behavior) indicated by the gray dotted line.
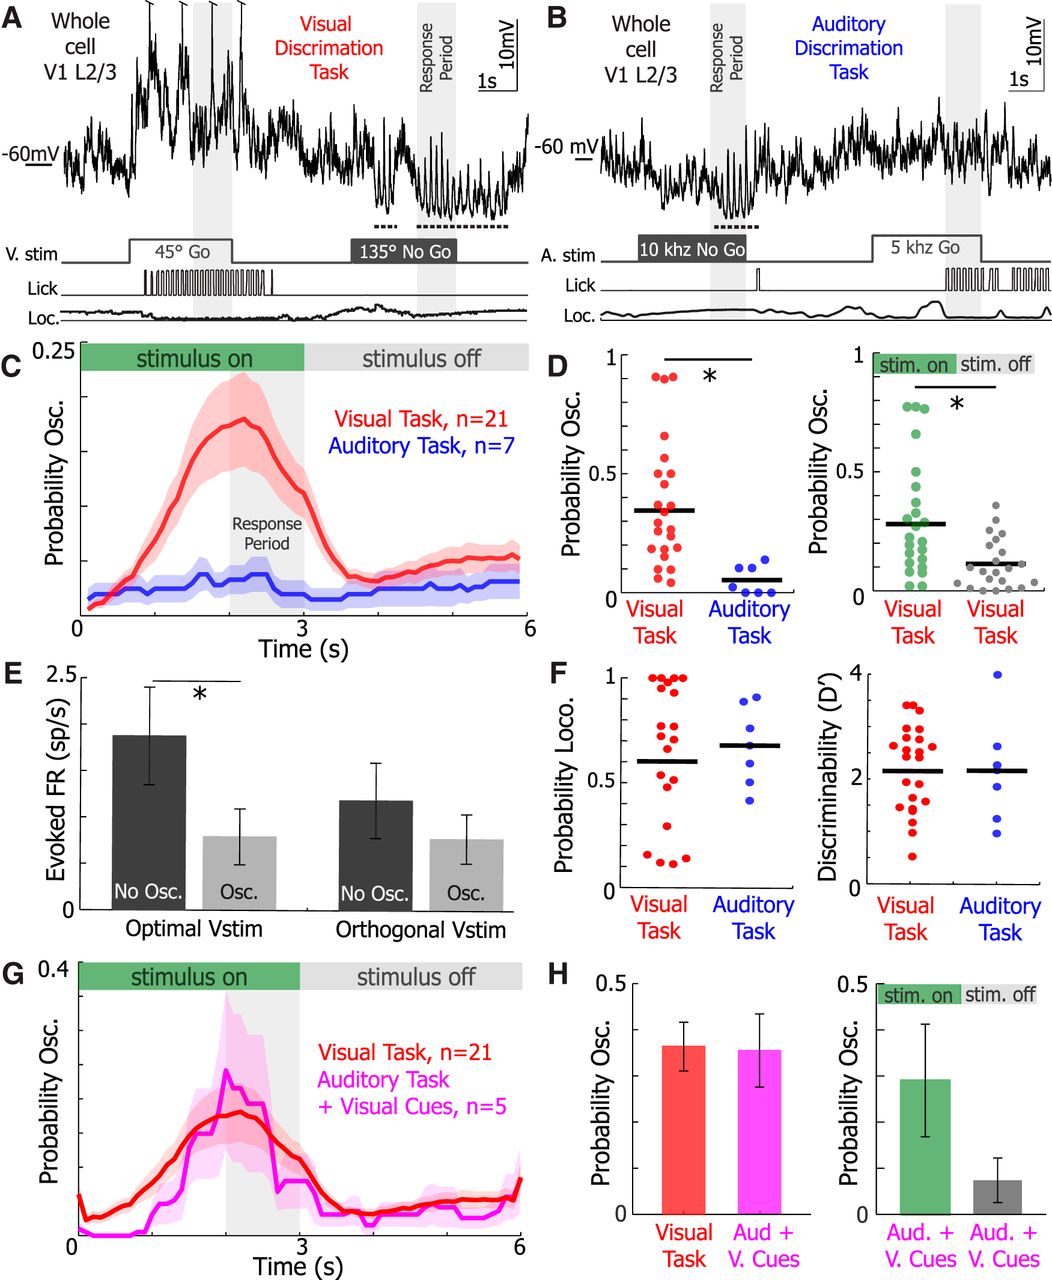
- Figure 6.
3–5 Hz Vm oscillations are recruited during visual stimulation in behaving animals. Example subthreshold activity from single neurons as animals perform the (A) visual discrimination and (B) auditory discrimination tasks. Stimuli timing, licking, and locomotion were recorded simultaneously. Dotted underline indicates 3–5 Hz Vm oscillation occurrences. C, The mean probability of 3–5 Hz Vm oscillations occurring during a trial of the visual (red, n = 21 neurons) and auditory (blue, n = 7 neurons) Go/No-Go tasks. Periods where stimuli were on and off are marked at the top. The response period, when the animal must report its decision, is denoted in the gray region. D, The probability of an oscillation occurring during a trial in the visual task was significantly greater than in the auditory task (left, WRST, p = 0.001). The probability of an oscillation occurring during the visual task was significantly higher than when the stimulus was off (right, WSRT, p = 0.0037). E, The mean firing rate evoked by optimal visual stimuli (left, WSRT, p = 0.001) and orthogonal visual stimuli (right, WSRT, p = 0.68) when 3–5 Hz oscillations were present (osc.) or absent (no osc.) in neurons recorded from animals during visual discrimination (n = 21 neurons). F, There was no difference in the probability of locomotion during a trial (WRST, p = 0.92) and the mean discriminability (D′) during a behavioral session (WRST, p = 0.72) during the visual (red) and auditory task (blue). G, The mean probability of 3–5 Hz oscillations occurring during a trial of the visual (red, n = 21 neurons) and auditory task + visual cues (Aud. + V. Cues, pink, n = 5 neurons) task. Visual cues in the auditory task + visual cues trials were not salient and were displayed simultaneously with auditory cues identical in the auditory task. H, The probability of an oscillation occurring during a trial in the auditory task + visual cues was not different from the visual task (WRST, p = 0.82). The probability of an oscillation occurring while stimuli were on (green) versus off (gray) was statistically not different during the auditor task + visual cues (WSRT, p = 0.17). Error bars and shaded regions represent SEM. *p < 0.05.
- Figure 7.
Visual stimulation recruits 3–5 Hz Vm oscillations during passive viewing, but oscillations tend to occur after the visual stimulus during passive viewing. A, The number of oscillations per minute was higher during passive viewing (black) of 1.5 s drifting gratings than 5–10 min periods where no visual stimuli were shown (No vstim, gray; WSRT, p = 1.7e-5). B, The number of oscillations per minute was higher during the visual task (red) than the auditory (blue) discrimination task (WRST, p = 0.008). C, The probability of 3–5 Hz Vm oscillations during a trial was not different during the visual task and passive viewing (WRST, p = 0.26). D, The probability of evoking an oscillation during passive viewing when the visual stimulus is 1.5 s (top, n = 40) or 3 s (bottom, n = 9). E, Comparison of the mean probability of 3–5 Hz Vm oscillations occurring in neurons recorded from animals during the visual task (red, n = 21) and passive viewing (gray, n = 53) while a visual stimulus is on (left, WRST, p = 0.001) and off (right, WRST, p = 0.007). F, The probability of a 3–5 Hz Vm oscillation occurring during passive viewing of visual cues in relation to excitatory neuron (n = 40, one-way ANOVA, p = 0.76) tuning. Pref., Preferred visual stimulus. G, The probability of a 3–5 Hz Vm oscillation occurring during visual discrimination of the optimal or orthogonal visual stimulus (n = 21 neurons, WSRT, p = 0.34). Error bars indicate SEM. *p < 0.05.
- Figure 8.
Oscillation prevalence and timing varied by trial type, and oscillations typically occurred after initiation of licking. A, The mean probability of 3–5 Hz oscillations occurring during Go trials (hits, black; FA) and No-Go trials (CR, dark lines; misses, light lines) (n = 21 neurons). Compared with CR trials, oscillations were less likely to occur during hit trials (WSRT Bonferroni-corrected, p = 0.046) and FA trials (WSRT Bonferroni-corrected, p = 0.04). B, The mean duration of 3–5 Hz oscillations during Go trials (hits, black; FA) and No-Go trials (CR, dark lines; misses, light; n = 21 neurons). Oscillations were shorter during hit trials than during CR trials (WRST Bonferroni-corrected, p = 0.035). Error bars indicate SEM. *p < 0.05.
- Figure 9.
Oscillations occurred in high and low arousal states. A, Example of a whole-cell recording from a V1 L2/3 neuron during the visual discrimination task where speed (blue) and pupil size (red) were simultaneously recorded. The 3–5 Hz Vm oscillation is underlined by the dotted line. B, The mean probability of 3–5 Hz oscillations occurring during trials of the visual discrimination task with locomotion (blue) and without locomotion (gray) (n = 21 neurons). C, The mean probability of 3–5 Hz oscillations occurring during trials of the visual discrimination task when the pupil is >50% (red) and <50% (gray) of full size (n = 4 neurons). D, E, The probability of an oscillation occurring during a trial of the visual task was no different when animals were running or not running (n = 21, WSRT, p = 0.76) and when the pupil was >50% or <50% of full size (n = 4, WSRT, p = 0.63). F, The average number of 3–5 Hz Vm oscillations per minute occurring during locomotion (blue) and when locomotion was absent (gray) was not significantly different (n = 21 neurons, WSRT, p = 0.46). G, The number of oscillations occurring when the pupil was 0%–25%, 25%–50%, 50%–75%, and 75%–100% of its full size was unchanged across pupil sizes (n = 4 neurons, one-way ANOVA, p = 0.96). Error bars and shading represent SEM.
- Figure 10.
Oscillations are correlated with small reductions in speed and pupil size. A, Example V1 L2/3 Vm, animal speed, and pupil size traces. Dotted horizontal lines indicate 3–5 Hz Vm oscillations. Periods where the pupil was detected to be dilating and constricting are marked in teal and purple, respectively. B, C, Left, Example histogram of speed and pupil size during (colored) and in the absence (gray) of 3–5 Hz Vm oscillations. Middle, The oscillation triggered mean speed and pupil size. Gray box represents oscillation onset and average duration. Right, The mean speed and pupil size before, during, and after an 3–5 Hz Vm oscillation. Speed was greater before and after oscillations (B, bottom, WSRT, Before vs Oscillation, p = 0.0001, Before vs After, p = 0.0011, Oscillation vs After, p = 0.0176). Pupil size was greater before oscillations (C, bottom, WSRT, Before vs Oscillation, p = 0.028, Before vs After, p = 0.79, Oscillation vs After, p = 0.34). The mean probability of evoking a 3–5 Hz Vm oscillation at locomotion onset (D) and (E) offset. The probability of evoking an oscillation was slightly dampened after oscillation onset (WSRT, p = 0.012). The mean probability of evoking an oscillation at dilation onset (F) and (G) constriction onset. The probability of evoking an oscillation was no different before and after dilation onset (n = 4, WSRT, p = 0.91) and constriction onset (n = 4, WSRT, p = 0.25). H, The mean periodogram of the Vm during 3–5 Hz Vm oscillation and the 1.5 s following constriction onset, and locomotion offset. I, Mean pupil size during visual cues while animals performed visual discrimination. J, The mean x and y movement of the pupil during visual cues while animals performed visual discrimination. Error bars and shading represent SEM. *p < 0.05.


