

Article Figures & Data
Figures
- Figure 1.
Multidimensional signal-detection (m-ADC) model to dissociate bias from sensitivity effects in multialternative attention tasks. A, Schematic of a spatial two-alternative, cued detection task. The subject initiates a trial by fixating on a dot at the center of the screen. A cue (white line segment) indicates the likely location of subsequent target stimulus. A target (positive contrast dot) is briefly presented at one of two potential target locations. The subject is rewarded for indicating the location of the target with a saccade (line) to the corresponding response box (squares). On catch trials, no target is presented for a prolonged period following fixation. On these trials, the subject is rewarded for maintaining fixation on the zeroing dot even after the response boxes appear. B, Distributions of the bivariate decision variable (Ψ) in a two-dimensional decision space for no-stimulus (catch; n), stimulus at location 1 (s1), and stimulus at location 2 (s2). Dashed white lines indicate orthogonal perceptual dimensions for locations 1 and 2, respectively. Units: SD of the decision variable distribution. Black curves, One-dimensional Gaussians, marginal distributions of each decision variable component. The s1 and s2 distributions correspond to the n distribution translated along the respective perceptual dimension by an amount equal to the perceptual sensitivity for detecting the stimulus at that location (d1 or d2, respectively). Perceptual sensitivity at location 1 is illustrated as greater than at location 2 (d1 > d2), as could result from cueing location 1 for attention. C, Log posterior odds ratio (Λ) and the family of optimal decision surfaces (hyperplanes) of constant Λ (dashed lines) for distinguishing a stimulus at location 1 versus noise (s1 vs n), a stimulus at location 2 versus noise (s2 vs n); and a stimulus at location 1 versus at location 2 (s1 vs s2). D, Decision variable (Ψ) distributions (circles) and putative optimal decision surfaces (thick black lines) for the 2-ADC model with unequal perceptual sensitivities (d1 ≠ d2) and choice criteria (c1 ≠ c2) at the two locations. Solid circle, Contour of the noise distribution; dot-dashed and dashed circles, contours of the signal distribution for a stimulus at location 1 and 2, respectively. The decision boundaries partition the decision space into nonoverlapping domains for each potential response: NoGo (unshaded region), Go response to location 1 (light shading), or Go response to location 2 (dark shading). One-dimensional Gaussians along each axis: marginal distributions of each decision variable component. Dashed diagonal line with X symbol: line of equal sensory evidence (Ψ1 = Ψ2). E, A cued two-alternative orientation-change detection paradigm. Following fixation, the subject is presented with two oriented gratings that flashed on and off for variable durations. At a random time, the orientation of one of the gratings changes, and the subject is rewarded for making a saccadic eye movement to the location of change (change trials) or for maintaining fixation on trials when no change occurred (catch trials). Attention is cued to a location across a block of trials by increasing the probability of change occurrence at that location (dashed white circle). The task is conceptually similar to one in which an explicit cue is presented on each trial (A). F, Simulated percentage correct as a function of sensitivity (d) for detecting orientation changes at cued (closed circles) and uncued (open circles) locations. G, Simulated psychometric functions, percentage correct as a function of stimulus physical strength (e.g., orientation change magnitude or contrast) at cued (closed circles) and uncued (open circles) locations.
- Figure 2.
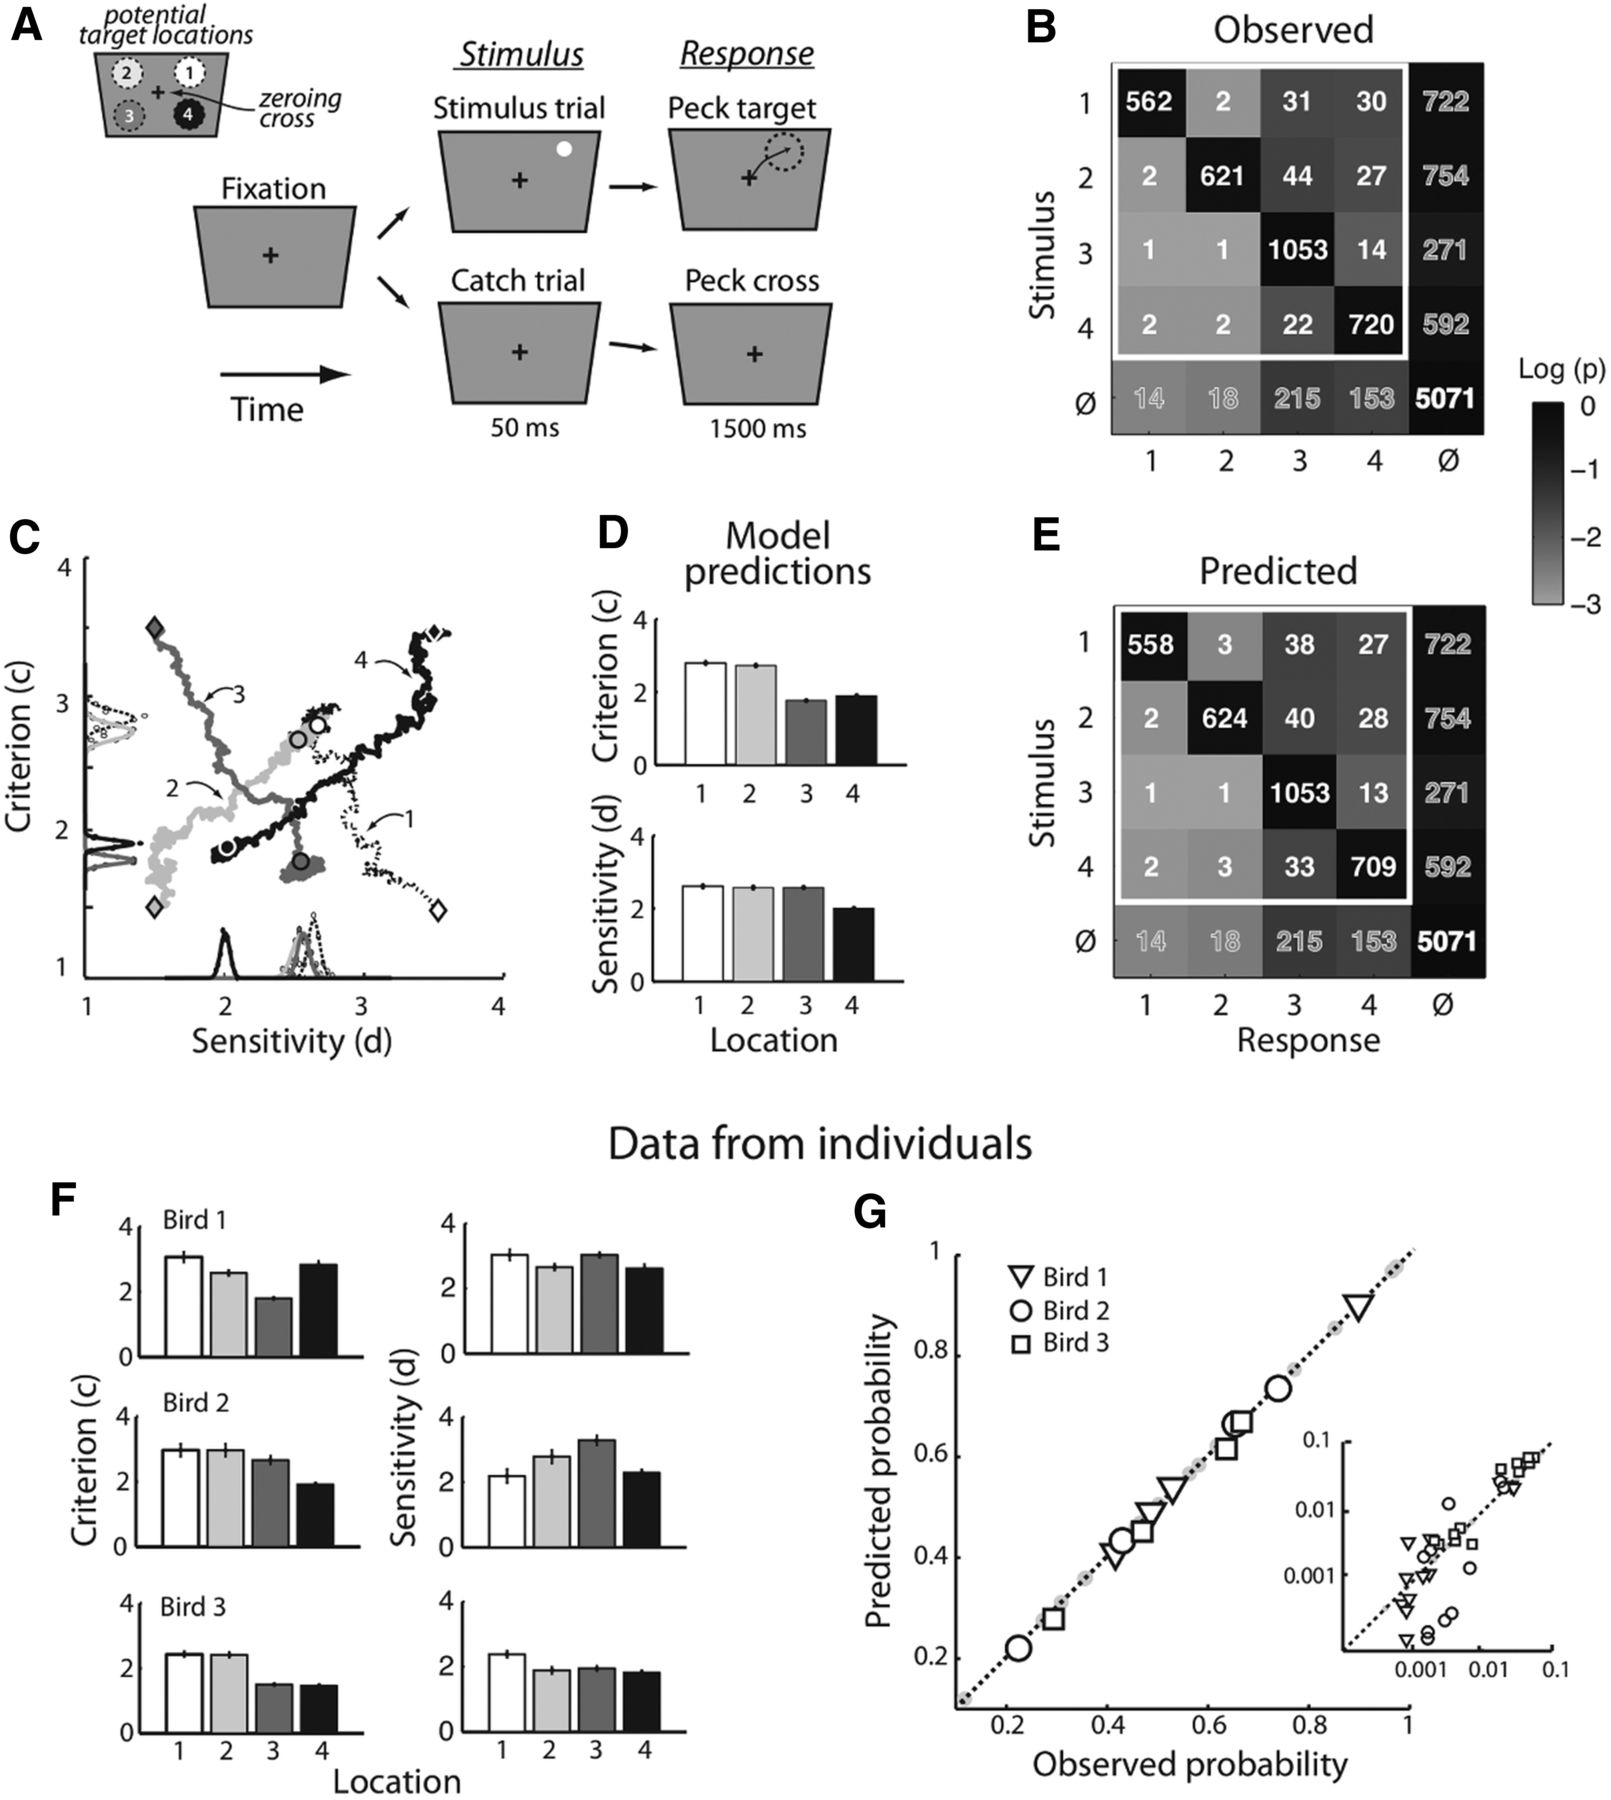
Analysis of a four-alternative target detection task with the m-ADC model. A, Spatial, four-alternative target detection task based on target luminance. The bird (chicken) initiated a trial by pecking on the zeroing cross in the center of a touch-sensitive screen. Following trial initiation, a target (positive contrast, 3° dot) was presented briefly (50 ms) at one of four potential locations, one in each visual quadrant (stimulus trials). On interleaved trials, no target was presented (catch trials). Birds were rewarded for pecking accurately at the target's location when it occurred and for pecking at the zeroing cross (NoGo) on trials when no stimulus was presented. Stimulus and catch trials were equally probable (50%). Targets appeared with equal probability (25%) at any one of the four locations, pseudorandomly interleaved. Top left graphic, Numerical convention for identifying the target's quadrant (1–4) on the screen. B, Observed response counts (numbers within cells) and conditional response probabilities (shading of cells). Data pooled across 108 experiments in three birds. Rows, Target locations (as defined in A); last row (φ), no-stimulus (catch). Columns, Response locations (as defined in A); last column (φ), NoGo responses. Cells within white square, Hits (diagonal cells) and misidentifications (off-diagonal cells) used for model predictions (E). C, Bayesian parameter estimation of the sensitivity (x-axis) and criterion (y-axis) at each target location (as defined in A) with the MCMC (Metropolis sampling) algorithm. Diamonds, Initial guess for each sensitivity and criterion; circles, final value for each sensitivity and criterion after convergence (medians of the posterior distributions); trajectories, Markov chains for convergence from the initial guesses to the final values. Curves along axes, Gaussian fits to the posterior distributions of the sensitivity and criterion values at each location. D, ML estimates of criteria (above) and sensitivities (below) for each location obtained by fitting the m-ADC to the behavioral data from B. Bar shading, Numerical convention for identifying the target's quadrant, as defined in A. Error bars, ML standard error. E, Model predictions of response counts (numbers within cells) and probabilities (shading of cells) for the highlighted 4 × 4 cells of the contingency table, based on model parameters estimated from only the last row and the last column of the contingency table (misses and false alarms); conventions as in B. F–G, Analyses for individual birds. F, ML estimates of sensitivities (left) and criteria (right) for data analyzed from each bird individually with a 4-ADC model. Bar shading, Numerical convention for identifying the target's quadrant, as defined in A. Error bars, ML standard error. G, Response probabilities predicted from the model plotted against experimentally observed response probabilities. Open symbols, Probabilities not used for fitting the model (predictions). Shaded dots, Probabilities used to fit the model. Symbol type, Individual birds. Inset, Smaller response probabilities in the contingency table plotted on a logarithmic scale.
- Figure 3.
Analysis of a four-alternative orientation-change detection task with the m-ADC model. A, Spatial four-alternative, orientation-change detection task. The monkey initiated a trial by fixating on a zeroing dot in the center of the screen. Following trial initiation, four stimuli (oriented gratings) were presented, one in each visual quadrant. After an unpredictable interval (800–2700 ms), the screen went blank (150–300 ms). Then, the four stimuli reappeared. On 50% of trials, one of the four gratings had changed in orientation by 10–90° (change trials), and on the remaining trials none of the stimuli had changed (catch trials). The animal was rewarded for making an eye saccade diagonally opposite to the location of the changed stimulus (antisaccade) when a change had occurred, and was rewarded for maintaining fixation on the zeroing dot (NoGo) when no change had occurred (see Materials and Methods). Catch trials constituted 50% of all trials, and during change trials, the orientation change could happen with equal probability (25%) at any one of the four locations. B, Observed response counts (numbers within cells) and conditional response probabilities (shading of cells). Data pooled across orientation change values in n = 22 experiments. Rows, Change locations (as defined in A); last row (φ), no-stimulus (catch). Columns, Response locations (as defined in A); last column (φ), NoGo responses. Cells outside of white square, Cells representing misses and false-alarm rates used to derive model parameters. Other conventions are the same as in Figure 2B. C, ML estimates of sensitivities and criteria for each location estimated from data in B. Bar shading, Numerical convention for identifying the target's quadrant, as in A. Error bars, ML standard error. D, Response probabilities predicted from the model plotted against experimentally observed response probabilities. Triangles, Probabilities not used for fitting the model (predictions). Shaded dots, Probabilities used to fit the model. E, Model predictions for the central 4 × 4 cells of the contingency table based on model parameters estimated from only the last row and the last column of the contingency table (misses and false alarms); conventions as in B. F, Criteria (c, open triangles) and psychophysical functions of sensitivity (d, circles) for various orientation change values estimated for each quadrant (defined in A) from only 8 of 25 contingencies (B, cells outside the highlighted box). Values of d and c were estimated by binning the orientation change values into 16° bins. Black line, Naka–Rushton fit to the psychophysical function. Error bars, ML standard error. G, Psychometric functions of the proportion of observed responses (filled circles) and model predictions (open triangles) based on the sensitivity and criteria estimates from F. The eight plots are arranged as four matched pairs (top and bottom). The top subplot of each pair (black symbols) shows the percentage correct (hits) as a function of change magnitude (psychometric function of accuracy). The bottom subplot of each pair (colored symbols) shows the percentage errors (incorrect/misidentifications) as a function of change magnitude. The four pairs are spatially aligned with the four corresponding locations of change occurrence (A). In each plot, colors indicate the locations of the responses relative to the location of change. Black, Response to the location of change; blue, response to the diagonally opposite location; red, responses to the location in the same vertical hemifield; green, responses to the location in the opposite hemifield.
- Figure 4.
Analysis of a cued orientation-change detection task with the m-ADC model. A, Spatial four-alternative, cued orientation-change detection task. A monkey was trained on a four-alternative, cued orientation-change detection task. The task was identical to the task shown in Figure 3A, except that on each trial a cue (directed line segment close to fixation spot), indicating the location of the upcoming change with >90% validity, appeared shortly after stimulus onset. B, Contingency table as in Figure 3B, except that reported responses correspond to a single magnitude of orientation change: 45°. C, ML parameter estimates, as in Figure 3C. D, Model predictions, as in Figure 3E. E, Response probabilities predicted from the model plotted against experimentally observed response probabilities for data analyzed individually for each cue location. Open symbols, Probabilities not used for fitting the model (predictions). Shaded dots, Probabilities used to fit the model. Symbol type, Individual cued locations.
- Figure 5.
Comparison of m-ADC model with other candidate models. Leftmost column, Schematics of three models compared with the 4-ADC model (top). Compared with the 4-ADC model, model 4-ADC eq crit and 4-ADC eq sens have three fewer parameters, whereas model 5-AFC has one additional parameter. A, C, E, G, ML estimates of criterion and sensitivity from each model for the four-alternative target detection task (chickens). B, D, F, H, Corresponding model estimates for the four-alternative, cued orientation-change detection task (monkey). Other conventions are as in Figure 2D. For details regarding models and model fitting, see Materials and Methods.
- Figure 6.
Bias effects in a multialternative detection task with cueing or with microstimulation of the SC (Cavanaugh and Wurtz, 2004). A, A two-alternative motion direction-change detection paradigm with interleaved cueing or microstimulation. Following fixation, two patches of random dot motion appeared. After a variable duration, the patches briefly disappeared (∼150 ms) and reappeared. On some trials (change trials), the direction of motion had changed in one of the patches (target patch; dashed circle) upon reappearance; in other trials (catch trials) no change in direction of motion occurred in any of the patches. The monkey was rewarded for making an eye saccade to the target patch on change trials and for maintaining fixation (NoGo) on catch trials. In interleaved trials, a spatial cue indicated the location of the target patch (location of putative motion change) with 100% validity. In other experiments, in place of spatial cues, focal electrical microstimulation was delivered to the spatial representation of the target patch in the SC. B, 2-ADC model for uncued trials (or trials without microstimulation). Dashed gray circles, Ψ Distribution for changes at each location on uncued trials. Solid black circle, Ψ Distribution for no change trials. C, Model for cued trials (or trials with microstimulation). Dashed black and gray circles, Ψ Distribution for changes at cued and uncued locations, respectively, on cued trials. Dashed thick gray line, The criterion (decision boundary) at the uncued location moves to the edge of decision space (see text and Materials and Methods). D, Simulated percentage correct as a function of sensitivity for detecting motion changes (d) during cued/microstimulated (closed circles) and uncued (open circles) trials. E, Simulated psychometric function, percentage correct as a function of motion direction change magnitude during cued/microstimulated and uncued trials. Other conventions are the same as in D. F, Simulated percentage correct versus percentage of false positives for detecting motion changes during cued/microstimulated and uncued trials. Other conventions are the same as in D.
- Figure 7.
Bias effects in a motion discrimination task upon microstimulation of the SC (Müller et al, 2005). A, A 2-AFC paradigm involving a direction of motion discrimination judgment. Following fixation, a wide-field array of flickering dots was presented. After a variable duration (575–1075 ms), a small patch of dots began to move coherently in one of two directions (left vs right). The motion patch was located, on interleaved trials, either within the receptive field of the SC neuron or in a mirror symmetric location about the vertical meridian. After a brief delay (150–750 ms), two response boxes appeared. The monkey was rewarded for indicating the direction of motion of the patch by saccading to the appropriate response box. The proportion of coherently moving dots was varied among four values (12.5–100%) to measure the psychometric function. On interleaved trials, focal microstimulation was delivered at the SC receptive field location. B, 2-ADC model for a perceptual discrimination with NoGo responses. x-axis, Sensory evidence at location 1 (microstimulated location). Positive values indicate evidence in favor of rightward motion. Negative values indicate evidence in favor of leftward motion. y-axis, Sensory evidence at location 2 (nonmicrostimulated location). Positive values indicate evidence in favor of leftward motion. Negative values indicate evidence in favor of rightward motion. Thick lines, Decision boundaries parameterized by two choice criteria (c1 and c2; see C). Central gray zone, Region of decision space corresponding to NoGo response. A Go response indicating rightward motion is made when the sensory evidence falls in the lower-right half-plane and outside the NoGo decision region. Similarly, a Go response indicating leftward motion is made when the sensory evidence falls in the upper-left half plane and outside the NoGo region. Dashed circles, Potential decision variable distributions. C, Same as in B, but following microstimulation of location 1. Thick lines, Decision boundary following microstimulation of location 1, such that c1 decreases and c2 remains unchanged. The (default) decision boundary with no microstimulation is also shown for reference (dashed gray lines). Red circles lie along the lines of equal strength of (conflicting) sensory evidence at the two locations. D, Simulated psychometric function, which indicates percentage correct as a function of the proportion of coherent dots, with (black) or without (gray) SC microstimulation. The microstimulation site was aligned with the location of the coherent motion. E, Same as in D, but with the microstimulation site away from the location of coherent motion. Other conventions are the same as in D.
- Figure 8.
Bias effects in a cued motion direction discrimination (filtering) task upon inactivation of the SC (Lovejoy and Krauzlis, 2010). A, A task paradigm involving discriminating the direction of motion of a cued target patch in the presence of multiple distractors. Following fixation, a cue (red circle) indicated the location of the upcoming target. Following this, four patches of random, incoherent dot motion appeared, one in each quadrant. Following this, the cue offset. At an unpredictable time, the target patch, and the patch in the diametrically opposite location (foil patch) moved coherently in different directions for a brief period (160 ms). The monkey was rewarded for reporting the direction of motion of the target patch with a saccade in that direction, while ignoring the direction of motion of the foil patch. B, 2-ADC model for perceptual discrimination in a filtering task. Dashed gray circle, Decision variable distribution for stimuli at the target and foil locations. x-axis, Sensory evidence corresponding to the target-patch motion. For this example, positive values indicate evidence in favor of motion toward the upper right, and negative values indicate evidence in favor of motion toward the lower left. y-axis, Sensory evidence corresponding to the foil-patch motion. Positive and negative values indicate evidence in favor of motion toward the lower left and upper right, respectively. Thick green line, Decision boundary at baseline (before inactivation). Central gray zone, Region of decision space corresponding to responses based on “neither” stimulus (neither target nor foil). Other conventions are the same as in Figure 7B. C, Same as in B, but following SC inactivation. Thick solid blue line, Decision boundary following inactivation of the target location. The decision boundary before inactivation is shown for reference (dashed green line). D, Simulated proportion of choices based on target motion direction (Correct, red), foil motion direction (Foil, yellow) or neither direction (Neither, gray) following inactivation of the cued (target) location. Dots, Proportions obtained over n = 30 simulated runs by introducing limited, random variations in sensitivities and criteria (see Materials and Methods). Squares, Proportions based on mean values of sensitivities and criteria. E, Same as in D, but for inactivation of the foil location.
- Figure 9.
Bias effects in a cued motion-change detection (filtering) task upon inactivation of the SC (Zénon and Krauzlis, 2012). A, A two-alternative paradigm involving the detection of a change in motion direction of a cued target stimulus in the presence of a foil stimulus. Following fixation, a cue (static dot patch) indicated the location of the upcoming target. Following this, two patches of random dot motion appeared, one at the cued location (Target, red circle) and the other at the opposite location (Foil, yellow circle). At an unpredictable time, the motion direction of one of the patches changed. The monkey was rewarded for reporting a motion direction change in the target stimulus with a button push, and for ignoring changes that occurred in the foil stimulus. B, 2-ADC model for change detection in a filtering task. Dashed black and gray circles, Decision variable distributions for changes at the target and foil locations, respectively. Thick green line, Decision boundary at baseline (before inactivation). The boundaries partition decision space into three nonoverlapping domains. In two of the domains, the animal chooses to report a change (Yes); in the third, it reports no change (No). C, Same as in B, but following SC inactivation. Thick solid blue line, Decision boundary following inactivation of the target location. Thin dashed blue line, Decision boundary following inactivation of the foil location. The decision boundary before inactivation is shown for reference (dashed thin green line). Dot-dashed black line, Contour of choice criteria corresponding to constant false-alarm rates during catch trials. D, Simulated percentage correct before (green) and during (blue) inactivation when the motion change occurred at the target location (red) and the target location was inactivated. E, Same as in D, but for inactivation of the foil location (yellow). F, Simulated error rates before and during simulated inactivation when the motion change occurred at the foil location (yellow) and the foil location was inactivated. G, Same as in F, but for inactivation of the target location (red). D–G, Crossed arrows, Location of change. Circle, Location of no change.
- Figure 10.
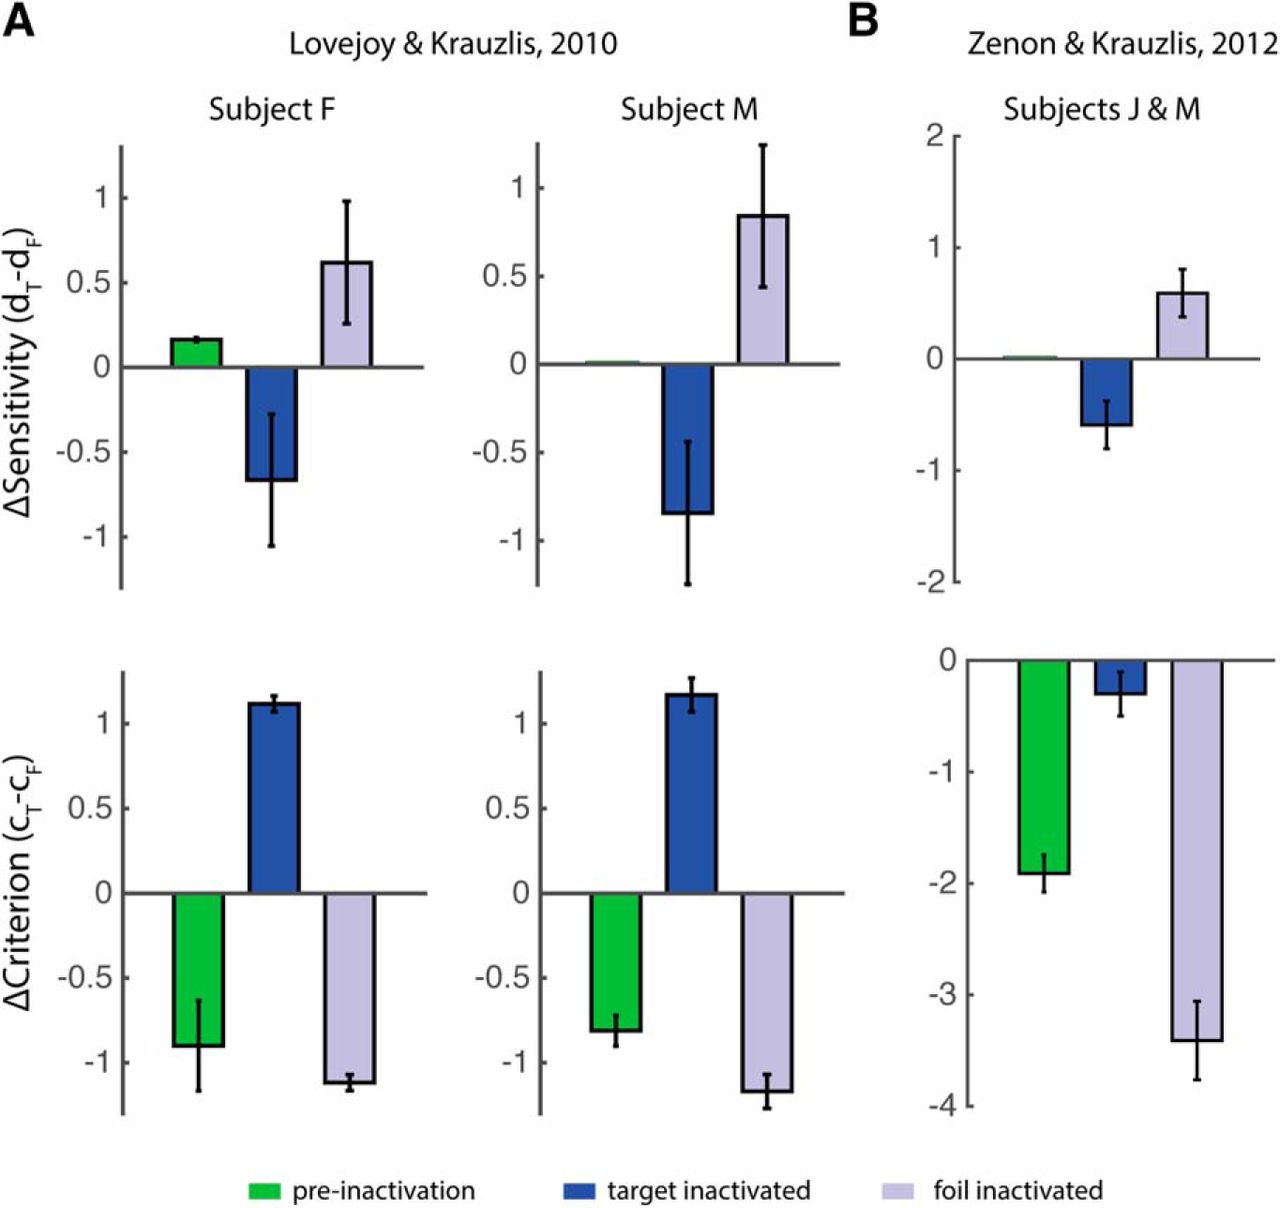
mADC model parameters fit to SC inactivation data (Lovejoy and Krauzlis, 2010; Zénon and Krauzlis, 2012). A, Top, Differences in sensitivity between the target and foil locations before SC inactivation (green) and during inactivation of the target (dark blue) or foil (light blue) spatial representations. Bottom, Differences in criteria between the target and foil locations. Other conventions are the same as in the top panel. Left, Data for subject F. Right, Data for subject M. Parameter estimates are based on fitting an 8-ADC-inact model to SC inactivation data from Lovejoy and Krauzlis (2010). Error bars denote SEs (jackknife) across experimental sessions (n = 7 for subject F; n = 4 for subject M). B, Same as in A, but based on fitting an 2-ADC-inact model to SC inactivation data from Zénon and Krauzlis (2012). Data were pooled across subjects J and M (n = 15 experimental sessions).
- Figure 11.
A schema for how sensitivity and bias mechanisms in the forebrain and midbrain interact to control visual spatial attention. Sensitivity (blue) and bias (red) mechanisms act along parallel, convergent neural pathways to enhance performance in spatial attention tasks. Cueing a location engages top-down mechanisms (e.g., from the frontoparietal network) that selectively enhance neural sensitivity to sensory evidence at the cued location (blue arrow). The enhancement is manifest in neural encoding in the visual cortex. At the same time, neural signals from the SC bias particular spatial locations by giving sensory evidence from these locations the greatest weight (red arrow). The SC spatial bias influences the animal's perceptual decisions by selectively gating (up/down weighting) the sensory evidence from different spatial locations to the decision process (evidence accumulator). Typically, the location of enhanced sensitivity (blue) and the location biased by the SC (red) are the same. The distinct contribution of each mechanism is revealed by experimental manipulations (such as SC stimulation or inactivation) that cause these mechanisms to favor different spatial locations, as shown in this schema.


Tables
- Table 1.
Model fits and parameters for 4-ADC target detection task: ML and Bayesian estimates of sensitivities and criteria (pooled data)
Parameter MLE (mean ± SE) Bayesian (mean ± SE) 95% CI Sensitivity d1 = 2.62 ± 0.08 d1 = 2.66 ± 0.06 d1: 2.50 − 2.77 d2 = 2.58 ± 0.08 d2 = 2.57 ± 0.09 d2: 2.44 − 2.70 d3 = 2.58 ± 0.05 d3 = 2.59 ± 0.06 d3: 2.52 − 2.67 d4 = 2.00 ± 0.05 d4 = 2.00 ± 0.05 d4: 1.94 − 2.07 Criterion c1 = 2.80 ± 0.07 c1 = 2.83 ± 0.08 c1: 2.70 − 2.93 c2 = 2.73 ± 0.07 c2 = 2.73 ± 0.08 c2: 2.63 − 2.84 c3 = 1.77 ± 0.03 c3 = 1.77 ± 0.04 c3: 1.72 − 1.83 c4 = 1.90 ± 0.03 c4 = 1.90 ± 0.04 c4: 1.85 − 1.95 Location 1, Upper right; location 2, upper left; location 3, lower left; location 4, lower right.
- Table 2.
Model fits and parameters for 4-ADC target detection task: MLEs of bias (pooled data)
MLE (mean ± SE) b1 = 0.020±0.009 b2 = 0.024±0.011 b3 = 0.289±0.068 b4 = 0.167±0.039 Location 1: upper right, 2: upper left, 3: lower left, 4: lower right.
- Table 3.
Model fits (goodness-of-fit statistics) for the target detection task, for individual birds
Bird identity All contingencies 8 of 25 contingencies χ2 pr(χ2) χ2 pr(χ2) Bird 1 14.90 0.717 19.18 0.467 Bird 2 24.14 0.234 98.10 (11.52) 0.002* (0.99) Bird 3 11.01 0.945 14.68 0.786 ↵*χ2 Values for model fits are inflated when several cells in the contingency table contain low (<5) response counts, resulting in apparently poor fits (small p). χ2 Statistics and p values computed with aggregated counts across nontarget locations for each stimulus contingency (see Materials and Methods) produced acceptable fits (values in parentheses).
Change (C) Response (R) 1 2 3 4 1 0.000b 0.143 0.714a 0.143 2 0.038 0.019b 0.057 0.887a 3 0.931a 0.035 0.000b 0.035 4 0.050 0.775a 0.175 0.000b Each entry corresponds to the proportion of Go responses at a location R (columns) when a salient change (largest rotation magnitudes, 70–90°, and the shortest flash durations, <200 ms) were presented at location C.
↵aProportion correct (hit rates), corresponding to proportion of Go responses to the location opposite to change (antisaccade task).
↵bProportion of Go responses to change location. The low probabilities in the other entries indicated that the monkey had learned the antisaccade rule, but some confusion persisted when reporting the change, indicated by the responses to the locations adjacent to the response location (italicized cells).
Change (C) Response (R) 1 2 3 4 1 0.005 0.065 0.859a 0.071 2 0.045 0.000 0.045 0.910a 3 0.921a 0.052 0.000 0.026 4 0.039 0.945a 0.006 0.011 ↵aUpon cueing (100% valid), asymptotic performance (for the most salient changes, as above) improved significantly (>90% correct, on average). Other conventions are the same as in Table 4.
- Table 6.
Model fits and parameter estimates for uncued four-alternative orientation-change detection task
Parameter MLE (mean ± SE) Sensitivity d1 = 1.60 ± 0.19 d2 = 0.87 ± 0.18 d3 = 1.02 ± 0.05 d4 = 0.82 ± 0.20 Criterion c1 = 2.17 ± 0.06 c2 = 1.71 ± 0.04 c3 = 0.13 ± 0.02 c4 = 1.44 ± 0.03 Bias b1 = 0.310 ± 0.072 b2 = 0.357 ± 0.080 b3 = 0.343 ± 0.077 b4 = 0.278 ± 0.066 Location 1, Upper right; location 2, upper left; location 3, lower left; location 4, lower right.
- Table 7.
Model fits and parameter estimates for cued four-alternative orientation-change detection task
Parameter MLE (mean ± SE) Sensitivity dR=1.60±0.19 dO=0.87 ± 0.18 dC=1.02 ± 0.05 dS=0.82 ± 0.20 Criterion cR=2.17±0.06 cO=1.71 ± 0.04 cC=0.13 ± 0.02 cS=1.44 ± 0.03 Bias bR=0.112±0.047 bO=0.330 ± 0.138 bC=1.477 ± 0.293 bS=0.427 ± 0.157 C, Cued location; R, location opposite cued location; S, same hemifield as cued location; O, diagonally opposite cued location.
Cue location All contingencies 8 of 25 contingencies χ2 pr(χ2) χ2 pr(χ2) Combined 23.31 0.28 29.30 0.093 Cue: location 1 29.08 (4.96) 0.127 (0.99) 79.96 (31.51) 0.003* (0.99) Cue: location 2 17.45 (0.29) 0.618 (0.99) 21.11 (2.15) 0.395 (0.99) Cue: location 3 56.29 (7.51) 0.007* (0.99) 83.32 (22.74) 0.000* (0.99) Cue: location 4 18.39 (0.95) 0.555 (0.99) 25.99 (6.44) 0.208 (0.99) ↵*Poor fits due to inflated χ2 values. Values in parentheses, χ2 Statistic and p values computed with counts aggregated across no-change response locations for each stimulus contingency (see Table 3, Materials and Methods).
- Table 9.
Model comparison based on AIC and BIC: four-alternative target detection task (chickens)
Model np df χ2 pr(pχ2) AIC BIC ΔAIC ΔBIC 4ADC 8 12 7.11 0.99 (0.85) 12222 12280 0 0 4ADC eq crit 5 15 415.7 0.00 (0.00) 12693 12730 471 450 4ADC eq sens 5 15 111.04 0.00 (0.00) 12318 12354 96 74 5AFC 9 11 16.22 0.69 (0.13) 12229 12295 7 15 np, Number of parameters; df, degrees of freedom; pr, p value (randomization test); pχ2, p value χ2 test; ΔAIC, AIC − AICmin; ΔBIC, BIC − BICmin.
- Table 10.
Model comparison based on AIC and BIC: four-alternative cued orientation-change detection task (monkey)
Model np df χ2 pr(pχ2) AIC BIC ΔAIC ΔBIC 4ADC 8 12 23.31 0.28 (0.03) 9422 9474 0 0 4-ADC eq crit 5 15 3864.6 0.00 (0.00) 12625 12658 3203 3184 4-ADC eq sens 5 15 33.73 0.04 (0.00) 9425 9458 3 −16 5AFC 9 11 21.09 0.40 (0.03) 9425 9484 3 10 Conventions are as in Table 9.
- Table 11.
Model comparison for SC inactivation data in a cued, motion direction discrimination task (Lovejoy and Krauzlis, 2010)
Model np Monkey F Monkey M AIC BIC AIC BIC 8-ADC-inact 12 5369.68a 5444.14 2592.30a 2656.59 8-ADC-inact sens-change 11 5389.73 5458.00 2595.64 2654.58 8-ADC-inact crit-change 10 5378.02 5440.09a 2594.70 2648.29a np, Number of parameters.
↵aModel with the lowest AIC or BIC value.
- Table 12.
Model comparison for SC inactivation data in a cued, motion change detection task (Zénon and Krauzlis, 2012)
Model np AIC BIC 2-ADC-inact 8 4999.82a 5053.79 2-ADC-inact sens-change 6 5042.33 5082.82 2-ADC-inact crit-change 6 5003.01 5043.49a Conventions are as in Table 11.


