

Abstract
Electrically stimulating early visual cortex results in a visual percept known as a phosphene. Although phosphenes can be evoked by a wide range of electrode sizes and current amplitudes, they are invariably described as small. To better understand this observation, we electrically stimulated 93 electrodes implanted in the visual cortex of 13 human subjects who reported phosphene size while stimulation current was varied. Phosphene size increased as the stimulation current was initially raised above threshold, but then rapidly reached saturation. Phosphene size also depended on the location of the stimulated site, with size increasing with distance from the foveal representation. We developed a model relating phosphene size to the amount of activated cortex and its location within the retinotopic map. First, a sigmoidal curve was used to predict the amount of activated cortex at a given current. Second, the amount of active cortex was converted to degrees of visual angle by multiplying by the inverse cortical magnification factor for that retinotopic location. This simple model accurately predicted phosphene size for a broad range of stimulation currents and cortical locations. The unexpected saturation in phosphene sizes suggests that the functional architecture of cerebral cortex may impose fundamental restrictions on the spread of artificially evoked activity and this may be an important consideration in the design of cortical prosthetic devices.
SIGNIFICANCE STATEMENT Understanding the neural basis for phosphenes, the visual percepts created by electrical stimulation of visual cortex, is fundamental to the development of a visual cortical prosthetic. Our experiments in human subjects implanted with electrodes over visual cortex show that it is the activity of a large population of cells spread out across several millimeters of tissue that supports the perception of a phosphene. In addition, we describe an important feature of the production of phosphenes by electrical stimulation: phosphene size saturates at a relatively low current level. This finding implies that, with current methods, visual prosthetics will have a limited dynamic range available to control the production of spatial forms and that more advanced stimulation methods may be required.
- direct cortical stimulation
- electrical brain stimulation
- electrical stimulation
- magnification factor
- phosphene
- visual cortex
Introduction
Electrical stimulation of the occipital lobe produces the perception of small flashes of light known as phosphenes. Although it has long been recognized that phosphenes could be used to create a visual cortical prosthetic (VCP) (for review, see Lewis and Rosenfeld, 2016), our understanding of how the parameters used for electrical stimulation relate to subjects' percepts remains poor. In this study, we focus on the location and size of perceived phosphenes because, ultimately, these are the key attributes that will allow phosphenes produced by stimulation of multiple electrodes to be combined into useful visual forms, which is akin to using pixels to make forms on a computer display.
The earliest reports of the phosphenes that result from electrical stimulation of primary visual cortex (V1) were largely qualitative in nature and indicated that the subjects perceived something that was small and punctate, “like a star in the sky” (Brindley and Lewin, 1968; Dobelle and Mladejovsky, 1974). Because of the apparent uniformity of phosphenes, it was even suggested that they might result from the activation of a particular class of cells that were sparsely distributed in the visual cortex (Bartlett and Doty, 1980). However, these early reports also provided clues that the size of phosphenes changed with eccentricity, with size increasing with distance from the foveal representation (Brindley and Lewin, 1968). Although human subjects are readily able to deliver precise reports of phosphene size, the relationship between phosphene size and stimulation parameters has been reported in only one previous study (Winawer and Parvizi, 2016).
Although nonhuman primates cannot report directly the size of phosphenes, studies using indirect reporting methods have shown that phosphene size increases with the eccentricity of the stimulation site and the magnitude of the stimulation current (Tehovnik et al., 2004; Tehovnik et al., 2005b; Tehovnik et al., 2005a; Tehovnik and Slocum, 2007a, 2007b, 2007c). These studies suggest that differences in the cortical magnification factor (CMF) at different eccentricities within the map of visual space can largely account for the observed change in phosphene size with eccentricity (Tehovnik et al., 2005a; Tehovnik and Slocum, 2007b, 2007c), and that a simple equation can be used to predict the amount of visual cortex directly activated by a particular stimulation current, and the size of the resulting phosphene (Tehovnik et al., 2004; Tehovnik et al., 2006; Tehovnik and Slocum, 2007a, 2007b, 2007c).
Overall, results from nonhuman primate experiments suggest that phosphene size can be understood by combining an estimate of the diameter of the cortical activity evoked by the stimulation with an estimate of the CMF. However, what remains to be established is whether these results will hold when a larger range of eccentricities and currents are sampled and when phosphene size is reported directly by human subjects. For example, it is not clear whether the large CMFs found in human V1 and variations in CMF with eccentricity can account for the small phosphenes commonly reported by human observers.
Here, we take advantage of the unique access to the visual cortex that is possible in a subset of human epilepsy patients. We measure the size of phosphenes produced by stimulation of electrodes that lie in different parts of the map of visual space (different eccentricities) and by stimulation of the same electrodes at different current levels. We find that phosphene size varies with eccentricity and with the magnitude of stimulation current, as expected, but, somewhat surprisingly, we find that phosphenes saturate in size when currents a small amount above threshold for phosphene production are used. By limiting our investigation to a single stimulation parameter (current amplitude) and to only two attributes of the perceived phosphenes (location and size), we were able to examine explicitly the hypothesis that activation of limited regions of the map of visual space in V1 can explain phosphene size. We use our results to create a simple model that successfully accounts for most of the variance that we observe in phosphene size.
Materials and Methods
Subjects.
Electrical stimulation was conducted in patients (n = 15; 10 female, 5 male; mean age = 35.5 years, range = 22–61 years) with medically intractable epilepsy who had subdural electrodes implanted over various regions of the cortex for clinical purposes. Informed consent was obtained from all subjects and the Baylor College of Medicine Institutional Review Board approved all procedures. The patients were typically kept in the epilepsy-monitoring unit for 4–14 d after the electrodes were implanted. Clinical monitoring continued uninterrupted during experimental sessions, which typically took place on first through fourth days after implantation. All subjects tested had normal or corrected to normal vision in the visual fields that were studied.
Electrodes.
Although a variety of electrode types were implanted for clinical purposes, the only electrodes used for electrical stimulation in this study were research electrodes (platinum, 0.5 mm diameter) embedded in custom SILASTIC strips (PMT). These custom strips were fabricated with the research electrodes positioned in the normally empty space between the larger standard clinical recording electrodes (platinum, 2.2 mm diameter, 1 cm spacing).
The electrodes used in this study were located on subdural strips that extended over the occipital cortex (Fig. 1A,B). For clinical purposes, a number of surface electrode strips are typically deployed at the margins of the craniotomy used for grid placement. These strip electrodes allow for additional clinical sampling of the brain in regions outside of the primary area of interest (covered by the grid) and help to rule out the possibility of an unexpected source of epileptic activity. For all subjects in the present study, no epileptic activity was observed from electrodes at or near the occipital pole.
The area near the occipital pole and surrounding the calcarine fissure is known to correspond to V1 and other early visual cortical areas (V2, V3). Up to 16 electrodes located over this area were tested in each hemisphere. The typical arrangement of electrodes consisted of 4 research electrodes spaced at 4–6 mm apart surrounding each of the first 4 clinical recording electrodes for a total of 16 electrodes (Fig. 1A). In some subjects, a slightly different arrangement of research electrodes was used, but in all cases, only research electrodes of the same type and diameter (0.5 mm) were used for electrical stimulation.
Electrical stimulation general.
During all experiments, the patients remained seated comfortably in their hospital bed. A ground pad was adhered to the patient's thigh and all electrical stimulation was monopolar, with the ground pad connected to both the ground and return ports on the stimulator. Electrical stimulation currents were generated using a 16-channel system (AlphaLab SnR; Alpha Omega) controlled by custom code written in MATLAB (version 2013b; The MathWorks).
We first screened all electrodes to determine those sites that produced a phosphene when electrical stimulation was delivered. For this study, a phosphene is defined as a localized, brief, visual percept (commonly described as a flash of light). For each electrode, we typically began with a low current (0.3–1.0 mA) and gradually increased current on each trial until the patient reported a phosphene. If no phosphene was obtained with a current of 4 mA, then the site was considered unresponsive. A maximum of 4 mA was used and the number of stimulation trials was limited to maximize efficient use of time and to limit the possibility of evoking seizures in our subjects. After screening, we conducted more detailed studies using different stimulation currents and interactive mapping of the size and location of the resulting phosphenes.
During each stimulation trial, an auditory warning tone cued the patients to fix their gaze on a small cross on the touchscreen (Fig. 1D). This was followed by a second tone that indicated the beginning of the actual electrical stimulation period. Electrical stimulation consisting of a train of biphasic pulses (−/+) with 0.1 ms pulse duration per phase was then delivered at a frequency of 200 Hz, with an overall stimulus train duration of 200 or 300 ms (Fig. 1E,F). Currents tested ranged from 0.3 to 4.0 mA, resulting in a total charge delivered of 1.2–24 μC per trial. When multiple currents were tested for one electrode, currents were tested in a pseudorandom sequence that had been preselected by the investigators. Subjects were unaware of the current being used on any individual trial. Catch trials with no current delivered were interleaved with the actual electrical stimulation trials and confirmed that the subjects were responding to a visual percept resulting from the stimulation and not just to the auditory cues.
Reliability of phosphene size was examined in 12 of the 15 subjects. Receptive field (RF) versus phosphene location was examined in 13 of the 15 subjects. For the main study, examining the relationship between phosphene size and the parameters of eccentricity and electrical stimulation current, we screened 152 electrodes from 14 patients. In 13 of those patients, we sampled from only one hemisphere; in the remaining patient, we were able to sample from electrodes in both hemispheres. We found that electrical stimulation of 113 (74.3%) of the electrodes produced single phosphenes that were easy to localize and full testing with repeated trials was conducted using 93 electrodes from 13 subjects (Fig. 1G–I).
RF mapping.
Our RF mapping procedure has been described previously in detail (Yoshor et al., 2007). Briefly, subjects performed a letter detection task at a central fixation point while checkerboard stimuli were flashed in various locations on the screen. In this study, the root mean square (RMS) deviation from the mean voltage during a poststimulus time window of 100–300 ms was used as the measure of response for each stimulus position. To make RF maps, we fit a 2D Gaussian function to the RMS responses for all of the sampled positions in visual space. RF width was determined by averaging the full width at half height for each of the two axes from the fitted Gaussian.
Phosphene mapping.
Our phosphene mapping technique is illustrated in Figure 1C. Patients viewed an LCD touchscreen that was typically located 57 cm in front of them. The patient fixated on a cross on the display and electrical stimulation was administered after an auditory warning tone. Patients indicated whether they saw anything by verbal report and then drew the outline of the visual percept (phosphene) using a stylus on the touchscreen (n = 28 electrodes from three subjects) or by using a pencil to draw on a sheet of paper affixed to a monitor at the same viewing distance (n = 65 electrodes from 10 subjects).
When using the touchscreen, multiple trials were typically conducted to allow the patients to adjust the size and location of the outline precisely. The subject was instructed to draw the shape as accurately as possible after the first stimulation trial and then, on subsequent trials, they adjusted the scaling and location of the contour using a custom-designed graphical user interface until it corresponded well to the phosphene that they perceived. We instructed subjects in the use of the graphical user interface, but decisions about how to depict phosphenes graphically were made entirely by the subjects without interference. If the patient described a phosphene as a contiguous area that contained inhomogeneous elements, then they were instructed to outline the entire area and this was treated as a single phosphene. This was done because we were testing the idea that the amount of cortex activated in V1 is correlated with the overall size of the visual percept. Electrodes that generated two completely distinct phosphenes (possibly representing an electrode spanning a sulcus) were encountered rarely (4/119) and were excluded from further testing and analysis.
In cases in which phosphene drawings were made on paper, all procedures were the same except that a small cross was drawn on the paper for the subject to fixate on. Multiple trials were obtained using separate pieces of paper and were then averaged to obtain final phosphene sizes in most cases. Major results for our study were similar when using data from phosphenes that were drawn on paper and those that were drawn on the touchscreen (phosphene size vs eccentricity Pearson correlation: paper 0.83, touchscreen 0.74, combined 0.78; predicted phosphene size vs actual phosphene size Spearman correlation: paper 0.89, touchscreen 0.90, combined 0.90), so these two groups were combined for all analyses.
Analysis of phosphene maps.
All phosphene drawings on the touchscreen were ellipses and all phosphene drawings made on paper were fit with an ellipse. The center of the best-fit ellipse was taken as the center of the phosphene. We used (major diameter + minor diameter)/2 as the measure of phosphene size. Phosphene size in degrees of visual space was calculated by using the standard formula for calculating visual angles: V = 2 * ATAN(S/2D), where V is the visual angle in degrees, S is the size of the object or stimulus in question, and D is the viewing distance. In our case: PSdeg = 2 * ATAN(PScm/2D), where PDdeg is the size of the phosphene in degrees of visual space, PScm is size of the phosphene drawn on the screen in centimeters, and D is the distance from the eye to the screen in cm. For our typical screen distance of 57 cm, this resulted in 1 cm on the screen being equal to 1° of visual angle. The distance of the phosphene center from the fixation point (cm) was used to determine the eccentricity of the stimulation site (°) by multiplying by the same conversion factor (1°/cm).
Analysis of phosphene location versus RF location.
Phosphene location was compared with RF location for electrodes from 13 cases. For this analysis, we included all electrodes that reliably generated single phosphenes when electrically stimulated, had well defined RF maps with only one responsive region of visual space, and represented a region of visual space with an eccentricity of >2° (n = 59). Electrodes with foveal (<2° eccentricity) RF locations were excluded because of the small size of both the RFs and phosphenes. Coordinates of both RFs and phosphenes were first converted to polar coordinates (eccentricity, polar angle) before quantitative comparisons.
Analysis of phosphene size versus current.
Phosphene size versus current was examined quantitatively for each electrode for which we had sampled four or more current amplitudes (n = 10 electrodes from 3 subjects). Phosphene size versus current curves were well fit by a sigmoidal function for seven of the 10 electrodes (for examples, see Fig. 2A–C). To further quantify saturation in phosphene size, all 10 of the phosphene size versus current curves were first normalized by setting the maximum size obtained for any current sampled to 1.0 (Fig. 2D). We calculated the slope, or rate of change in phosphene size, between all possible pairs of adjacent points on each of the 10 normalized curves (Fig. 2E). We then determined the average slope for low (<1.5 mA), medium (1.5–1.75 mA), and high (>1.75 mA) current ranges (Fig. 2F).
Electrode localization.
Electrode placements were guided solely by clinical criteria. Before electrode implantation surgery, two T1-weighted structural magnetic resonance (MR) scans were obtained. The two scans were aligned and averaged to provide maximum gray–white contrast using Analysis of Functional NeuroImages software (AFNI) (Cox, 1996). Cortical surface models were constructed using the program FreeSurfer (Dale et al., 1999; Fischl et al., 1999) and visualized using the SUMA component of AFNI (Argall et al., 2006). After electrode implantation surgery, subjects underwent whole-head computed tomography (CT). The CT scan was aligned to the presurgical MR scan using AFNI and all electrode positions were marked manually on the structural MR images. Subsequently, the electrode positions were assigned to the nearest node on the cortical surface model using AFNI.
To illustrate the electrode sites used to evaluate phosphene size versus stimulation current and eccentricity, we converted electrode locations defined in original coordinates from each subject to Talaraich coordinates and presented them over a standard brain in Talaraich space (the TT_N27 standardized brain distributed with AFNI) for 88 of the 93 electrodes used for final analyses (Fig. 1G–I). The necessary imaging data required for electrode alignment were not available for five electrodes from one case.
Model.
Our model for prediction of phosphene size consists of two parts. The first part predicts the spread of cortical activity based on electrical current using a sigmoidal function (Eq. 1) and the second part predicts cortical magnification factor using a previously published equation (Eq. 2) (Horton and Hoyt, 1991; Dougherty et al., 2003). Finally, the diameter of activated cortex is multiplied by the inverse magnification factor to predict phosphene size (Eq. 3) as follows:
 Where AC is the diameter of activated cortex (mm), MD is the predicted maximum diameter of activated cortex fixed at 5.3 mm across all cases, slope is the maximum slope for increase in diameter of activity with increase in current fixed at 5.85 mm/mA, I50 is the current at which half of the saturation value is reached (mA) fit for each case, and I is the current used for stimulation (mA).
 Where M is the linear cortical magnification factor (mm/°), Ecc is the eccentricity (°), e2 is the eccentricity at which M falls to half of foveal value fixed at 3.67°, and A is the cortical scaling factor fit between 15 and 45 for each case.
 Where PS is phosphene size (°), AC is the diameter of activated cortex (mm), and M is the linear cortical magnification factor (mm/°).
We compare our results with those obtained in a series of experiments in which electrical stimulation was used to alter the execution of saccades made by macaque monkeys. In those experiments, the direct activation of cortex resulting from electrical stimulation was predicted using Equation 4 (Stoney et al., 1968; Tehovnik and Slocum, 2007b, 2007c).
 Where R is the radius of cortex activated (mm), I is the current (μA), and K is the current/distance constant (μA/mm2).
Explanation of model parameters and fitting procedure.
A sigmoidal function was used to predict cortical activation based on the results of our phosphene size versus current testing. The maximum slope of this function was set at 5.85 mm/mA based on examination of data from the electrodes for which we had sigmoidal fits for size versus current (7 electrodes from 3 subjects) and was held constant at this value for all cases. The current at which the spread of activity in cortex is at half of maximum, I50, was a free parameter that was fit separately for each hemisphere and was allowed to vary between 0.4 and 1.6 mA. MD was not measured directly in our experiments. It is a parameter of our model that we estimated, but then held constant across all cases (explained further below). This was done to help reduce the number of free variables for fitting the model on each case.
We used a previously published equation to determine inverse cortical magnification factor (1/M) based on eccentricity (Horton and Hoyt, 1991). We constrained the parameters for this equation by examining data from human fMRI experiments (Dougherty et al., 2003). The parameter e2, which specifies the eccentricity at which the magnification factor has fallen to half of the value found at the foveal representation, was held constant at a value of 3.67°. The cortical scaling factor, A, was a free parameter that was allowed to vary between 15 and 45 for each hemisphere. This range allows for the large variations in visual field mapping that are found from subject to subject (Dougherty et al., 2003; Harvey and Dumoulin, 2011). In three cases in which the range of eccentricities sampled was <3°, the value of A was set at 29, the approximate mean for human subjects (Dougherty et al., 2003), because there was insufficient information to estimate visual field mapping parameters in those cases.
In summary, there were only three parameters that were allowed to vary in our model (MD, A, I50). To fit these parameters, we varied MD from 1 to 16 mm in steps of 0.1 mm. For each value of MD tested, the best values of A and I50 were then determined for each case by minimizing the sum of the squared error between the actual and predicted phosphene sizes for that case. Then data were combined from all cases to determine the overall ability of the model to predict phosphene size. The value of MD that resulted in the largest correlation between predicted and actual phosphene size (Pearson correlation) was selected as the final value for that parameter (5.3 mm).
Results
We performed electrical stimulation of electrodes (Fig. 1A) implanted over the surface of early visual cortex (Fig. 1B). As reported previously, subjects perceived phosphenes that were easily localized with use of relatively small electrical currents (Murphey et al., 2009). We characterized phosphenes quantitatively from 15 subjects by having the subjects draw the outline of the phosphenes that they perceived (Fig. 1C).

Methods for electrical stimulation of visual cortex. A, Custom electrode strips used in our subjects. The research electrodes used for electrical stimulation were 0.5 mm in diameter and were arranged in a 4 × 6 mm rectangle surrounding each of the first four clinical recording electrodes on the strip. B, Posterior–medial view of the occipital portion of the left hemisphere of one brain showing the typical placement of one of the hybrid strips. The strip wraps around the occipital pole and extends into the interhemispheric fissure. C, Method for mapping phosphenes. Subjects fixated a cross on a touchscreen monitor while electrical stimulation was delivered and then drew the outline of the phosphene they perceived using a stylus. D, Timing of the phosphene drawing task. An auditory tone was delivered to warn the subject of the upcoming trial and to remind them to fixate the cross in the center of the screen. Then, a second auditory tone was played and the electrical stimulus train began. After the stimulus train, the subject was free to draw the outline of the phosphene they perceived and this continued for a variable amount of time. E, Structure of the electrical stimulus train. The pulse frequency was 200 Hz and the overall duration of the stimulus train was 200 ms. F, Pulse waveform used. Biphasic pulses (−/+) were used with 0.1 ms duration per phase. G–I, Location of electrodes (red symbols) used for electrical stimulation from all subjects aligned to Talaraich coordinates and displayed on a standard brain. G, Left hemisphere electrodes that were located on the medial wall of the occipital cortex. H, Right hemisphere electrodes located on the medial wall of occipital cortex. I, Left and right hemisphere electrodes located on the occipital pole and lateral occipital cortex.
Reliability of the subjects reports of phosphene size and location with electrical stimulation of the same electrode at the same current amplitude was tested using three to eight trials for 67 electrodes from 12 subjects. The group mean phosphene diameter was 1.65° and mean the SD in phosphene diameter across trials was 0.26°, confirming excellent reliability.
We would expect that the phosphenes generated by electrical stimulation would overlap the RF locations for the corresponding electrodes. This was analyzed using data from 59 electrodes from 13 subjects (Fig. 2). When RF and phosphene locations were both plotted using polar coordinates, we found that both the eccentricity (Fig. 2A) and polar angle (Fig. 2B) were well correlated.

Phosphene location versus RF location. A, Phosphene eccentricity versus RF eccentricity. Square symbols show the actual data; black line indicates linear regression [Pearson r = 0.90, p < 0.001, 95% confidence interval (CI) = 0.84 to 0.93; Spearman r = 0.86, p < 0.001, 95% CI = 0.77 to 0.92]. B, Phosphene polar angle versus RF polar angle. Square symbols show the actual data; black line indicates linear regression (Pearson r = 0.98, p < 0.001, 95% CI = 0.96 to 0.99; Spearman r = 0.86, p < 0.001, 95% CI = 0.74 to 0.93).
We quantitatively characterized how phosphene size varied with current amplitude and eccentricity using data obtained from 93 selected electrodes from 13 patients (Fig. 1G–I). Overall, the phosphenes produced by electrical stimulation across all electrodes sampled varied in diameter by about two orders of magnitude (0.13–10.8°; see Fig. 5D) and two parameters appeared to account for much of this variation.
First, phosphene size increased with an increase in the amplitude of the stimulation current. To examine this, we had subjects draw the phosphenes that they observed as we varied the current magnitude that was delivered to individual electrodes while holding all other stimulus parameters constant. We found that, as current was increased above the threshold for detection (mean threshold 0.81 mA), there was a rapid increase in the size of phosphenes perceived and drawn by the subjects (three examples from three different subjects are shown in Fig. 3A–C). Unexpectedly, however, we found that this relationship quickly reached a plateau as the current was increased further. Fitting with a sigmoidal function showed that, on average, 90% of the maximum phosphene size was reached at a mean current level of 1.4 mA (n = 7 electrodes from 3 subjects; Fig. 3A–C, black lines). The maximum phosphene size obtained averaged 3.1 times larger than the minimum phosphene size evoked by near-threshold stimulation.

Phosphene size versus electrical current amplitude. A, Phosphene size tested for six different electrical currents using one electrode (red circle, inset) located near the occipital pole in one subject. L, Lateral; S, superior; A, anterior. Square symbols show the actual data; black line shows a sigmoidal function fit to the data (Pearson correlation r = 0.98, p < 0.001). B, Phosphene size tested for four different currents using one electrode located in the interhemispheric fissure in a different subject (Pearson correlation r = 0.99, p = 0.01). C, Phosphene size tested for four different currents using one electrode located near the occipital pole in a third subject (Pearson correlation r = 0.98, p = 0.02). D, Normalized phosphene size versus current curves for all electrodes that had a low threshold for producing phosphenes and for which multiple currents were tested. E, Slope, or rate of change in the phosphene size versus current curves, examined for all adjacent pairs of samples on the curves shown in D. For each pair, the slope is calculated as change in phosphene size (in normalized units from D) divided by the change in current (mA) and the data point is shown at the average current for the pair. Data points are shaded to show three different regions: low currents (I < 1.5 mA; dark shading), medium currents (I = 1.5–1.75 mA; medium shading), and high currents (I > 1.75; light shading). F, Average slope of phosphene size versus current curve for low (dark-shaded bar), medium (medium-shaded bar), and high (light-shaded bar) currents determined by averaging the three data groups shown in E.
This saturation effect was observed consistently and was not an artifact of the fitting procedure. To further test this, we examined the phosphene size versus current curves, normalized to have equal maximum phosphene sizes, for all electrodes that had low thresholds and sampling of four or more currents (n = 10 electrodes from three subjects; Fig. 3D). We then calculated the slope, or rate of change in phosphene size, between all possible adjacent data points on each of the 10 size versus current curves (Fig. 3E). Because this analysis was performed on the normalized data from Figure 3D, the units for the slope are arbitrary units per an increase of 1 mA in current. This analysis revealed that the rate of change in phosphene size averaged 1.11/mA for low currents (I < 1.5 mA, n = 14, mean = 0.82 mA), was only 0.28/mA for medium currents (I = 1.5–1.75 mA, n = 10, mean = 1.58 mA), and was 0.00/mA for higher currents (I > 1.75 mA, n = 16, mean = 2.77 mA) (Fig. 3F). In other words, the phosphene size versus current function was essentially flat beyond 2 mA on average. Note that we sampled two currents well beyond the saturation point in each of the examples shown (Fig. 3A–C), so the maximum current setting of 4 mA that was used for reasons of patient safety did not impair our ability to observe saturation. In addition, subjects were entirely unaware of the current level on each trial and different current levels were tested in arbitrary sequences, so that the saturation effect cannot be attributed to behavioral or neural habituation or accumulated charge deposition on the electrodes.
The second major factor affecting phosphene size was location of the electrode in the map of visual space. This was examined by analyzing the phosphenes that resulted from electrical stimulation of different electrodes in the same subject while holding all stimulation parameters constant. For each electrode, eccentricity was defined by measuring the distance of the center of the phosphene from the fixation point and converting to degrees of visual space (see Materials and Methods for more details). We found that at identical stimulation currents, electrodes located near the representation of the fovea (0–2° eccentricity), produced smaller phosphenes than electrodes in more peripheral locations (three examples from three different cases are shown in Fig. 4A–C). The same linear relationship for phosphene size versus eccentricity was found when we combined the data from all electrodes from all subjects for which samples were obtained at currents near 1 mA (0.8–1.2 mA range; n = 42 electrodes from 8 subjects; Fig. 4D).

Phosphene size versus eccentricity. A, Phosphene size versus eccentricity plotted using data from 6 electrodes in one subject (current = 2 mA). Black line indicates linear regression [Pearson r = 0.89, p = 0.017, 95% confidence interval (CI) = −0.38 to 0.98; Spearman r = 0.83, p = 0.058, 95% CI = 0.0 to 1.0]. Data points are colored to indicate the location of the corresponding electrode on the occipital cortex (inset). Dashed line indicates location of calcarine fissure. B, Phosphene sizes measured for 7 different electrodes in a second subject (current = 1 mA; Pearson r = 0.87, p = 0.01, 95% CI = 0.66 to 0.97; Spearman r = 1, p < 0.001, 95% CI = 1.0 to 1.0). C, Phosphene sizes measured for 8 different electrodes in a third subject (current ∼ = 1 mA; Pearson r = 0.98, p < 0.001, 95% CI = 0.31 to 1.0; Spearman r = 0.83, p = 0.015, 95% CI = 0.54 to 1.0). D, Group data for phosphene size versus eccentricity. Data were pooled from all electrodes for which we sampled with a current near 1 mA (n = 42 electrodes; 0.8–1.2 mA). Black line indicates linear regression (Pearson r = 0.89, p < 0.001, 95% CI = 0.76 to 0.94; Spearman r = 0.80, p < 0.001, 95% CI = 0.57 to 0.92).
We developed a simple computational model to predict phosphene size by combining stimulation current and electrode eccentricity (Fig. 5). In the first part of our model, the diameter of visual cortex activated for a particular level of current is estimated by using a sigmoidal activation curve (Fig. 5A, Eq. 1). The sigmoidal curve is used to account for the saturation in phosphene size that we observed at higher currents (Fig. 3). One parameter, the current that produces half of the maximum phosphene size (I50), was estimated separately using the data from each hemisphere. The maximum slope (5.85°/mA) of the sigmoidal curve was held constant for all cases. We tested different values for MD, but, once established, this parameter was then held constant across cases.
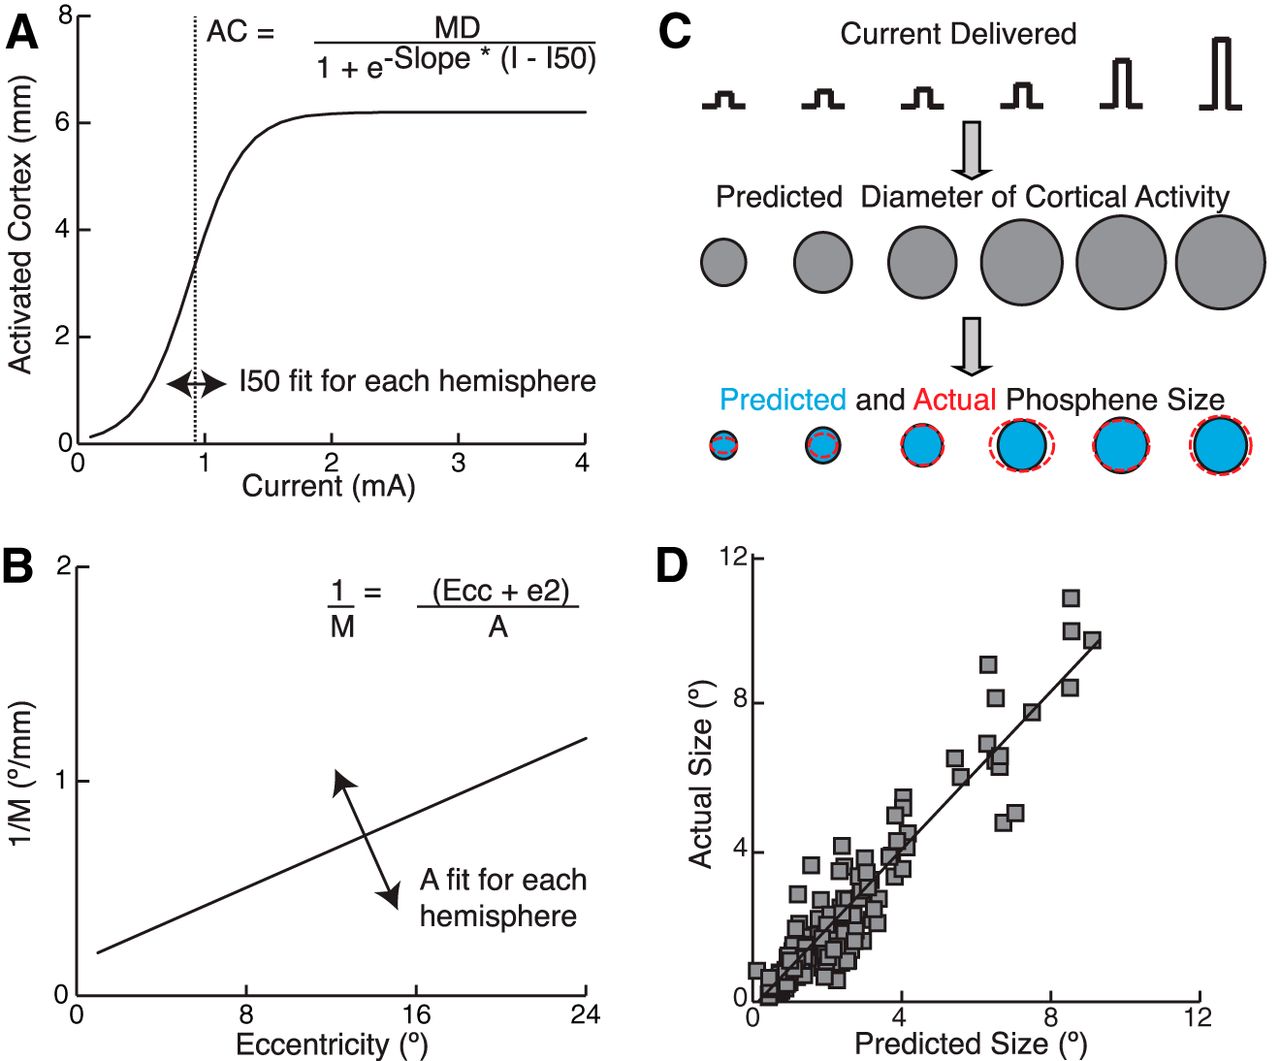
Model for determining phosphene size. Our model predicts phosphene size by combining an estimate of spread of activity in visual cortex with an estimate of inverse cortical magnification factor. A, Sigmoidal function used to predict the diameter of visual cortex activated based on the electrical current delivered. B, Linear function used to determine magnification factor based on eccentricity (Horton and Hoyt, 1991). C, Schematic indicating the predicted spread of activity in visual cortex when a sample electrode is stimulated with six current levels. The predicted phosphene size (blue filled circles) was compared with the actual phosphene outlines for the same currents (red dashed ellipses). D, Performance of model. Predicted phosphene size versus actual phosphene size for data from all current levels using all electrodes tested in all subjects (n = 153 observations from 93 electrodes in 13 subjects). The black line indicates the linear regression [Pearson r = 0.94, p < 0.001, 95% confidence interval (CI) = 0.91 to 0.96; Spearman r = 0.90, p < 0.001, 95% CI = 0.86 to 0.94].
In the second part of our model, the inverse CMF is estimated based on the location of the electrode within the map of visual space (Fig. 5B, Eq. 2) using a previously published equation (Horton and Hoyt, 1991). One parameter, the cortical scaling factor (A), was fit for each hemisphere examined and the allowable range was based on examination of data from human fMRI experiments (Dougherty et al., 2003). This allowed for the large subject-to-subject differences in visual field mapping that have been demonstrated by fMRI experiments in humans (Dougherty et al., 2003; Harvey and Dumoulin, 2011). The other parameter, the eccentricity at which the CMF has fallen to half of that found at the foveal representation (e2), was held constant based on published data from the same study (Dougherty et al., 2003).
The final step in the model is to simply multiply the predicted diameter of activated cortex (mm) by the predicted inverse CMF (°/mm) to obtain the predicted phosphene size (°) (Eq. 3). The predicted phosphene size generated by our model (Fig. 5C, blue filled circles) was then compared with the size of the phosphenes drawn by the subject (Fig. 5C, red dashed ellipses). Applying this model to phosphenes generated from stimulation of all electrodes from 13 hemispheres showed that it accounted for 88.8% of the variance in phosphene size (Fig. 5D).
We found that the best model performance was obtained by setting MD = 5.3 mm (r = 0.9421). With this value for MD, the mean value for A across cases was found to be 29.8 and the mean I50 was 0.89 mA. Note that the mean value of A used in our model to best predict phosphene size is very close to the mean value found for this parameter in human fMRI experiments (29.2) (Dougherty et al., 2003). The mean value for I50 is just above the mean current threshold for detection of phosphenes (0.81 mA).
A range of values between ∼5–6 mm for MD also results in excellent ability to predict phosphene sizes (r ≥ 0.94) and mean values for A and I50 that are very reasonable. Values of MD in the range of 3–5 mm or 6–10 mm still results in good but slightly suboptimal model performance (r > 0.91). However, values of MD < 3 mm or MD > 10 mm result in poor prediction capability of the model (r < 0.83) not different from using eccentricity of the stimulation site alone to predict phosphene size (r = 0.81) and mean values for A and I50 that are either unreasonably low or high.
Discussion
Summary
Human subjects implanted with subdural electrodes reported the size of phosphenes created by electrical stimulation of V1. Phosphenes generated by stimulation of a single electrode at a constant current were reliable in size and had a location consistent with the measured RF. As predicted from work in nonhuman primates, we observed an increase in phosphene size with both increases in eccentricity of the stimulation site and increases in the magnitude of the stimulation current. Unexpectedly, we also found that phosphene size saturates at moderate current amplitudes and showed that incorporating this feature into a simple model can explain most of the observed variance in phosphene size. Overall, we found that phosphene sizes can be explained based on focal activation of a region of the map of visual space in early visual cortical areas (Fig. 6).

Relationship between predicted cortical activity and behavior. A, Schematic showing the map of visual space on a flattened human V1 (Horton and Hoyt, 1991). The circles indicate the area of cortex that we predict would be active in our experiments when subjects are stimulated at three different points in the map of visual space with a near threshold current (0.8 mA; 2 mm diameter activation; red circle = 1°, blue circle = 7.5°, green circle = 20°) and at two higher currents (1 mA-3.5 mm diameter activation; 2 mA-5.3 mm diameter activation, open circles). Note that the predicted diameter of activation in V1 is the same at the three eccentricities shown, but the magnification factor changes substantially. Also note that the predicted diameter of activated cortex is the same for any current >2 mA. B, Phosphene location and size predicted for electrical stimulation at each of the sites shown in A. Phosphenes increase in size with both eccentricity and current. C, Predicted cortical activation during nonhuman primate execution of saccades after electrical stimulation (based on Tehovnik et al., 2005a; Tehovnik and Slocum, 2007b). The schematic indicates the map of visual space on a flattened macaque V1. For simplicity, the macaque map is a scaled replica of the map of visual space shown for human V1. The colored circles indicate the ∼750 μm diameter activation area that is predicted using 100 μA and Equation 4 with K = 675. Again, the predicted activation diameter in V1 is the same at the two eccentricities shown, but the magnification factor changes. The inset to the right of the full map of V1 shows an expanded view of the region between 2.5° and 5° eccentricities for one sector of the map. D, Size of saccade delay fields based on the cortical activation at the two eccentricities shown in A. The delay field predicted for stimulation of the site at 4° eccentricity is larger due to the larger inverse magnification factor at this site.
Phosphene size versus eccentricity
We have demonstrated a strong correlation between phosphene size and eccentricity that holds across a wide range of eccentricities. Early investigations using human subjects had suggested that phosphenes from electrodes located in the representation of the periphery might be larger (Brindley and Lewin, 1968; Dobelle and Mladejovsky, 1974), but there has been very little quantitative examination of this effect (Winawer and Parvizi, 2016).
Stronger evidence for change in phosphene size with eccentricity was provided by experiments in nonhuman primates (Tehovnik et al., 2005a; Tehovnik and Slocum, 2007b, 2007c). In those experiments, electrical stimulation of sites in V1 delayed the execution of a subsequent saccade to a visual target and the size of these “delay fields” varied reliably with eccentricity. A limited set of more direct measurements was obtained later by having the animals compare the size of a phosphene with the size of a visual stimulus in a 2AFC task (Schiller et al., 2011).
Several important attributes of the functional organization of visual cortex, including RF size and CMF, also change with eccentricity and thus are candidates to explain the observed changes in phosphene size (Hubel and Wiesel, 1974). We hypothesized that, as found in nonhuman primates (Tehovnik et al., 2005a; Tehovnik and Slocum, 2007b, 2007c), the relationship between phosphene size and eccentricity observed in our data might be due to changes in CMF and the success of our model provides support for this idea.
Phosphene size versus current
Intuitively, we would expect that an increase in current would lead to the activation of more neurons and thus to the perception of a larger phosphene. Direct experiments examining this relationship, however, have been rare. Consistent with our results, experiments in nonhuman primates have found that delay fields increase in size as current is increased (Tehovnik et al., 2004; Tehovnik and Slocum, 2007a, 2007b, 2007c). Conversely, experiments that used penetrating electrodes in human subjects reported that phosphenes tended to be smaller when higher currents amplitudes were used, but larger when longer stimulus trains were used (Bak et al., 1990; Schmidt et al., 1996).
A recent study that combined ECoG recording, fMRI, and electrical stimulation to examine phosphene sizes and cortical activation in human subjects provided evidence that phosphene size increases with both eccentricity and the total charge delivered on single trials (Winawer and Parvizi, 2016). Furthermore, data from this study provide some evidence for saturation in phosphene size. However, on some trials, very large phosphenes, consistent with cortical activation >1 cm in diameter were observed. The exact source of these larger phosphenes is not clear. Winawer and Parvizi (2016) used stimulation settings of pulse width, pulse frequency, and stimulus train duration that are commonly used during clinical brain mapping, whereas our study used settings more typical of electrical stimulation experiments in nonhuman primates. Further work will be required to determine the relative influence of each of these parameters.
Although other factors such as use of bipolar rather than the monopolar stimulation, intersubject differences in psychophysical thresholds, and differences in how well the electrodes are apposed to the cortical surface could also result in differences in the absolute sizes of phosphenes measured, they are unlikely to offer a full explanation for the saturation in phosphene size that we observed.
Possible reasons for saturation
We cannot determine definitively the reason that phosphene size saturated in our experiments, in part because we did not measure cortical activity directly. However, the simplest interpretation of our results is to assume that all of the current is delivered to the cortex and that the relationship between cortical activity and behavior is maintained across the entire range of currents tested. This would imply that the saturation in the size of the phosphenes is due to saturation in the diameter of the activated region of V1.
Saturation in the amount of cortex activated could result from changes in the types of cells, cortical layers, and local circuits that are recruited as the current is increased (DeYoe et al., 2005). Indeed, it has been demonstrated that electrical stimulation of the thalamus or the cerebral cortex can alter the propagation of activity within the cortex by the rapid induction of cortical inhibition (Tolias et al., 2005; Logothetis et al., 2010).
Spread of activity in cortex
We have shown that a novel model that combines a sigmoidal curve to estimate the diameter of visual cortex activated, combined with an estimate of the local CMF, can predict phosphene sizes accurately (Fig. 6A,B). A very similar strategy, but with a different equation to predict cortical activation, was used to explain the size of saccade delay fields in monkeys (Tehovnik and Slocum, 2007b, 2007c).
Growing evidence suggests that cortical activity extending up to several millimeters beyond the distance predicted by passive current spread is elicited by electrical stimulation. This has been observed by combining electrical stimulation with electrophysiological recordings (Stoney et al., 1968), fMRI (Tolias et al., 2005; Logothetis et al., 2010), optical imaging of intrinsic signals (Brock et al., 2013), voltage-sensitive dye imaging (Seidemann et al., 2002), and two-photon calcium imaging (Histed et al., 2009). Consistent with our results, two of these imaging studies also found an increase in the diameter of cortical activation as the stimulation current was increased (Tolias et al., 2005; Brock et al., 2013), whereas one study found that the maximum spread of activity did not change as current was increased (Histed et al., 2009).
Early reports estimated that 2–3 mm of separation between surface electrodes was required to obtain separate phosphenes (Brindley and Lewin, 1968; Dobelle and Mladejovsky, 1974). Our results and model suggest that the exact distance required for perception of 2 separate phosphenes when 2 electrodes are stimulated simultaneously should vary depending on the amplitude of the current used for stimulation, but should be no larger than 5.3 mm on average. This prediction is based on an assumption of linear interactions between the electrodes and this will be important to test in future experiments.
Relationship between cortical activity and behavior
Despite the fact that activity spreads for millimeters more than is predicted by passive spread, it is the central core of this activation that appears to be best correlated with behavior. As discussed by others (Tehovnik and Slocum, 2007b, 2007c; Logothetis et al., 2010), there are a number of possible reasons for this disparity. For example, the cells in the directly activated region are likely to be activated earlier and could fire more synchronously as well. Furthermore, the readout of the activity pattern in V1 by downstream circuits could be biased toward the central region of the population activity.
Although we did not measure cortical activity directly, our study provides a behavioral measure of the “effective activity spread” resulting from electrical stimulation. By this we mean that the area of cortex that is both activated and read out by downstream cortical circuits in a way that is linked to behavior.
Implications for development of visual cortical prosthetic devices
Currently, there is renewed interest in the development of a VCP using electrical stimulation of early visual areas (Maynard, 2001; Schiller and Tehovnik, 2008; Normann et al., 2009; Fernandes et al., 2012; Lewis et al., 2015). Understanding the parameters that govern the size of phosphenes generated by single electrodes is an important step in learning how to communicate more complicated shapes to blind subjects. Further work will be required to examine how to communicate other important visual attributes such as brightness, color, and motion reliably.
Our study makes clear that one important feature to consider in the development of these devices will be the amount of current delivered to small regions of visual cortex. When current is increased beyond a certain value, we expect that rapid inhibition will be evoked and lead to saturation in response. Although saturation in phosphene size was observed here using electrical stimulation with subdural electrodes, it seems likely that similar restrictions could be faced when a set of closely spaced penetrating electrodes is located within the same volume of tissue, as is planned for several VCP devices in development (Troyk et al., 2005; Musallam et al., 2007; Lowery et al., 2015).
Footnotes
This work was supported by the National Institutes of Health (Grant EY023336). B.L.F. is supported by National Institute of Mental Health–National Institutes of Health Career Development Award R00MH103479.
The authors declare no competing financial interests.
- Correspondence should be addressed to William H. Bosking, Department of Neurosurgery, Baylor College of Medicine, One Baylor Plaza, Houston, TX 77030. wbosking{at}bcm.edu


